


 nueva página del texto (beta)
 Inglés (pdf)
 Artículo en XML
 Referencias del artículo
 Enviar artículo por email
 Citado por SciELO
  Similares en
SciELO
Similares en
SciELO 
 Permalink
Introduction
Depression is considered a serious public health problem that impacts approximately 350 million people worldwide. The World Health Organization (WHO) indicates that depression is a pathology with one of the highest costs for the public health care system and has ranked depression as the fourth leading cause of disability worldwide (WHO, 2012; 2017).
Population studies conducted in different countries have found different prevalence, for depression, with values ranging from 1.5% in Taiwan to 19.0% in Beirut (Kessler & Bromet, 2013). In Brazil, the prevalence of depression is estimated at 5.8% for the general population (WHO, 2017), and the lifetime prevalence is between 2.8% and 19.2% (Lopez et al., 2011; Stopa et al., 2015).
Some explanations for these differences are related to social contexts (Máximo, 2010) and specific risk factors in some populations (Peluso & Blay, 2008). However, we cannot dismiss the possibility that the differences could be related to the research methodology. The methodology of the studies varies in the definition of depression and evaluation tools. Furthermore, the access to health services by the poorest populations in developing countries may represent another complicating factor for the diagnosis of depression (WHO, 2012; 2017). In this scenario, the screening instruments for major depressive episode, in health surveys and health services could collaborate for the early detection of the disorder but need to have good psychometric qualities to be useful (Adler, Hetta, Isacsson, & Brodin, 2012; Stopa et al., 2015).
In Brazil, the Beck Depression Inventory (BDI), versions I and II, and the Patient Health Questionnaire (PHQ-9) are among the most commonly used instruments for depression screening (Aros & Yoshida, 2009). The BDI has restricted use by psychologists and physicians in country (Federal Council of Psychology, 2003), but the PHQ-9 can be used by any trained health professional (Santos et al., 2013). This characteristic increases the relevance of PHQ-9 for the screening of depression in Brazilian population (Oswaldo Cruz Fundation & Institute of Geography and Statistics, 2013).
The PHQ-9 is based on the diagnostic criteria of the Diagnostic and Statistical Manual of Mental Disorders (DSM) and includes items related to depressed mood, anhedonia, sleeping problems, lack of energy, changes in appetite or weight, feelings of guilt or worthlessness, concentration problems, feeling sluggish or restless, and having suicidal thoughts (American Psychiatric Association, 2014). The PHQ-9 has already demonstrated its capacity for screening depression in the Brazilian general population (Santos et al., 2013) and outpatient population (Osório, Mendes, Crippa, & Loureiro, 2009) by Classical Test Theory (CTT). In the general population, the sensitivity of the PHQ-9 was 77.5% and the specificity was 86.7% when a cut-off point of 9 was used and 57.5% of sensitivity and 94.1% of specificity with a cut-off point of 13 (Santos et al., 2013), while for women receiving treatment in primary care the values were 100% and 98%, respectively, considering 10 as cut-off point (Osório et al., 2009).
Until the 1980s the Classical Test Theory (CTT) was the most adopted approach for assessing the validity and reliability tests (Sartes & Souza-Formigoni, 2013). Since 2000 the Item Response Theory (IRT) has been gaining strength in the psychometric scenario in Brazil. The IRT is considered a complementary or alternative approach for investigating the psychometric qualities of instruments and identifies the level of discrimination for each item of the instrument (parameter a) and threshold parameters (parameter b) (Embretson & Reise, 2013). The IRT is based on generalized linear models which identify features of each instrument item in order to understand the relationship between the responses to the items and the latent trait (Embretson & Reise, 2013). The explanatory models of IRT are obtained considering the level of latent trait and items properties, allowing to estimate item individual influence and to control subsample influences (Meredith & Teresi, 2006). It also allows for the creation of different items with the same discriminative capacity, which controls learning effect in case of re-evaluation of participants (Zukowsky-Tavares, 2013). These are points not covered by CTT.
The IRT has been widely used to assess the adequacy of instruments in the field of mental health (Adler et al., 2012). Zhao, Chan, & Lo (2017) examined five scales for depression screening in China showing that the scale has great potential to identify moderate to severe depression. Forkmann, Gauggel, Spangenberg, Brähler, & Glaesmer (2013) examined the German version of the PHQ-9 and shows the scale has psychometric problems. To improve the psychometric qualities of the instrument, the authors proposed a recategorization of the range of responses. Kendel et al. (2010) also examined the German version of the PHQ-9 and confirmed that three items of the PHQ-9 provided relevant information about depression in patients undergoing cardiac surgery, but the other items provided little information. In turn, Adler et al. (2012) assessed the Swiss version of the PHQ-9 and the Montgomery-Åsberg Depression rating scale and observed that both scales can be useful for measuring depression in outpatients with affective disorder.
For Brazilian instruments, the IRT was applied only to evaluate the BDI. Castro, Trentini, and Riboldi (2010), and Castro, Cúri, Torman, & Riboldi (2015) used the IRT to investigate the Brazilian version of BDI and observed that the individuals with the higher severity of the disorder were those who responded with higher scores to items on weight loss, social withdrawal, and suicidal thoughts. They also observed that the items about sadness, feeling of failure, dissatisfaction, guilt, punishment, crying, fatigue, and loss of libido are the most discriminative.
Despite the good psychometric characteristics shown by the Brazilian version of PHQ-9 when assessed by the CTT, further investigation of the specific items of the scale may help in the calibration of the instrument for use in public health with different populations.
The effectiveness of the PHQ-9 for depression screening in Brazilian poor rural populations, such as quilombolas, was not investigated in previous studies. If the instrument is not suitable for this population, its use in public health studies may mask the needs of a very underserved population (Meredith & Teresi, 2006). In addition, the CTT model identifies only the cut-off points for the instrument, whereas the IRT shows the set of symptoms that most contribute for depression identification and characteristic responses of people with different intensities of depression per item. The objective of this study was to investigate the psychometric characteristics of the Brazilian version of the PHQ-9 using IRT to identify the discriminative capacity of items. This aimed to identify more discriminating items and verify the adequacy of the instrument to evaluate depression in a very specific rural population in Brazil, the quilombolas.
Method
Study design and participants
A population-based cross-sectional study was designed to assess selected health conditions and their determinants of rural communities (quilombos) in the city of Vitória da Conquista, Bahia State, Brazil. This population is protected by Brazilian law as it is composed by slaves’ descendants. Although quilombos are rural areas, they are difficult to cultivate. Most people living in these communities are black, slaves’ descendants, have low levels of education and live in poor health conditions (Gomes, Reis, Guimarães, & Cherchiglia, 2013).
The city of Vitória da Conquista has 25 certified quilombos distributed in five districts (Anjos & Cipriano, 2007). The sample design was defined according to the following criteria: 1. One community per district; 2. Communities with 50 households or more; 3. Random selection of households; and, 4. Interview all individuals 18 years old or more living in the selected households. Based on these criteria, 2 935 eligible adults were identified. The initial sample of the study was 884 people, but it was necessary to exclude some data due to many errors filling while in the questionnaires by participants or excessive missing data. The analyzes presented are based on responses from 764 participants. The authors did not use data imputation techniques due to the large number of information omitted by some respondents (Dibal, Okafor, & Dallah, 2017).
Measurements
This study investigated the outcome depression, considering it as a positive screening for major depressive episode measured by the PHQ-9. This scale consists of nine items and refers to the last 15 days, based on DSM. Each item has four possible responses (not at all to nearly every day), the total score can range from zero to 27 points. The scale has two cut-off points indicated in the Brazilian version: nine points for general population (Santos et al., 2013) and 10 points for hospitalized women (Osório et al., 2009).
Procedures
Data were collected through individual interviews conducted by trained interviewers at each participant home, using a health condition’s questionnaire and the PHQ-9. The questionnaire included questions related to various aspects of physical health (blood pressure, presence of diagnoses) and health services use. Interviewers’ training was conducted by psychologists through simulated data collection using the instruments with people living in the same city of the quilombolas. Data collection was followed by clarification of doubts. The data was collected in June 2013 using tablets.
Data analysis
To verify PHQ-9 unidimensionality and the independence of items we used the validated cut-off points for the Brazilian version of the instrument by CTT. Initially descriptive analysis was conducted for each item, followed by checking two prerequisites for IRT analysis: the latent trait unidimensionality and local independence. Unidimensionality is rare in complex events, such as depression, but is possible to conduct IRT analyzes when a predominant factor explains at least 20% of the variance of the results (Reckase, 1979; Embretson & Reise, 2013). As unidimensionality and independence are related, the local independence is assured when the unidimensionality or predominance of one factor is demonstrated (Reckase, 1979; Embretson & Reise, 2013). To verify these criteria, we initially conducted a principal component exploratory factor analysis and a confirmatory factor analysis (Reckase, 1979), and the contribution of each factor was verified by dividing each eigenvalue factor by the lowest value as proposed by Couto & Primi (2011).
For the item analysis of the PHQ-9, we used Samejima’s Graded Response Model (Samejima, 1969). The discrimination parameter (a) indicates how the item can differentiate individuals based on a specific quantity of a latent trait (θ) and is represented by the curve slope at the inflection point, where the probability of response is .5 (Baker, 2001; Embretson & Reise, 2013). Baker (2001) groups the ability to discriminate items as follows: zero = no discrimination, discrimination from .01 to .34 = very low, .35 to .64 = low discrimination; .65 to 1.34 = discrimination moderate, 1.35 to 1.69 = high discrimination; and, 1.70 or more = very high discrimination.
The difficulty parameter (b) indicates the items that participants will have a higher chance of answering were they to have certain amount of a latent trait. This parameter can have values between -3.0 and 3.0, with the largest positive values indicating responses that are given by people with a greater intensity of the latent trait (Baker, 2001). The best point of PHQ-9 discrimination was estimated multiplying the crude overall mean obtained by IRT to the standard deviation of PHQ-9 adding to this amount the mean of full scale as proposed by Castro et al. (2010) and by ROC Curve. Analyses were conducted using SPSS, version 23.0, AMOS 23.0, PARSCALE, version 4.1 and IRT Pro.
Results
Most of the participants were black (84.0%), female (53.5%), age 41 or older (51.4%), married (62.0%), and illiterate or had attended school for four years or less (71.7%). Most interviewees were unemployed (50.4%) and the average family income was US$ 278.00 for an average of four residents per household. The PHQ-9 total scores ranged from zero to 27 points ( Table 1 ), with a mean of 5.68 (SD = 5.67). The exploratory factor analysis showed that a single factor explained 54% of the total variance of the PHQ-9 (α = .87). The confirmatory factor analysis confirmed the presence of a single latent variable explaining the results (χ2/gl = 62.54; SRMR = .02; RMSEA = .05; CI 90% = .03 - .06; CFI = .98; TLI = .98) and covariance was demonstrated only between items 1 and 4, 4 and 8 and 6 and 7. When we calculated the unidimensionality (factor eigenvalue 4.46/lower eingen value .93), it was observed that the first component contributed 4.75 times for the variance of a possible second component. These results allowing for other IRT analyzes.
Table 1. Distribution of responses in PHQ-9 (N = 764)
| N | % | Mean | |
|---|---|---|---|
| Disinterest/lack of pleasure: | |||
| Not at all | 385 | 50.4 | .0 |
| Several days | 264 | 34.6 | |
| More than half the days | 38 | 5.0 | |
| Nearly every day | 77 | 10.1 | |
| Feeling down/depressed: | |||
| Not at all | 426 | 55.8 | .0 |
| Several days | 233 | 30.5 | |
| More than half the days | 42 | 5.5 | |
| Nearly every day | 63 | 8.2 | |
| Trouble sleeping: | |||
| Not at all | 359 | 47.0 | 1.0 |
| Several days | 251 | 32.9 | |
| More than half the days | 50 | 6.1 | |
| Nearly every day | 104 | 13.6 | |
| Fatigue/malaise: | |||
| Not at all | 329 | 43.1 | 1.0 |
| Several days | 281 | 36.8 | |
| More than half the days | 60 | 7.9 | |
| Nearly every day | 94 | 12.3 | |
| Appetite Problems: | |||
| Not at all | 417 | 54.6 | .0 |
| Several days | 226 | 29.6 | |
| More than half the days | 47 | 6.2 | |
| Nearly every day | 74 | 9.7 | |
| Feel bad about: | |||
| Not at all | 566 | 74.1 | .0 |
| Several days | 134 | 17.5 | |
| More than half the days | 24 | 3.1 | |
| Nearly every day | 40 | 5.2 | |
| Lack of concentration: | |||
| Not at all | 448 | 58.6 | .0 |
| Several days | 186 | 24.3 | |
| More than half the days | 54 | 7.1 | |
| Nearly every day | 76 | 9.9 | |
| Moving slowly or being restless: | |||
| Not at all | 485 | 63.5 | .0 |
| Several days | 185 | 24.2 | |
| More than half the days | 34 | 4.5 | |
| Nearly every day | 60 | 7.9 | |
| Thoughts that you would be better off dead: | |||
| Not at all | 694 | 90.8 | .0 |
| Several days | 41 | 5.4 | |
| More than half the days | 11 | 1.4 | |
| Nearly every day | 18 | 2.4 | |
Full-scale information analysis ( Figure 1 ) shows the satisfactory ability of PHQ-9 to provide information about depressive symptoms. Adopting the better performance evaluation for the instrument proposed by Castro et al. (2010), which calculates the instrument score that equals a curve above 1.0 for the information curve, we can observe that the PHQ-9 has its highest evaluation power for a score between zero and 22 points. The conversion of IRT scores for the full-scale score was estimated by values of the information curve by IRT multiplied by the standard deviation of the total scale punctuation, added to the general mean of the sample.

The PHQ-9 cut-off point estimated by the Roc Curve was 8 points, with a sensitivity of 1.0 and specificity of .93 and the best point for latent trait discrimination by IRT was 1.50, which can be converted into 14 points. Considering the cut-off of 8 points, 23,80% (CI = 23.37 - 24.23%).
Items characteristic curves and information contribution of items are presented in Table 2 and Figure 2 . The characteristic curves of items showed that all the PHQ-9 items yielded good discrimination ability, obtaining scores between high and very high. The information curves of the items showed that the items about injuring oneself and death (a = 3.24), moving slowly or being restless (a = 2.91) and thoughts feeling depressed (a = 2.89) contributed with more information on the level of depressive symptoms. The item that least contributed to discriminate the depression was “problems with sleep” (a = 1.39).
Table 2. Estimation of the parameters of Model Gradual Response of PHQ-9 (N = 764)
| a1 (SE)2 | b3 (SE)2 | b4 (SE)2 | b5 (SE)2 | |
|---|---|---|---|---|
| 1 - Lack of interest/lack of pleasure | 2.08 (.16) | .02 (.06) | 1.33 (.08) | 1.65 (.10) |
| 2 - Feeling Depressed | 2.89 (.26) | .75 (.06) | 1.57 (.09) | 1.87 (.11) |
| 3 - Problems with sleep | 1.39 (.11) | -.12 (.07) | 1.31 (.10) | 1.74 (.13) |
| 4 - Fatigue/malaise | 1.97 (.15) | -.22 (.06) | 1.10 (.08) | 1.53 (.10) |
| 5 - Appetite problems | 1.55 (.13) | .18 (.06) | 1.49 (.11) | 1.95 (.14) |
| 6 - Feeling bad about | 2.15 (.17) | .28 (.06) | 1.22 (.08) | 1.64 (.10) |
| 7 - Lack of concentration | 2.10 (.17) | .45 (.06) | 1.50 (.09) | 1.84 (.11) |
| 8 - Moving slowly or being restless | 2.91 (.33) | 1.51 (.09) | 2.00 (.12) | 2.29 (.14) |
| 9 - Thoughts that you would be better off dead | 3.24 (.28) | .18 (.05) | 1.25 (.07) | 1.58 (.09) |
Note:
1 = Discrimination parameter;
2= Standard Error;
3= point of intersection between response categories 0 and 1;
4= point of intersection between response categories 1 and 2;
5= point of intersection between response categories 2 and 3.
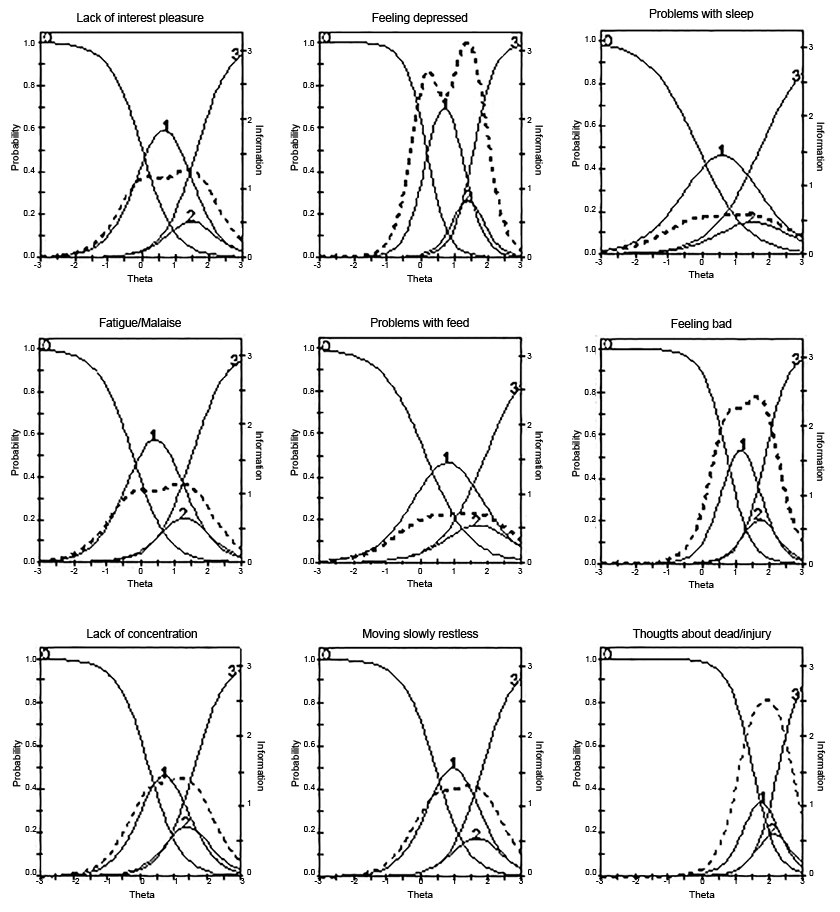
Note: Dotted = Information. Curve of item: 0 = Not at all, 1 = Several days, 2 = More than half days, 3 = Nearly every day
Figure 2. Characteristic curve and information curve of the items in the PHQ-9
The analysis of the parameter b is carried out by considering the comparison between the actual response point observed on the scale and a 50% chance that answer any other item (Embretson & Reise, 2013). In this study, the modal response for all items of PHQ-9 was “not at all”, given by people with a latent trait between - 3.0 and zero. People with higher latent trait tended to choose one of the others response alternatives, except for the item “Moving slowly or being restless”, which required greater intensity of depression to be endorsed so that the modal response did not was chosen (b = 1.51).
Moving slowly or being restless, feeling depressed, and lack of concentration were the items that required the existence of higher levels of latent trait for participants to respond, “more than half the days.” The item “moving slowly or being restless” required the highest level of latent trait (> 2.0) for people who chose “more than half the days” and “nearly every day.”
The analysis of the characteristic responses for the subgroups according to the intensity of depressive symptoms in the full scale (mild, moderate, and severe) is shown in Table 3 . It can be observed that the division made by CTT does not help to objectively discriminate the intensity of a latent trait, but it is possible using IRT analyses. But by IRT traits show up. For example, when assessing people screened for severe depression by PHQ-9, “feeling depressed” and “moving slowly or being restless” would be symptoms indicative of worse clinical status, since more frequent responses to these items require the presence of more latent trait.
Table 3. Latent trait by characteristic response separately by intensity of depressive symptoms in the PHQ-9 full-scale (N = 764)
| Mild | Moderate | Severe | |
|---|---|---|---|
| Disinterest/lack of pleasure: | |||
| Several days | -6.04 | 1.61 | -3.64 |
| More than half the days | -3.06 | .79 | -1.96 |
| Nearly every day | -.26 | .44 | - |
| Feeling down/depressed: | |||
| Several days | .31 | -2.88 | 4.03 |
| More than half the days | -.73 | .66 | 2.54 |
| Nearly every day | -1.45 | 4.41 | 2.03 |
| Trouble sleeping: | |||
| Several days | -1.54 | -3.84 | -2.35 |
| More than half the days | -.11 | -2.15 | -.06 |
| Nearly every day | .42 | -.58 | .53 |
| Fatigue/malaise: | |||
| Several days | -1.40 | 3.43 | -.88 |
| More than half the days | .45 | 1.53 | -.60 |
| Nearly every day | -.83 | .88 | -.16 |
| Appetite Problems: | |||
| Several days | -1.49 | -2.40 | -12.71 |
| More than half the days | .63 | -.46 | -10.15 |
| Nearly every day | .40 | .91 | -3.06 |
| Feel bad about: | |||
| Several days | 2.11 | 48.60 | -4.90 |
| More than half the days | .41 | 25.35 | -3.06 |
| Nearly every day | -2.08 | 7.09 | -1.32 |
| Lack of concentration: | |||
| Several days | -25.19 | -2.03 | -.25 |
| More than half the days | 11.75 | .10 | .32 |
| Nearly every day | 55.05 | .45 | - |
| Moving slowly or being restless: | |||
| Several days | -1.72 | 2.39 | 2.37 |
| More than half the days | -2.50 | 6.67 | 1.40 |
| Nearly every day | - | 9.72 | - |
| Thoughts that you would be better off dead: | |||
| Several days | 1.97 | -2.01 | -.51 |
| More than half the days | .11 | -.73 | .29 |
| Nearly every day | -1.14 | .14 | - |
Discussion and conclusion
Depression is predicted to become a major health burden worldwide increasing the importance of developing or using good clinical screening instruments (WHO, 2012; 2017). The PHQ-9 is a brief instrument to assess depression that can be administered relatively easily, including to rural and poor populations. Results of IRT analysis in the rural poor population of this study revealed that the PHQ-9 has acceptable psychometric properties of unidimensionality, good evidences of reliability, and a well-functioning rating scale.
For the quilombola population the cut-off point estimated by ROC Curve was 8 points. The cut-off point identified for the population of this study is lower than that adopted for the Brazilian general population and the most discriminative latent factor for PHQ-9 was 14 points. The best discriminative point indicated by IRT analysis was very close to cut-off point indicates by Santos et al. (2013) with the use of the correction algorithm for adult urban population (≥ 13 points). The algorithm correction is recommended by the authors to increase the specificity of the PHQ-9, contributing to reduce the proportion of false positives.
The specificity observed in the results of PHQ-9 among quilombolas adopting 8 points as cut-off point was higher than that observed in other studies. The observed result also remained within the range of the cut-off point for the PHQ-9 which showed good levels of sensitivity and specificity in the meta-analysis conducted by Manea, Gilbody, & McMillan (2012). In this study they observed a specificity ranging from .73, when adopting 7 as cut-off point, to .96, when adopting 15 as cut-off point. Other studies have also shown that the PHQ-9 has good discrimination capability for depressive disorders (Adler et al., 2012; Kendel et al., 2010; Zhao et al., 2017).
Using this cut-off point, the PHQ-9 screened depression in a number of people twice higher than the depression prevalence estimated for the Brazilian general population (WHO, 2017). These results corroborate data about precarious health conditions of quilombola population (Gomes et al., 2013; Oliveira, Pereira, Guimarães, & Caldeira, 2015), the need to establish mental health policies that consider this vulnerability, and to consider the characteristics of the sample when assessing the psychometric qualities of the instruments (Meredith & Teresi, 2006). They also show the usefulness of using screening instruments to identify depressive symptoms in poor areas (Zhao et al., 2017).
All nine items of PHQ-9 showed values between high to very high discrimination, indicating that each element of the PHQ-9 contributes with new information for assessing depression. Moreover, it was observed that responses indicating feeling of depression, moving slowly or being restless and thoughts that would be better off dead were the symptoms that demanded higher presence of latent trait, showing greater intensity of depression in rural and poor Brazilian population.
These results emphasize the advantage of IRT models to identify which items, i.e. depressive symptoms, have greater or lesser weight in the evaluation of levels of depression. The relevance of IRT analysis for depression screening scales has already been demonstrated (Adler et al., 2012; Zhao et al., 2017). Castro et al. (2010), and Uher et al. (2008) analyzed the BDI scale and pointed out the possibility of reducing the number of items and the need for recoding the answers according to their contribution for understanding depression. Kendel et al. (2010) also used IRT analysis to indicate that using only PHQ-2 items was more informative than all PHQ-9 items. Zhao et al. (2017) applied IRT on five depression screening scales and showed that PHQ-9 and Depression, Anxiety, and Stress Scale were the most accurate instruments for assessing depression in the Chinese population.
In this study, the gains of PHQ-9 appear in the possibility of classification and comparison of depressive symptoms about their discrimination and its difficult and the possibility of verifying the relationship between the intensity of depressive symptoms and the answer to each symptom (Kung et al., 2013). The analysis of the item characteristic curves allows for the detection of items with potential problems in the categorization of response alternatives. Our results showed that the item about disinterest/lack of interest, fatigue, appetite problems, feel bad and moving slowly, or being restless may be more useful to identify depressive trait if they receive a reclassification of their answers. The need for recategorization of PHQ-9 items and the presence of other psychometric problems with the instrument was also observed in the study of the German version of the scale (Forkmann et al., 2013).
Despite the good results about the psychometric qualities of the PHQ-9 in our study, it is necessary to remember that the qualities of an instrument are not universal and must be continually investigated and recalibrated. It is necessary to highlight that this study was conducted with a specific population (rural population living in quilombo communities) and results cannot be generalized to the overall Brazilian population. However, we should emphasize its use in rural and poor communities where depression is prevalent and highly undiagnosed, so proper treatment is provided. Future studies investigating the PHQ-9, with a representative general sample and other specific populations, may help to incorporate depression screening scales in the practice of the Brazilian public health system, minimizing the impact of non-diagnosis and the lack of treatment for affected people.

