


 nueva página del texto (beta)
 Inglés (pdf)
 Artículo en XML
 Referencias del artículo
 Enviar artículo por email
 Citado por SciELO
  Similares en
SciELO
Similares en
SciELO 
 Permalink
Introduction
Anger is a very important negative emotion, and nowadays it is considered an indicator of mental health, along with depressive mood and anxiety symptoms, within the orthodox psychopathological model ( Nadimpalli, Kanaya, McDade, & Kandula, 2016 ). The concept of anger proneness refers to a relatively enduring and transituational personality trait. On the other hand, state anger refers to a momentary and short-lasting outburst of anger; its intensity might be mild, moderate or, sometimes, severe, and it can be triggered by detriment or harm (being real or imagined), which in turn can cause an impediment to achieve a goal ( Spielberger & Reheiser, 2009 ).
The interbehavioral interpretation of anger ( Kantor, 1959 , 1969 ; Ribes-Iñesta, 2007 ) implies that some persons tend to experience anger proneness under certain specific circumstances which would not cause such a feeling in the case of other people. For instance, some individuals may experience anger proneness when they feel that someone else is asserting the opposite of what they have just previously said or when things do not go the way that such individuals expected. In this emotional behavior, certain environmental conditions (including some specific aspects of each individual) give rise to a discrete episode of anger, and the source of such circumstances is to be found in the reactive biography of the individual.
In terms of form, anger is expressed in a wide variety of behaviors. One of the most important characteristics of anger is the disorganized and chaotic behavior that does not end, as most psychological activities do, in a consummatory response. Precisely because of the absence of a consummatory response, the emotional behavior related to anger is considered as a behavioral segment without an answer. The behavioral segment of anger is clearly distinguished from other kind of behavioral segments because the latter allow a fluid exchange between the individual and their surroundings since there are stimulus and response functions harmoniously linked in an appropriate environment; nevertheless, this does not happen in the irascible behavioral segment ( Kantor, 1959 , 1969 ; Ribes-Iñesta, 2007 ). A high level of anger is a risk factor for the development of heart diseases and stroke ( Kitayama et al., 2015 ; Mostofsky, Penner, & Mittleman, 2014 ), and hypertension ( Ford et al., 2016 ; May, Sanchez-Gonzalez, Hawkins, Batchelor, & Fincham, 2014 ).
Recent studies have also linked anger with several psychiatric disorders, such as depression, neuroticism, attention deficit, and hyperactivity disorder, and problems with the consumption of alcoholic beverages ( Lubke, Ouwens, deMoor, Trull, & Boomsma, 2015 ; Morrison, Noel, & Ogle, 2012 ) and alcohol-related aggression ( Giancola, 2002 ). Likewise, other researchers have also found strong links between anger and psychotic disorder, drug dependence, bipolar disorder, and schizotypal and borderline personality disorders ( Okuda et al., 2015 ).
Therefore, the important negative effects of anger on health highlight the value of developing short, reliable, and valid instruments that allow its assessment whether for the purpose of research, clinical diagnosis, and/or evaluation of interventions aimed at reducing it effectively. Thus, in view of the scarce number of instruments available for its use in the Spanish-speaking population, the aim of this study has been the development of an instrument for the measurement of anger proneness and the assessment of its validity (of construct, convergent, and discriminant, and its reliability) so that it can be used for research and, probably, clinical purposes.
The state-Trait Anger Expression Inventory-2 (STAXI-2) is a widely used instrument to assess anger proneness. There are several studies that have tried to adapt and corroborate the factor structure of STAXI-2 ( Spielberger, 1999 ) and to determine its internal consistency in different Latin samples from Mexico ( Alcázar, Deffenbacher, & Byrne, 2011 ; Moral, González, & Landero, 2010 ; Moral & Segovia, 2015 ; Moral, Ramos-Basurto, & Segovia-Chávez, 2015 ; Oliva, Hernández, & Calleja, 2010 ). The evidence to support its use has been contradictory in the Mexican studies. Those contradictory findings were to be expected if one considers the ethnocentric premise that posits that psychological traits, and the instruments created to assess them, are necessarily universal.
Mixed results have been found with respect to gender differences in expression of anger. Among non-clinical population, Cubito and Brandon (2000) found that adult women showed higher anger scores than adult men; nevertheless, some researchers have found no differences between men and women with regards to the feeling of anger, although women tend to express it more frequently ( Averill, 1983 ; Evers, Fisher, Rodriguez-Mosquera, & Manstead, 2005 ). In the case of boys and girls, some studies have not found differences in the level of anger between both genders ( Burt, 2014 ; Pullen et al., 2015 ), but other studies have found that female adolescents experienced a higher level of anger than male adolescents ( Dey, Rahman, Bairagi, & Roy, 2014 ; Spielberger & Reheiser, 2009 ).
According to the results shown by this literature, a scale with factorial invariance is needed. Thus, the aims of this research were: a) to develop a valid and reliable instrument to measure anger proneness and b) to find out if García’s Anger-Proneness Scale can measure anger regardless of gender.
Method
Participants
A sample of volunteers from Monterrey, Mexico, was recruited through an online, non-probability sampling method.
Measures
The instrument includes socio-demographic questions (age and sex) and the following scales:
García’s Anger Proneness Scale (APS-G).This scale, which was created for this study, comprises four items which are evaluated along an agreement, four-point Likert-type scale (4 = Yes; 3 = I think so; 2 = I do not think so; and 1 = No). The sum of the four items yields a total score such that a higher score means greater anger proneness.
Sub-scale of External Expression of Anger from STAXI-2 (Spielberger, 1999). It is a self-report scale composed of six items which are evaluated along a four-point Likert-type scale (from 4 = almost always to 1 = almost never). We used the Spanish version elaborated by Miguel-Tobal, Casado, Can-Vindel, and Spielberger (2001). The scale has been validated in general population from Monterrey, Mexico, by Moral and Ramos (2015). This instrument was used to estimate convergent validity of APS-G. In the present study, STAXI-2 showed a one-factor structure and showed good indices of internal consistency (α = .751 and ω = .753).
Satisfaction with Life Scale (SWLS) (Diener, Emmons, Larsen, & Griffin, 1985). It is a self-report scale composed of five items which are evaluated along a six-point Likert-type scale (from 6 = disagree strongly to 1 = agree strongly). We used the Spanish version elaborated by Atienza, Pons, Balaguer, & García-Merita (2000). The scale has been validated among Mexican university students by Padrós, Gutiérrez, and Medina (2015). This instrument was used to estimate the discriminant validity of APS-G since it has been previously shown that there exists a negative relationship between anger and life satisfaction (Kerhervé, Gay, & Vrignaud, 2008; Schimmack, Oishi, Fuur, & Funder, 2004). In the present study, this scale showed a one-factor structure and good indices of internal consistency (α = .834 y ω = .835).
Procedure
First, an initial set composed of eight items was created, which were evaluated along a four-point Likert-type scale (4 = Yes; 3 = I think so; 2 = I do not think so; and 1 = No). This instrument was elaborated considering the interbehavioral interpretation of anger, specifically the interactive style of personality construct ( Ribes-Iñesta, 2009 ). The questionnaire was administered at the university classrooms and online. In both cases, it was clarified that the response to the questionnaire would be anonymous and confidential.
Data analysis
Measures of central tendency were calculated for the variable age and, in the case of categorical variable gender, the corresponding percentages were calculated. To determine the final version of García’s Anger-Proneness Scale (APS-G) the following criteria should have to be met:
The factor loadings for each one of the items should be equal to or greater than .40 (λ ≥ .40) (Williams, Onsman, & Brown, 2010).
To be accepted as a component of APS-G, any factor would have to show a Cronbach’s alpha higher than .70 (Nunnally & Bernstein, 1994).
Before performing a factor analysis, the Kaiser-Meyer-Olkin (KMO) test for sampling adequacy was assessed; a value higher than .60 was considered adequate. Likewise, it is necessary to reject the null hypothesis of equivalence of the correlation matrix to an identity matrix through the Bartlett’s test of sphericity; small values (less than .05) of the significance level indicate that factor analysis may be performed. To identify the factorial structure of APS-G, confirmatory factor analysis (CFA) was performed using unweighted least squares and maximum likelihood as extraction method, respectively. The assumption of multivariate normality was assessed through Mardia’s multivariate kurtosis coefficient; this assumption is fulfilled if its value is lower than 70 ( Rodríguez & Ruiz, 2008 ). The goodness of fit of the model was assessed through the estimation of the following goodness of fit indices: chi-square, Goodness of Fit Index (GFI), Comparative Fit Index (CFI), Root Mean Square Error of Approximation (RMSEA), Standardized Root Mean Square Residual (SRMR), and the relative chi-square (χ2/df); values between two and three, or up to a difference ≤ 5, indicated a good fit of the model. Overall, GFI, and CFI values > .95, as well as RMSEA and SRMR < .08, are considered as indicators of a goodness of fit from good to adequate between the hypothetical model and the data ( Hu & Bentler, 1999 ). In addition, to check factorial equivalence, the Tucker-Lewis Index (TLI), which must be higher than .95 ( Ten-Berge, 1986 ), is considered as the first criterion.
The factorial invariance between men and women was estimated ( Byrne, 2008 ). Internal evidence for convergent validity was obtained by calculating the average variance extracted (AVE) from the factor; AVE > .50 was considered as satisfactory ( Fornell & Larcker, 1981 ). In addition, the evidence for convergent and discriminant validity was obtained by calculating the Pearson´s correlation coefficient between the APS-G score and other measures that are theoretically related to anger proneness, such as the external expression of anger and the satisfaction with life measured through the STAXI-2 and the SWLS. The effect size of the correlations was calculated (r ≥ .20: minimum, ≥ .50: moderate; ≥ .80: strong) and their CIs. The reliability of APS-G scores was estimated through Cronbach’s alpha coefficient ( Cronbach, 1951 ) and McDonald’s omega coefficient ( McDonald, 1999 ).
Finally, the percentage of participants both male and female, that expressed a significant anger proneness, was calculated, and these were defined as those people scoring in the highest third of the distribution ( Patrick & Iacono, 1989 ). Statistical analyses were performed through SPSS and AMOS 24.
Ethical considerations
The names of those responsible for the study and its electronic address were provided so that the participants could request information or support in relation to any question raised by the study. No identification data were asked for to the participants to assure their anonymity, and the confidentiality of the information provided through this questionnaire was guaranteed.
Results
A sample composed of 457 volunteer participants from the general adult population was recruited: 161 women (35.2%) and 296 men (64.8%). The mean age of the whole sample was 36.87 years (range: 18 – 65 years old; SD = 12.51); the mean age of the subsample composed of women was 36.33 years (SD = 12.07) and the mean age of the subsample composed of men was 37.86 years (SD = 13.28). No significant and important differences were found between the mean age of men and women (t234 = 1.249; p = .001; d = .12; 95% CI [-.07, -.31]). Table 1 shows the descriptive statistics of each one of the items composing APS-G. The assumption of multivariate normality was fulfilled (Mardia’s coefficient = .684), thus proving that there will be no problem to continue with the successive statistical analyzes.
Table 1. Factorial structure of the final version of APS-G, descriptive statistics, and correlation between the items composing the scale
| Items | M | SD | Sk | K | item 1 | item 2 | item 3 | item 4 |
|---|---|---|---|---|---|---|---|---|
| 1. I get angry easily | 2.75 | 1.05 | -.28 | -1.14 | 1 | - | - | - |
| 2. I can get angry at any time | 2.86 | 1.05 | -.45 | -1.04 | .53* | 1 | - | - |
| 3. It makes me angry that things do not go the way I want | 2.26 | 1.09 | .35 | -1.18 | .38* | .34* | 1 | - |
| 4. If someone contradicts me, I get angry | 3.10 | .94 | -.69 | -.58 | .34* | .38* | .47* | 1 |
Note:Note: M = mean; SD = standard deviation; Sk = Skewness; K = Kurtosis;
*p < .01
The Kaiser-Meyer-Olkin (KMO) value was .710 and Bartlett’s test of sphericity was significant (χ2 = 382.642; df = 6; p = .001), and then it was proceeded to perform directly CFA ( Suhr, 2006 ).
Confirmatory factor analysis (CFA)
Confirmatory factor analysis (CFA) was used to estimate the unidimensionality of the construct. The model showed good goodness of fit indices (χ2 = 5.515, df = 2, χ2/df = 2.575, CFI = .993, GFI = .996, RMSEA = .051, SRMR = .019); three out five of these indices were greater for APS-G than for STAXI-2 (GFI = .988, CFI = .985, SRMR = .027). The analysis of standardized factorial loadings (λ) for the one-factor model (item 1 = .69, item 2 = .69, item 3 = .58, item 4 = .58), which are shown in Figure 1 , have the expected direction and an average λ higher than the value recommended by several authors ( Williams et al., 2010 ). Likewise, the one-factor model showed internal evidence of convergent validity (AVE = .62). The four items composing APS-G did not show high correlations (r > .90); thus, it is possible to say there is no multicollinearity ( Tabachnick, Fidell, & Osterlind, 2001 ). These data provide evidence of internal discriminant validity ( Merino-Soto, Domínguez-Lara, & Fernández-Arata, 2017 ).
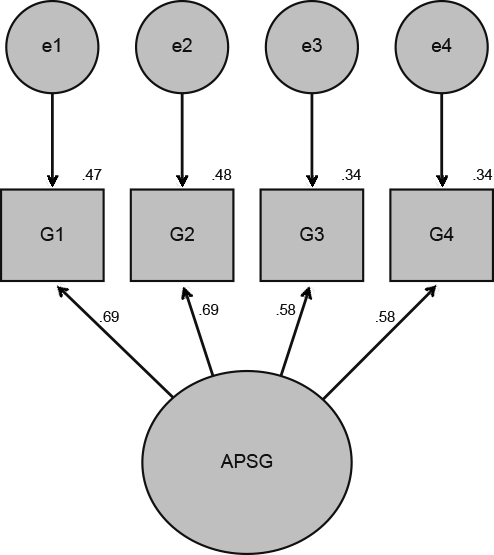
Source: Figure elaborated by the authors. G1 = I get angry easily, G2 = I can get angry at any time, G3 = It makes me angry that things do not go the way I want, G4 = If someone contradicts me, I get angry.
Figure 1. Unidimensional model of APS-G.
Considering the results shown on Table 2 , the CFA of the one-factor structure for the sample composed of men showed appropriate goodness of fit indices (GFI = .990 and RMSEA = .067). Likewise, the measures of incremental adjustment and parsimony were higher than the parameters of the independent model and were very like the parameters found with the saturated model. On the other hand, the goodness off it indices for the sample composed of women were also favorable (GFI = .993 and RMSEA = .068) and, as in the sample composed of men, the incremental adjustment and parsimony indices for the one-factor model were higher than those for the independent model, and were very similar to the parameters found with the saturated model. In both samples the absolute, incremental, and parsimony indices were adequate.
Table 2. Absolute, incremental, and parsimony indices of the CFA for men and women (*p < .001)
| Model | χ2 | df | Parsimony | ||||||||
|---|---|---|---|---|---|---|---|---|---|---|---|
| Absolute indices | Incremental indices | indices | |||||||||
| χ2/df | GFI | RMSEA | AGFI | TLI | CFI | AIC | |||||
| Factorial solution for men | |||||||||||
| Unifactorial solution | 3.676 | 2 | 1.838* | .990 | .067 | .986 | .970 | .990 | 27.676 | ||
| Independent | 171.675 | 6 | 28.613* | .654 | .386 | .423 | .000 | .000 | 187.675 | ||
| Saturated | .000 | 0 | 1.000 | 1.000 | 28.000 | ||||||
| Factorial solution for women | |||||||||||
| Unifactorial solution | 5.385 | 2 | 2.693* | .993 | .068 | .987 | .958 | .986 | 29.385 | ||
| Independent | 245.096 | 6 | 40.849* | .723 | .330 | .538 | .000 | .000 | 261.096 | ||
| Saturated | .000 | 0 | 1.000 | 1.000 | 28.000 | ||||||
The factorial loadings (λ´s) of each item of APS-G are adequate, both in the sample composed of men (item 1 = .737, item 2 = .742, item 3 = .560, item 4 = .582), as in the sample composed of women (item 1 = .649, item 2 = .663, item 3 = .606, item 4 = .590).
Factorial invariance between men and women
Initially, the value obtained from TLI = .980 offered sufficient evidence to continue the analysis of factorial invariance. Thus, Table 3 shows the calculation of the unconstrained model (M1); the fit indices obtained in this model (χ2 = 9.063, df = 4; χ2/df = 2.266; RMSEA = .048; SRMR= .0302) were adequate ( Hu & Bentler, 1999 ).
Table 3. Goodness-of-fit indices for invariance models (*p < .001)
| Model | χ2 | df | χ2/df | RMSEA | SRMR | AIC | CFI | ΔCFI |
|---|---|---|---|---|---|---|---|---|
| M1. Unconstrained | 9.063* | 4 | 2.266 | .048 | .0302 | 57.063 | .987 | |
| M2. Configural invariance | 9.901* | 7 | 1.414 | .027 | .0363 | 51.901 | .993 | .006 |
| M3. Metric invariance | 14.411* | 11 | 1.310 | .024 | .0366 | 48.411 | .992 | .004 |
| M4. Strong invariance | 19.699* | 15 | 1.313 | .024 | .0487 | 45.699 | .988 | .005 |
| M5. Strict invariance | 19.716* | 16 | 1.232 | .021 | .0509 | 43.719 | .991 | .003 |
Note: χ2/df ( < 3 good); CFI ( > .95 excellent); RMSEA ( < .05 good; between .05 and .10 moderate); SRMR ( < .09)
The values obtained for the analysis of Configural Invariance (M2), SRMR = .0363, and RMSEA = .027 provided additional evidence to the invariance model. In addition, the value of the Akaike Information Criterion (AICM1-M2 = 5.162) and CFI did not show significant changes in models M1 and M2. Likewise, after applying the criterion of Cheung and Rensvold (2002) for nested models, it was found that the difference between CFIs obtained in the models M1 and M2 was lower than .01 (CFIM1-M2 = .006). Thus, it was possible to accept the Configural Invariance model.
The next model ( Table 3 ) was the Metric Invariance Model (M3), considering the Strong Invariance Model (M4 - intercept values). The values of SRMR = .0366 and RMSEA = .024, in addition to the difference between the CFIs (CFIM3-M4 = .004) and AICs (AICM3-M4 = 2.712), allowed to accept the Metric Invariance model. The next step was to assess the equivalence between M2 and M4. The Strong Invariance Model showed an adequate fit ( Table 3 ) regarding its nesting with M2. The difference found between CFIs was .005; SRMR = .0487 and RMSEA = .024. Therefore, the Strong Invariance Model was accepted, thus concluding the equivalence with respect to the factorial coefficients and the intercept values.
Finally, we assessed the Strict Invariance Model (M5). The values shown in Table 3 supported M5. The differences found between CFIs and AICs of M5 and M4 (CFIM5-M4 = .003; AICM4-M5 = 1.98), in addition to the value of RMSEA = .021 and SRMR = .0509, supported M5. Thus, these results confirmed that APS-G has a factorial structure that fits to the proposed invariance models ( Table 3 ).
Comparison of means between men and women
Among the 467 participants, 98 out of 161 male participants (61.5%) and 168 out of 296 female participants (57.1%) obtained a score in the highest third of the distribution. The means between men (M = 10.91; SD = 3.10) and women (M = 11.01; SD = 3.07) were compared. The results showed the absence of significant differences in anger proneness (t455 = -.331; p > .001; d = .03). Practical significance is null ( Cohen, 1992 ).
Convergent and discriminant validity
Correlations between APS-G and STAXI-2 (r = .561; p < .01; 95% CI [.49, .77]), and between APS-G and SWLS (r = -.179; p < .01; 95% CI [.09, .42]) showed the expected direction and were significant. Correlation between APS-G and STAXI-2 showed a medium effect size (r ≥ .50); correlation between APS-G and SWLS showed a trivial effect size (r < .20) ( Ferguson, 2009 ).
Reliability of APS-G
The reliability of APS-G was assessed through alpha (α = .731; 95% CI [.69, .77]) and omega (ω = .732). Alpha for the sample of men was α = .75 (95% CI [.68, .81]) and omega was ω = .753; for the sample of women, alpha was α = .722 (95% CI [.66, .77]) and omega was ω = .722. The values of these coefficients for the whole sample as well as for the men and women samples supported APS-G reliability.
Discussion and conclusion
The primary objective was to analyze construct validity of a brief scale to measure anger proneness. According to CFA, a unifactorial structure was found. APS-G also showed adequate reliability, appropriate goodness of fit, and factorial invariance. Following the methodological recommendation of Campbell and Russo (2001) , the use of STAXI-2 and APS-G and the fact of having a moderate correlation between both scales validate the existence of APS-G. Thus, it is possible to assert that APS-G is as good as STAXI-2 in Ibero-American countries. With reference to discriminant validity, SWLS was used because having a satisfactory evaluative conception of one’s life would be in contradiction with the disposition to experience anger; indeed, a negative correlation was found between SWLS and anger proneness, providing validity to APS-G.
Ribes-Iñesta (2009) developed a model to explain personality traits and created the psychological construct known as interactive personality style. García-Cadena, Téllez-López, Ramírez-Aguillón, Ramírez-Hernández, and Pérez-Cota (2016) used it for developing instruments aimed at measuring dispositional optimism, generosity, and forgiveness. Using an interbehavioral interpretation, the four items composing APS-G can be classified into two categories. Items 1 and 2 refer to a generalized transituational disposition to get angry ( Table 1 ). Items 3 and 4 refer to getting angry when any person or situation hinders the achievement of what is wanted. The multiple historical interactions that have been differentially accumulated within a subject´s reactive biography explain why some persons get angry under some circumstances while other individuals show an impressive immutability when they are confronted with the same circumstances.
Several groups of researchers ( Shaver, Schwartz, Kirson, & O’Connor, 1987 ) have proposed that anger is an emotion composed of eight factors, namely: 1. antecedents, 2. cognitive reactions, 3. non-verbal expressions, 4. verbal expressions, 5. body sensations, 6. interpersonal responses, 7. primary self-control, and 8. secondary self-control. Alonso-Arbiol et al. (2011) based their research on that study and created a six-item scale (α = .61) for assessing the factor antecedents, four of which have great similarity with the four items composing APS-G.
This study is the first one that analizes the factorial invariance of a brief scale to assess anger pronenness. Configural, metric, unrestricted, strong, and strict factorial in variances were maintained when comparing men and women, which is a prerequisite for any comparison between groups ( Byrne, 2008 ). This suggests that items composing APS-G measure the same latent variable ( Brown, 2006 ), and data also support the unidimensional structure of APS-G and factorial invariance.
However, a limitation is that the findings support the use of APS-G for research and screening purposes, but not for decision-making in a clinical setting ( DeVellis, 2003 ). Likewise, this study covers only one of the eight components of anger. A final limitation refers to the absence of sensitivity and specificity computations of APS-G. Nevertheless, following the recommendation of Patrick and Iacono (1989) , those participants scoring in the highest third of the distribution could be considered as persons possesing the trait of anger proneness.
Therefore, to measure anger proneness with a lower margin of error, it is pertinent to continue investigating other instruments composed of a higher number of items that might contribute to making more informed judgments ( Nunnally & Bernstein, 1994 ). Finally, the conclusions are provisional, until other studies are carried out in similar cultural groups, which would allow adding evidence in favor or against APS-G.

