


 text new page (beta)
 English (pdf)
 Article in xml format
 Article references
 Send this article by e-mail
 Cited by SciELO
  Similars in
SciELO
Similars in
SciELO 
 Permalink
INTRODUCTION
During the sleep process it is difficult to identify the behavioral, physiological, and cognitive characteristics that accurately determine sleep-onset (Ogilvie, 2001). It has been proposed that the transition from wakefulness to sleep is a process of continuous, gradual change between the two states (Merica & Fortune, 2004). In this transition, the presence of changes in the synchronization level of the electroencephalographic activity (EEG) is obvious (Steriade & McCarley, 2005), as a result of which the EEG study is one of the most frequently studied electrophysiological parameters in sleep onset. It has been proposed that spectral analysis is useful for studying the dynamic changes of EEG during this period (Merica & Fortune, 2004). The Fast Fourier transform (FFT) is a commonly used procedure for analyzing the spectral power of the EEG during different segments of wakefulness and sleep, followed by statistical analyses that make it possible to find significant differences between these segments (Table 1).
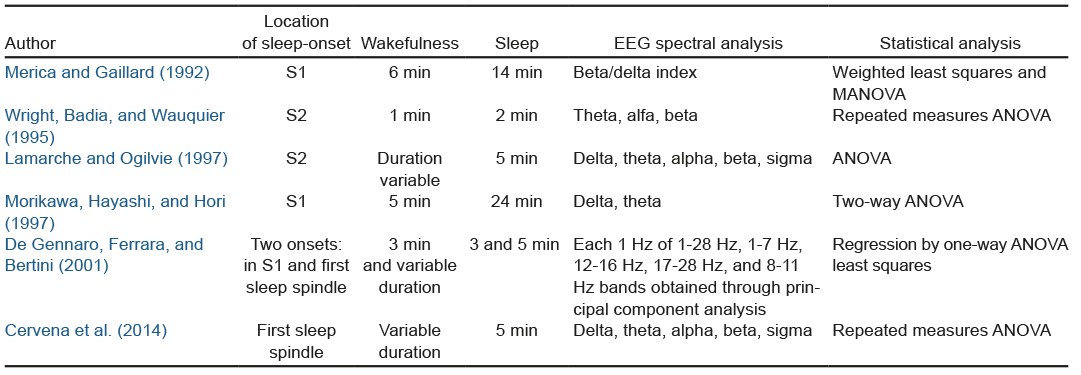
The studies mentioned in Table 1 differ in the location of sleep onset, the duration of the wake-sleep transition period, and the EEG derivation used. Most of these studies use variance analysis to evaluate the temporal variation, especially repeated measures ANOVA. Variance analysis has also been used to study autonomic changes during this period (Burgess, Kleiman, & Trinder, 1999; Carrington, Walsh, Stambasm, Kleiman, & Trinder, 2003; Carrington et al., 2005; Zambotti, Covassin, Min Tona, Sarlo, & Stegagno, 2011). However, it has been suggested that this analysis is insensitive for detecting specific changes that occur in time series with psycho-physiological data (Rosenfield et al., 2010), which we regard as a limitation for studying the electrophysiological changes that occur during the wake-sleep transition.
In this respect, the main objective of change point analysis (CPA), an adapted approximation of the theory of statistical quality control, is to locate more accurately the occurrence of changes in statistical properties, as a mean or variance, of a time series, and to determine the duration of this variation (Chen & Gupta, 2012; Montgomery, 2009). One CPA method is the cumulative sum chart, which considers all the information in the sequence of values of the time series, meaning that it is effective for detecting small changes and with n = 1 size samples (Hawkins & Qiu, 2003). To our knowledge, CPA has not previously been used to study the wake-sleep transition.
Based on the hypothesis that the change detected by CPA in the activity of a physiological variable is an indicator of a change in the process that produces it, we consider that the use of CPA will help determine whether different physiological variables modify their state at the same time during the wake-sleep transition. The purpose of this research was to determine whether CPA makes it possible to identify and characterize changes in EEG, muscle, and cardiac activity during a two-minute segment taken from the transition between wakefulness and the F1 sleep stage 1.
METHOD
Participants
Men and women aged 18 to 30 were invited to participate. The inclusion criteria were that they did not smoke, that they only occasionally consumed alcohol and that they did not use cannabis or illegal drugs. Moreover, they should not experience problems in sleep-onset or sleep-maintenance. An interview was conducted to ensure that they did not have a medical diagnosis of chronic disease or psychiatric disorders. In women, records were taken between the fifth and tenth day after the start of their menstrual period. All participants were provided with information on the research procedure and subsequently signed an informed consent letter.
Procedure
During the period from February, 2014 to November, 2016, polysomnography records (PSG) were undertaken for two consecutive nights at the Laboratorio de Neurociencias de la Facultad de Psicología de la UNAM, Mexico. The first was regarded as an adaptation night and used to detect the presence of any sleep disorder indicators. On both nights, the EEG was obtained with contralateral references to the mastoids: C3-M2, C4-M1, O1-M2, O2-M1. The electro-oculogram (EOG), the surface electromyography (sEMG) of the chin, and the electrocardiogram (ECG) were also recorded. PSGs were conducted using a Cadwell Easy II equipment (Kennewick, Washington, USA). The start of the recording (with lights off) was adjusted for each participant according to the usual time when they went to sleep and they were given approximately eight hours to complete it. Sleep stages were rated by R & K norms (Rechtschaffen & Kales, 1968). For this study, only the data obtained from the second night of the participants who did not show sleep disorder indicators on the adaptation night were considered.
Measurements
Sleep-onset was established during the first phase classified as sleep stage 1 (S1) of sleep without rapid eye movements (NREM). The duration of the transition period was two minutes, including one minute of wakefulness prior to the first S1 and one minute of the latter. For the analyses, only records without artifacts that would distort the continuity of the EEG, SEMG, and ECG signals were chosen.
The selected samples of the electrophysiological signals belonging to the transition period were exported in EDF format and converted into ASCII format for subsequent processing. The sampling frequency of these signals was 400 Hz.
EEG: a .5 to 35 Hz bandpass filter was used; FFT was used to conduct a spectral power analysis of the delta (.5-4 Hz), theta (4-8 Hz), alpha (8-12 Hz), and beta bands (16-32 Hz) of the O1 and O2 occipital derivations. FFT was calculated every second through the jEDF software version 2.0.1 (Nizar Kerkeni, 2003-2006). These values were subsequently averaged into 5-second segments per band. The relationship between the beta and delta bands was also calculated.
sEMG: a 10 to 59 Hz bandpass filter was used, the sEMG was analyzed by 5-second segments with the quadratic mean and the FFT was used to obtain the median and mean frequency using BioProc software version 3.06 (D.G.E. Robertson, 1998-2008).
ECG: A .5 to 70 Hz bandpass filter was used. QRSTool software version 1.2.2 was used to obtain the intervals between each heartbeat (Allen, Chambers, & Towers, 2007). Subsequently, CardioBatch software (Brain-Body Center, University of Illinois, 2007) was used to obtain the heart rate (HR) and respiratory sinus arrhythmia (RSA) in 5-second segments. Since the method used by the CardioBatch requires approximately 12 seconds to obtain the first RSA value, 12 seconds of cardiac activity had to be included before the first waking segment, as a result of which the duration of the transition period was two minutes 12 seconds.
Statistical analyses
As in each electrophysiological variable, averages were obtained every five seconds, a time series was created with 24 values, 12 of which corresponded to wakefulness (W1-W12) and 12 to S1 of NREM sleep (N1-N12). Each time series was analyzed with the repeated measures ANOVA and the CPA. With the repeated measures ANOVA, the univariate approximation was used, and with the Greenhouse-Geiser correction method, carried out using IBM SPSS Statistics 21.0 software, the statistical significance was p < .05.
The CPA was conducted using the Change-Point Analyzer shareware program, version 2.3 (Taylor Enterprises, Illinois, 2009). The method implemented by this software includes a combination of analyses of cumulative sums and bootstrapping. The fact that the level of activity before and after every change identified was known made it possible to determine whether the change involved an increase or decrease. To obtain the duration of the change, all subsequent segments were added to their location in the time series, until they were finalized or another change occurred. Only changes with a confidence level of over 95% were considered. Since CPA can analyze time series as a group average and individually, both analyses were used.
RESULTS
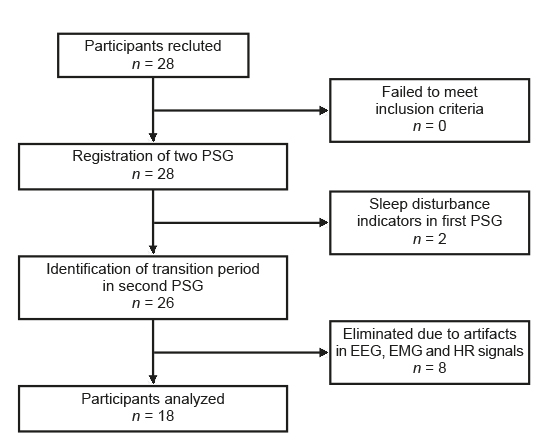
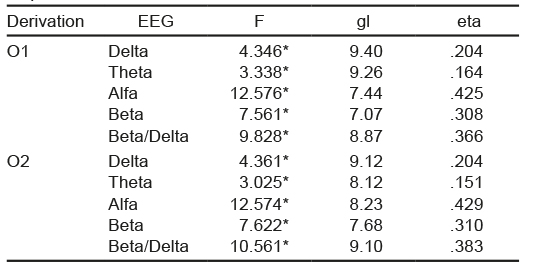
Twenty-eight healthy volunteers participated. For the results, only the data of 18 participants were considered (Figure 1): 12 women with an average age of 24.6 years (standard deviation SD = 4) and six men with an average age of 25.5 years (SD = 3.3). Sleep-onset latency was 6.3 minutes (SD = 5.4). Of the electrophysiological variables analyzed, repeated measures ANOVA only detected significant differences in the EEG activity (Table 2). The main trend observed was that in both occipital derivations, the potency of the alpha, beta, and beta/delta bands was higher in the segments associated with wakefulness, whereas in the delta and theta bands, the power was greater in the segments corresponding to sleep.
Group CPA
In muscle activity, no changes were found in the median frequency or in the root mean square, in the HR, a decrease in wakefulness was observed in the W7 segment. Regarding EEG activity, there were decreases in the potency of the alpha, beta, and beta/delta bands in segments W7, W8 and N1. Increases in the segments corresponding to sleep predominated (Table 3). In Table 3, each box indicates whether the segment in which the change was located corresponded to wakefulness or sleep (there were 12 segments for each state) and arrows are used to indicate the type of change (increase or decrease). For example, there was an increase in the O1 left occipital derivation in the delta band in the eighth segment corresponding to sleep (N8) (marked with an upward pointing arrow ↑).
Table 3 Changes per group in the EEG spectral analysis

Note: O1 = left occipital; O2 = right occipital; W = Wakefulness the subscript indicates the segment in which the change was located; N = NREM sleep stage 1; the subscript indicates the segment in which the change was located; ↓ = change associated with decrease; ↑ = change associated with increase.
CPA by individual
A total of 156 changes were detected in all the variables evaluated: 63 (40%) took place in wakefulness and 93 (60%) during sleep. In the waking segments, there were 42 decreases and 21 increases; in the sleep segments there were 56 decreases and 37 increases. No significant differences were observed in relation to age and gender in the changes detected.
Ten participants showed more than one change in the same variable; 60% of the time the first change occurred during wakefulness and the second one during sleep. Only one participant showed changes in all the variables, experienced decreases in RSA, the root mean square of the sEMG, the alpha power and beta/delta index, and increases in HR and the median frequency of sEMG.
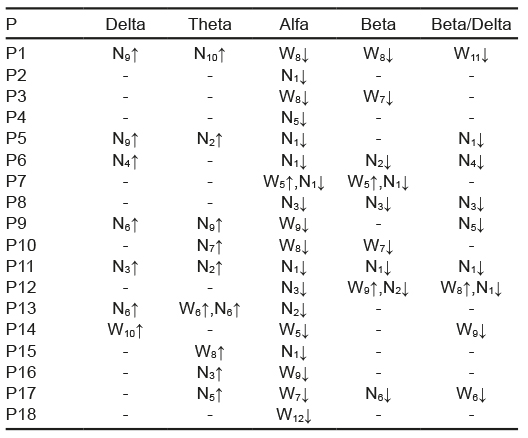
From the total of participants, 61% showed changes in the root mean square: 44% in the HR, 22% in the median frequency, and 22% in the RSA. In these variables, no trend was detected in the increases or decreases in the 24 segments analyzed. Of the EEG activity, in the alpha band, 94% of the participants experienced changes in the left occipital derivation (Table 4) and 100% in the right occipital derivation (Table 5). For the rest of the bands of the right occipital derivation, 50% of the participants showed changes in beta, 39% in delta, 50% in theta, and 72% in the beta/delta index. Conversely, in the left occipital derivation, 61% experienced changes in beta, 39% in delta, 50% in theta, and 56% in the beta/delta index.
Table 4 Changes per individual in EEG of left occipital derivation

Note: P = participant; W = Wakefulness the subscript indicates the segment in which the change was located; N = NREM sleep stage 1; the subscript indicates the segment in which the change was located; ↓ = change associated with decrease; ↑ = change associated with increase.
Table 5 Changes per individual in EEG of right occipital derivation
Note: P = participant; W = Wakefulness, the subscript indicates the segment in which the change was located; N = NREM sleep stage 1; the subscript indicates the segment in which the change was located; ↓ = change associated with decrease; ↑ = change associated with increase.
After considering the first change detected in the electrophysiological variables analyzed, a total of 20 were counted, since in some participants two different variables were observed at the same time. On 14 occasions, the first change occurred in EEG activity, where the decreases in the alpha and beta/delta indexes predominated. On three occasions, it occurred in the root mean square, two in the RSA and one in the HR. An evaluation of hemispheric differences in EEG activity showed that on six occasions, changes occurred first in the right region, on seven occasions in the left region, and on five occasions in both regions at the same time.
As for the distribution of each change in the segments evaluated, it was observed that in the N1 sleep segment, the greatest number of decreases were present in both occipital derivations, mainly in the alpha band followed by those in the beta/delta index. In general, decreases in the alpha, beta, and beta/delta activity of both derivations predominated during wakefulness and in the first sleep segments, whereas increases in the theta and delta bands predominated in the sleep segments. This was consistent with the pattern found with the group CPA.
DISCUSSION AND CONCLUSION
In this paper, repeated measures ANOVA was used so that we were able to compare our results with previous studies. With this method and the CPA group, no changes in muscle activity were detected during the wake-sleep transition. In fact, changes in muscular activity of the chin at the beginning of sleep are not well characterized (Ogilvie, 2001; Shinar, Akselrod, Dagan, & Baharav, 2006). Through the use of CPA by individual, we detected that over half the participants showed at least one change in the mean square and that the number of increases was similar to that of the decreases. This similarity may have caused values to be offset when considering the group average. In the median frequency, very few participants displayed any changes.
With respect to the HR and RSA, through group CPA, we only found a decrease in HR during wakefulness. Through individual analysis, we observed that the amount of changes detected per participant was low and distributed without creating a specific pattern. It has been proposed that changes in cardiac activity during wake-sleep transition involve longer transition periods (Carrington et al., 2003; Carrington et al., 2005; Zambotti et al., 2011) that include the presence of circadian factors (Burgess et al., 1999).
With repeated measures ANOVA, significant differences were found in all the EEG bands. Regarding the power value in each segment, an overall downward trend was observed in the power of alpha, beta, and beta/delta index together with increases in theta and delta, which tallies with previous results (Cervena et al., 2014; Lamarche & Ogilvie, 1997; Merica & Gaillard, 1992; Morikawa et al., 1997; Wright, Badia, & Wauquier, 1995). The results of the group CPA for each EEG band were consistent with those obtained with repeated measures ANOVA, in that they showed changes in the general trend of the activity in each EEG band. The contribution of the group CPA was to find the specific moments in which the changes occurred when they had a similar alpha, beta, and beta/delta index, in addition to establishing that there were first decreases in the potency of the alpha, beta, and beta/delta index, and subsequently increases in theta and delta power. It has been reported that delta activity changes during wakefulness (Morikawa et al., 1997), although in this study the period prior to sleep-onset was five minutes.
CPA by individual is a different proposal from that of studies that use group averages to analyze EEG activity during sleep-wake transition (Merica & Fortune, 2004). When using this approach, it was found that only the alpha band changed in all participants, with most of the changes being located before the second sleep segment. This is consistent with the R & K sleep-onset criterion (Rechtschaffen & Kales, 1968), which focuses on the substitution of alpha activity for mixed frequency activity with low voltage waves. Although this method has its limitations, as it fails to consider the microstructure of the wake-sleep transition (Ogilvie, 2001), we decided to use it to compare our results with previous studies (Table 1). Moreover, it continues to be a standard method for defining sleep-onset, with even the most recent AASM method maintaining the same definition (Iber, Ancoli-Israel, Chesson, & Quan, 2007; Silber et al., 2007). However, further studies with CPA could provide more accurate data on sleep-onset if combined with other methods that consider this microstructure such as the Hori method (Tamaki, Nittono, Hayashi, & Hori, 2005).
The most consistent result with both group and individual CPA was the change in the alpha band. It has been suggested that the mechanisms that generate this activity involve the occipital and parietal cortex (Omata, Hanakawa, Morimoto, & Honda, 2013; Steriade & Paré, 2007), as well as the thalamus (Hughes et al., 2004). In the lateral geniculate body (LGB) of the thalamus, it has been found that the same group of neurons generate alpha and theta depending on the level of depolarization (greater depolarization is associated with faster frequencies) (Hughes & Crunelli, 2005).
With the individual CPA, we found that all participants showed changes in the level of alpha activity and only half in theta activity. Since a change in alpha level may be due to the change in the generating source (Bazanova & Vernon, 2014), the group of CGL neurons may partially contribute to the change of alpha to theta activity during the transition period evaluated. It may also be that a significant change in the theta activity level requires more time and since the cumulative sums method considers the whole series for the calculation of changes (Hawkins & Qiu, 2003), the selection of only one minute of sleep could influence the failure to detect changes in this activity.
In several participants, the detection of changes between alpha and beta coincided or was close in time. These results may have occurred as a result of the use of the FFT, since the harmonics of the alpha activity may have combined with the beta activity (Pfurtscheller, Stancák, & Edlinger, 1997). However, the evaluation of phase coupling has shown the presence of phase synchronization between alpha and beta with a maximum in occipital regions (Nikulin & Brismar, 2006). Confirming this relationship therefore requires studies that consider evaluating the phase synchronization between alpha and beta during the wake-sleep transition.
When the left and right occipital derivations were compared, some differences were observed in the changes found by each band. In the literature, differences between hemispheres in the wake-sleep transition have been described in the use of other methodologies (Marzano et al., 2013). CPA made it possible to determine the first change detected in the power of the EEG; this information could be useful in studies focused on the analysis of brain regions that change first in this transition.
Lastly, the use of CPA detected a lack of synchronization between all the physiological variables studied, since it failed to identify a moment when they all changed at the same time, which tallies with the model proposed by Ogilvie (2001).
We therefore consider that CPA provided additional information to repeated measures ANOVA in the evaluation of the wake-sleep transition. In order to be able to systematize its use, it is necessary to conduct studies with a larger sample size and longer transition, which include the presence of sleep spindles, and more EEG derivations. It should also be used with transitions between sleep stages.

