


 texto en
  Inglés (pdf)
 Artículo en XML
 Referencias del artículo
 Enviar artículo por email
 Citado por SciELO
  Similares en
SciELO
Similares en
SciELO 
 Permalink
Mexico produces one of the highest quality and most demanded coffee varieties worldwide. It produces around 944 thousand tons of coffee grains each year. The states with the highest production are Chiapas, with 40.8% of the national production, Veracruz with 24.4% and Puebla with 15.5%. Together, these three states produce more than 70% of the national total (SIAP, 2021). The State of Mexico currently has approximately 549 hectares planted with coffee, from which 622 tons of coffee are obtained each year. These plantations are distributed over several municipalities, the most important of which are Amatepec (338.2 hectares and 333.2 tons), Sultepec and Temascaltepec (SIAP, 2020).
Despite their importance, coffee crops in Mexico face various phytosanitary problems (SENASICA, 2018). One of these is “ojo de gallo” (American Leaf Spot), caused by the fungus M. citricolor, a member of the Basidiomycetes group of fungi. The main effect of the disease is low production yield due to defoliation (Granados, 2020). The variety C. arabica and varieties derived from the Timor Hybrid (TH) have different degrees of susceptibility to the attack of “ojo de gallo”. For example, the Catuaí and Villa Sarchí varieties have greater tolerance to the disease than the varieties of the Catimor group (Santacreo 2001; Avelino et al., 1995).
Rooster’s eye is a very important disease in plantations located over 700 meters above sea level, with shade >46%, ambient humidity >80% and cool temperatures between 19 and 23 °C (CENICAFE, 2011). Studies carried out in El Salvador, Costa Rica and Guatemala have shown that the development of the disease depends on the seasonal fluctuations of rainfall and relative humidity. The incidence of the disease increases in rainy seasons, as does the number of diseased leaves and the number of lesions per leaf (from 1 to 75 lesions) (SENASICA, 2014).
In nature, organisms form aggregations or gradients in response to structural characteristics that depend on biotic and abiotic variables of their habitat. This should be kept in mind to better understand the population dynamics of different organisms and their relationship with the environment (Gomez et al., 2010).
The last important epidemic of rooster’s eye in coffee occurred in Costa Rica in 2010. It was associated with a 12% decrease (around 71,400,000 kg) in the estimated harvest production for the productive year 2010-2011, which meant a loss of around USD $60 million (Granados et al., 2020). In Mexico, some plantations have shown an incidence of 30%. In the State of Mexico, this disease is monitored by the Phytosanitary Epidemiological Monitoring Program (SENASICA, 2017).
Geostatistics is a set of tools and techniques used to analyze and predict values of a variable that is distributed over space or time in a continuous way. It can be used to study phytosanitary problems. All geostatistical work has three stages; 1. Exploratory data analysis during which sample data are studied without considering their geographical distribution. 2. Structural analysis or study of the spatial continuity of the variables. 3. Predictions or estimates of the variables in non-sample points (Moral, 2004). The present study aimed to collect data of the spatial distribution and population density of M. citricolor in coffee crops in the State of Mexico to understand the epidemiological process of the disease.
The research was carried out in the municipality of Amatepec, located in the extreme south of the western part of the State of Mexico. Six plots of Arabica coffee (Typica and Caturra) were selected, with an age of 10 to 20 years and an average area of 5000 m2. The shade percentage of the plots ranged between 40 and 60%. The main management activities carried out in each plot were formation pruning, shade regulation and phytosanitary pruning. For the sampling, the plots were delimited and divided into 10x10m quadrants, making a total of 50 quadrants per plot. Four trees were randomly selected from each quadrant, for a total of 200 trees. Each plant was marked and georeferenced using a differential global positioning system (Trimble SPS361) to locate and sample the same plants during the study. In each plant, samplings were performed by stratum (lower, middle and upper), taking four branches from each of them (one for each cardinal point). Three random leaves from each branch were evaluated. The incidence of rooster’s eye was determined based on the number of leaves that presented symptoms of the disease, compared to the total number of leaves on each branch. The evaluations were carried out every 14 days from September 2020 to February 2021.
The kurtosis and the coefficient of variation of the obtained data were evaluated to verify their normality. Once the database was integrated, a geostatistical analysis was carried out. It began by obtaining the experimental semivariogram of the incidence of the disease found during the study. The experimental semivariograms, which were computed using the Variowin 2.2 software (Springer Verlag, NY) (Maldonado et al., 2017), were adjusted to spherical, Gaussian, exponential, pure nugget effect, logarithmic, monomic and hole-effect theoretical models. The plateau, range and nugget effect parameters of these models were modified manually to mathematically validate the adjusted models using validation statistics such as Mean Estimation Errors (MEE), Mean Square Error (ECM) and Dimensionless Mean Square Error (MCE) (Rivera-Martínez et al., 2017).
The experimental values of the semivariograms were calculated using the following expression (Journel and Huijbregts 1978; Isaaks and Srivastava 1989):
Where: γ*(h) is the experimental value of the semivariogram for the distance interval h; N(h) is the number of pairs of sampled points separated by the distance interval h; z(x i ) is the value of the variable of interest at the sample point x i ; z (x i +h) is the value of the variable of interest at the sample point x i +h.
The maps were elaborated by interpolating values through ordinary Kriging, an interpolation technique that allows for the unbiased estimation of non-sampled points. Density maps were then prepared with the Surfer 16.0 software (Surface Mapping System). This software was also used to determine the infected surface in the maps to establish where the disease was actually present within the study plots (Rivera-Martínez et al., 2017). The incidence of rooster’s eye was associated with climatic conditions such as temperature, relative humidity and dew point, which were determined using a climatic sensor and data logger HOBO ProV2.
Seventy-two semivariograms were calculated in the present study. They showed that the disease rooster’s eye had an aggregated spatial distribution that fitted Gaussian and spherical models in most plots, except for plots 1 and 3, for which the semivariograms of February and November fitted an exponential model (Table 1). Martinez et al. (2021) described spherical models, which indicate that the populations are present in greater quantity in certain areas of the plot compared to the rest of the sampled points, and that the aggregation centers are random. A Gaussian model indicates that the aggregation behavior occurs continuously within the plots, which means that the fungus disperses to nearby individuals and not to those that are further away. The adjusted parameters that allowed validating the models were the range, which is the degree of correlation between the sampled data; starts at 11,517 ending at 19.84 for the 6 plots. In all models, the nugget effect was equal to zero, which according to Twizeyimana et al. (2008) indicates a high level of aggregation of the incidence of the disease, and also that the sample size used in the study was sufficient and the sampling error minimal. In all the samples, there was a high spatial dependence between the data, which reflects that the data were associated with each other in a highly significant way (Rossi et al., 1992). The data obtained showed that the aggregation of the incidence of rooster’s eye is strongly stable (Maldonado et al., 2017).
Table 1 Parameters of the semivariogram of the incidence per plot of Mycena citricolor between September 2020 and February 2021 in the municipality of Amatepec, State of Mexico.
| Muestreo | Media | Varianza | Modelo | Pepita | Meseta | Rango | Pepita / Meseta | Dependencia Espacial |
|---|---|---|---|---|---|---|---|---|
| Parcela 1 | ||||||||
| Sep-1 Z | 4.1 | 15.33 | Gaussiano | 0 | 12.64 | 11.52 | 0 | Alta |
| sep-02 | 4.22 | 14.41 | Esférico | 0 | 10.95 | 17.92 | 0 | Alta |
| oct-01 | 4.38 | 14.17 | Gaussiano | 0 | 11.99 | 11.52 | 0 | Alta |
| oct-02 | 4.19 | 12.97 | Gaussiano | 0 | 10.66 | 10.88 | 0 | Alta |
| nov-01 | 4.08 | 13.59 | Gaussiano | 0 | 11.06 | 15.36 | 0 | Alta |
| nov-02 | 4.06 | 12.19 | Esférico | 0 | 11.05 | 14.08 | 0 | Alta |
| dic-01 | 3.77 | 11.1 | Esférico | 0 | 9.12 | 17.28 | 0 | Alta |
| dic-02 | 3.68 | 10.12 | Esférico | 0 | 8.47 | 16.64 | 0 | Alta |
| ene-01 | 3.54 | 9.88 | Esférico | 0 | 9.2 | 19.84 | 0 | Alta |
| ene-02 | 3.83 | 9.09 | Gaussiano | 0 | 8.46 | 12.8 | 0 | Alta |
| feb-01 | 3.63 | 8.7 | Exponencial | 0 | 8.44 | 9.6 | 0 | Alta |
| feb-02 | 3.48 | 7.38 | Gaussiano | 0 | 7.1 | 13.44 | 0 | Alta |
| Parcela 2 | ||||||||
| sep-01 | 8.45 | 34.69 | Esférico | 0 | 27.99 | 16.64 | 0 | Alta |
| sep-02 | 8.43 | 32.86 | Esférico | 0 | 27.39 | 16 | 0 | Alta |
| oct-01 | 8.8 | 30.07 | Esférico | 0 | 25.8 | 10.88 | 0 | Alta |
| oct-02 | 9.02 | 33.48 | Esférico | 0 | 27.54 | 16 | 0 | Alta |
| nov-01 | 8.56 | 29.43 | Esférico | 0 | 23.51 | 18.07 | 0 | Alta |
| nov-02 | 8.37 | 27.97 | Esférico | 0 | 23.54 | 15.36 | 0 | Alta |
| dic-01 | 8.02 | 23.75 | Esférico | 0 | 20.16 | 14.72 | 0 | Alta |
| dic-02 | 7.79 | 21.33 | Esférico | 0 | 17.6 | 17.28 | 0 | Alta |
| ene-01 | 7.48 | 17.64 | Esférico | 0 | 15.12 | 14.72 | 0 | Alta |
| ene-02 | 7.17 | 14.11 | Esférico | 0 | 11.85 | 17.28 | 0 | Alta |
| feb-01 | 6.95 | 11.61 | Esférico | 0 | 10.08 | 9.6 | 0 | Alta |
| feb-02 | 6.64 | 9.75 | Esférico | 0 | 8.53 | 16 | 0 | Alta |
| Parcela 3 | ||||||||
| sep-01 | 8.72 | 53.19 | Esférico | 0 | 45.29 | 17.92 | 0 | Alta |
| sep-02 | 8.97 | 51.49 | Esférico | 0 | 44.72 | 14.72 | 0 | Alta |
| oct-01 | 8.94 | 48.87 | Esférico | 0 | 43.61 | 14.72 | 0 | Alta |
| oct-02 | 8.83 | 46.09 | Gaussiano | 0 | 37.72 | 11.52 | 0 | Alta |
| nov-01 | 8.67 | 44.13 | Esférico | 0 | 36.96 | 15.36 | 0 | Alta |
| nov-02 | 8.42 | 40.1 | Exponencial | 0 | 38.4 | 10.88 | 0 | Alta |
| dic-01 | 8.24 | 36.9 | Esférico | 0 | 31.82 | 15.36 | 0 | Alta |
| dic-02 | 8.06 | 33.92 | Gaussiano | 0 | 29.92 | 10.88 | 0 | Alta |
| ene-01 | 7.61 | 29.68 | Esférico | 0 | 24.9 | 14.72 | 0 | Alta |
| ene-02 | 7.23 | 25.32 | Esférico | 0 | 21.84 | 9.6 | 0 | Alta |
| feb-01 | 6.89 | 21.69 | Esférico | 0 | 17.6 | 10.88 | 0 | Alta |
| feb-02 | 6.57 | 18.19 | Esférico | 0 | 14.63 | 10.24 | 0 | Alta |
| Parcela 4 | ||||||||
| sep-01 | 9.77 | 51.7 | Esférico | 0 | 44.72 | 16.38 | 0 | Alta |
| sep-02 | 9.55 | 45.65 | Esférico | 0 | 39.1 | 9.45 | 0 | Alta |
| oct-01 | 9.42 | 42.79 | Esférico | 0 | 37.41 | 15.75 | 0 | Alta |
| oct-02 | 9.27 | 39.47 | Esférico | 0 | 33.85 | 14.49 | 0 | Alta |
| nov-01 | 9.02 | 35.61 | Esférico | 0 | 30.6 | 10.71 | 0 | Alta |
| nov-02 | 8.78 | 31.5 | Esférico | 0 | 26.56 | 9.43 | 0 | Alta |
| dic-01 | 8.5 | 27.92 | Gaussiano | 0 | 24.08 | 8.19 | 0 | Alta |
| dic-02 | 8.37 | 26.02 | Gaussiano | 0 | 21.58 | 8.19 | 0 | Alta |
| ene-01 | 8.14 | 23.09 | Esférico | 0 | 20.15 | 9.45 | 0 | Alta |
| ene-02 | 8.02 | 21.26 | Esférico | 0 | 18.7 | 10.71 | 0 | Alta |
| feb-01 | 7.9 | 20.2 | Esférico | 0 | 17.43 | 10.08 | 0 | Alta |
| feb-02 | 7.63 | 17.76 | Esférico | 0 | 16.2 | 15.12 | 0 | Alta |
| Parcela 5 | ||||||||
| sep-01 | 10.95 | 48.13 | Esférico | 0 | 41.76 | 14.08 | 0 | Alta |
| sep-02 | 10.8 | 44.57 | Gaussiano | 0 | 39.15 | 10.88 | 0 | Alta |
| oct-01 | 10.54 | 40.93 | Esférico | 0 | 34.12 | 14.72 | 0 | Alta |
| oct-02 | 10.24 | 37.19 | Esférico | 0 | 33.44 | 10.24 | 0 | Alta |
| nov-01 | 10.05 | 34.04 | Esférico | 0 | 28.9 | 14.18 | 0 | Alta |
| nov-02 | 9.76 | 30.58 | Esférico | 0 | 25.04 | 14.72 | 0 | Alta |
| dic-01 | 9.35 | 27.25 | Esférico | 0 | 22.96 | 10.88 | 0 | Alta |
| dic-02 | 9.2 | 26.86 | Esférico | 0 | 22.68 | 8.96 | 0 | Alta |
| ene-01 | 8.96 | 23.86 | Esférico | 0 | 20.4 | 10.24 | 0 | Alta |
| ene-02 | 8.71 | 21.19 | Esférico | 0 | 18.26 | 9.6 | 0 | Alta |
| feb-01 | 8.33 | 18.021 | Esférico | 0 | 15.48 | 8.96 | 0 | Alta |
| feb-02 | 8.03 | 15.62 | Gaussiano | 0 | 13.44 | 10.88 | 0 | Alta |
| Parcela 6 | ||||||||
| sep-01 | 11.79 | 49.9 | Gaussiano | 0 | 41.11 | 10.88 | 0 | Alta |
| sep-02 | 11.39 | 45.1 | Gaussiano | 0 | 39.6 | 10.88 | 0 | Alta |
| oct-01 | 11.1 | 41.39 | Gaussiano | 0 | 34.44 | 10.88 | 0 | Alta |
| oct-02 | 10.95 | 38.59 | Gaussiano | 0 | 33.54 | 10.88 | 0 | Alta |
| nov-01 | 10.62 | 35.29 | Esférico | 0 | 31.65 | 14.09 | 0 | Alta |
| nov-02 | 10.68 | 34.09 | Esférico | 0 | 28.22 | 14.72 | 0 | Alta |
| dic-01 | 10.44 | 31.58 | Esférico | 0 | 28.16 | 13.44 | 0 | Alta |
| dic-02 | 10.04 | 27.67 | Esférico | 0 | 24.36 | 14.72 | 0 | Alta |
| ene-01 | 9.57 | 23.55 | Esférico | 0 | 21.36 | 10.88 | 0 | Alta |
| ene-02 | 9.28 | 20.72 | Esférico | 0 | 19.32 | 13.78 | 0 | Alta |
| feb-01 | 9.01 | 18.33 | Esférico | 0 | 17.1 | 14.08 | 0 | Alta |
| feb-02 | 8.8 | 17.51 | Esférico | 0 | 16.38 | 14.08 | 0 | Alta |
Z1) First sampling, 2) Second sampling
In the present study, maps were generated through ordinary kriging to estimate the percentages of infected surface and the values associated with non-sampled points. The 72 maps of the infected surface show the presence of M. citricolor in different coffee plots of the municipality of Amatepec (Figure 1). They show that the rooster’s eye disease was distributed in central aggregation points, which were constant in all the samplings, indicating that the disease was latently but persistently present in the plots, awaiting the appropriate environmental conditions to spread. In the months of September, October, November and December, the points of aggregation of eye of the rooster were more pronounced but decreased from the month of January. This is due to the decrease of humidity and dew point temperature in the plots during these months (Figure 2). Cardenas et al. (2017) pointed out that the semivariograms and the maps generated through Kriging allow to identify foci of infection. They suggest that Geostatistics can explain the spatial arrangement of crop diseases and thus help develop accurate and comprehensive management strategies.
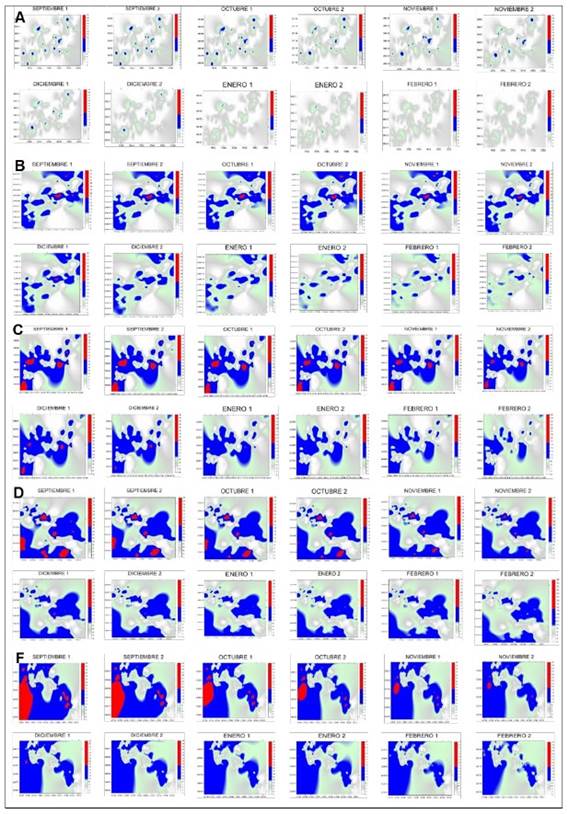
Figure 1 Maps of rooster’s eye infection in coffee plantations in the municipality of Amatepec, State of Mexico. (A) plot 1, (B) plot 2, (C) plot 3, (D) plot 4, (E) plot 5 and (F) plot 6.
A key element of precision agriculture is the determination of the areas in need of management. For this, it is important to know which areas are infected and the percentage they represent of the total surface (Ramírez and Porcayo, 2009). In the present study, the percentage of infection for the six plots (Table 2) ranged between 64% and 85%. The months from September to December showed higher incidence of infection due to the change in climatic conditions (Figure 2) such as temperature, which averages 20 ºC during these months. Campos (2010) mentioned that rooster’s eye thrives under relatively cool temperature conditions between 17 and 22 °C, compared to the temperatures required by other fungi that attack coffee plants. Relative humidity was 88% in September, 91% in October, 70% in November and 55% in December, with dew point temperatures of 10.9, 18.6 and 13.9 °C. Granados (2015) mentioned that the development of the epidemic depends on the seasonal fluctuation of rainfall and relative humidity. It is particularly favored by humidity values above 80%. For this reason, the months of September and October have a greater incidence of the disease. Once the rains start, the number of diseased leaves and the number of lesions increase rapidly. The incidence of the disease does not decrease in January and February because the temperature and the dew point remain within suitable ranges. It is worth remembering that a strong dew allows the disease to continue its development, even in a dry period (Waller et al., 2007). The percentage of shade is another of the important parameters since no pruning is carried out in some plots. Rivillas and Castro (2011) mention that coffee cultivation must have a rational distribution of shade, so that it does not affect the availability of light for coffee plants or intercept solar radiation. Shade should not affect the photosynthetic processes of the plant or increase the humidity of the crop. But shade modifies the microclimate and increases the number of ecological niches in coffee plantations, which favors the establishment and development of the rooster’s eye disease. By reducing the speed of the wind, shading elements can lead to an increase in the relative humidity of the air. The fact that some shading plants are alternate hosts of the pathogen (Granados, 2015) could explain why the infection surface was larger in some of the plots (4, 5 and 6) evaluated in the present study. Another factor that can help explain the incidence of the disease is the altitude (geographical factor) of the municipality under study, which is 1800 meters above sea level. According to Condori (2021), there is a direct relationship between altitude and incidence of this disease, that is, the incidence is higher in high areas and lower in low areas. Finally, the cultivation of different coffee varieties is an important factor in the incidence of the disease, since some varieties are more vulnerable to attack by rooster’s eye (Santacreo, 2001).
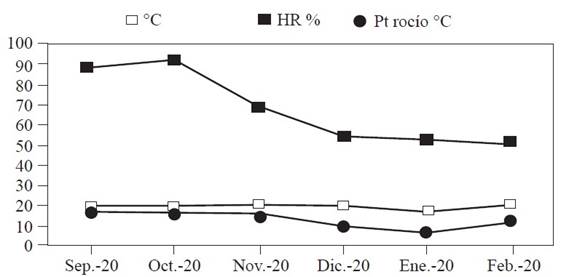
Figure 2 Climatic conditions (Temperature °C, Relative Humidity RH % and Dew Point Dew Point °C) during the evaluation months, from September 2020 to February 2021 in the municipality of Amatepec, State of Mexico.
Table 2 Surface infected with Mycena citricolor from September 2020 to February 2021 in the the municipality of Amatepec, State of Mexico.
| A) | B) | C) | ||||||||
|---|---|---|---|---|---|---|---|---|---|---|
| Muestreo | Superficie infectada % | Superficie no infectada % | Muestreo | Superficie infectada % | Superficie no infectada % | Muestreo | Superficie infectada % | Superficie no infectada % | ||
| sep-01 | 68 | 32 | sep-01 | 74 | 26 | sep-01 | 76 | 24 | ||
| sep-02 | 69 | 31 | sep-02 | 75 | 25 | sep-02 | 77 | 23 | ||
| oct-01 | 70 | 30 | oct-01 | 75 | 25 | oct-01 | 77 | 23 | ||
| oct-02 | 70 | 30 | oct-02 | 75 | 25 | oct-02 | 77 | 23 | ||
| nov-01 | 71 | 29 | nov-01 | 76 | 24 | nov-01 | 78 | 22 | ||
| nov-02 | 72 | 28 | nov-02 | 76 | 24 | nov-02 | 78 | 22 | ||
| dic-01 | 67 | 33 | dic-01 | 75 | 25 | dic-01 | 78 | 22 | ||
| dic-02 | 66 | 34 | dic-02 | 74 | 26 | dic-02 | 76 | 24 | ||
| ene-01 | 66 | 34 | ene-01 | 74 | 26 | ene-01 | 75 | 25 | ||
| ene-02 | 65 | 35 | ene-02 | 73 | 27 | ene-02 | 75 | 25 | ||
| feb-01 | 65 | 35 | feb-01 | 72 | 28 | feb-01 | 74 | 26 | ||
| feb-02 | 64 | 36 | feb-02 | 72 | 28 | feb-02 | 73 | 27 | ||
| D) | E) | F) | ||||||||
| Muestreo | Superficie infectada % | Superficie no infectada % | Muestreo | Superficie infectada % | Superficie no infectada % | Muestreo | Superficie infectada % | Superficie no infectada % | ||
| sep-01 | 77 | 23 | sep-01 | 84 | 16 | sep-01 | 75 | 25 | ||
| sep-02 | 77 | 23 | sep-02 | 84 | 16 | sep-02 | 76 | 24 | ||
| oct-01 | 77 | 23 | oct-01 | 84 | 16 | oct-01 | 76 | 24 | ||
| oct-02 | 78 | 22 | oct-02 | 85 | 15 | oct-02 | 76 | 24 | ||
| nov-01 | 78 | 22 | nov-01 | 85 | 15 | nov-01 | 76 | 24 | ||
| nov-02 | 78 | 21 | nov-02 | 85 | 15 | nov-02 | 77 | 23 | ||
| dic-01 | 77 | 23 | dic-01 | 83 | 17 | dic-01 | 75 | 25 | ||
| dic-02 | 77 | 23 | dic-02 | 83 | 17 | dic-02 | 74 | 26 | ||
| ene-01 | 75 | 25 | ene-01 | 82 | 18 | ene-01 | 74 | 26 | ||
| ene-02 | 75 | 25 | ene-02 | 82 | 18 | ene-02 | 74 | 26 | ||
| feb-01 | 75 | 25 | feb-01 | 81 | 19 | feb-01 | 73 | 27 | ||
| feb-02 | 74 | 26 | feb-02 | 80 | 20 | feb-02 | 72 | 28 | ||
In conclusion, the rooster’s eye disease in coffee (C. arabica) showed a spatial distribution that fitted Gaussian and spherical models. This explains the spatial behavior of M. citricolor, which was distributed in aggregates, with some specific aggregation points that did not change in the months sampled, even though they partially decreased due to the changes in climatic conditions. Geostatistics has proven to be one of most effective methods to analyze the spatial distribution of crop diseases, which in turn facilitates making appropriate, pertinent and timely decisions on integrated management.

