


Services on Demand
Journal
Article
 text in
  English (pdf)
 Article in xml format
 Article references
 Send this article by e-mail
Indicators
-
 Cited by SciELO
 -
 Access statistics
Related links
-
 Similars in
SciELO
Similars in
SciELO
Share

 Permalink
Revista mexicana de fitopatología
On-line version ISSN 2007-8080Print version ISSN 0185-3309
Rev. mex. fitopatol vol.38 n.1 Texcoco Jan. 2020 Epub Nov 27, 2020
https://doi.org/10.18781/r.mex.fit.1910-5
Scientific Articles
Pathosystem Solanum lycopersicum-Phytophthora infestans in Chapingo, Mexico. Expected, observed and simulated
1 Departamento de Fitotecnia, Universidad Autónoma Chapingo, Km 38.5 Carretera México-Texcoco, Chapingo, Estado de México, C.P. 56230, México;
2 Probiodiversidad AC, Manuel Gonzalez 219A, Texcoco, Estado de México, C.P. 56116, México.
Phytophthora infestans is affected by biotic and abiotic factors that can vary its pathogenicity. In the highlands of Mexico, the genetic variability of P. infestans, low temperatures, high relative humidity and light favor its expression and influence the efficacy of the infection. This work analyzed the progress of infection of P. infestans with respect to the expected, observed and simulated during two field cycles in Chapingo, Mexico, with the objective of documenting and quantifying the progress of foliar infection by P. infestans in different lines of Tomato with different levels of resistance. As well as validate a predictive model. With the record of 10 years of meteorological data, five situations were predicted with four to ten cycles of infection from 8 to 13 h each. Compared to the predictions, the observed effect of area under the disease progress curve (AUDPC) and its components (RAUDPC and RaRAUDPC) were significant, with low coefficient of variation. It is concluded that among the expected, observed and simulated scenarios there is a close relationship to predict epidemics of P. infestans. This confirms that LATEBLIGHT is useful for simulating and predicting the late blight epidemic, under Chapingo atmospheric conditions.
Key words: Resistance; Susceptibility; Lateblight; Scenario of infection
Phytophthora infestans es afectado por factores bióticos y abióticos que pueden hacer variar su patogenicidad. En tierras altas de México, la variabilidad genética de P. infestans, bajas temperaturas, alta humedad relativa y luz favorecen su expresión e influyen en la eficacia de la infección. Este trabajo analizó el progreso de infección de P. infestans respecto a lo esperado, observado y simulado durante dos ciclos de campo en Chapingo, México, con el objetivo de documentar y cuantificar el progreso de la infección foliar por P. infestans en diferentes líneas de jitomate con diferentes niveles de resistencia. Así como validar un modelo predictivo. Con el registro de 10 años de datos meteorológicos, se predijeron cinco situaciones con cuatro a diez ciclos de infección de 8 a 13 h cada uno. En comparación con las predicciones, el efecto observado de área bajo la curva de progreso de la enfermedad (AUDPC) y sus componentes (RAUDPC y RaRAUDPC) fueron significativos, con bajo coeficiente de variación. Se concluye que entre los escenarios esperados, observados y simulados existe una estrecha relación para predecir epidemias de P. infestans. Esto confirma que LATEBLIGHT es útil para simular y predecir la epidemia de tizón tardío, en condiciones atmosféricas de Chapingo.
Palabras clave: susceptibilidad; resistencia; tizón tardío; escenarios de infección
The amount and quality of production in tomato crops has diminished due to diseases, causing extremely costly losses (Johnson et al., 2015; Collinge et al., 2010; Saville et al., 2015; Childers et al., 2015). The pathogen-host interaction is affected by biotic and abiotic factors. The former include resistance, heterogeneity and demography of the host, as well as density, frequency, and the genetic relation between genotypes of the coexisting pathogen (Zhan and McDonald, 2013). The main pathogen of the tomato is Phytophthora infestans and diverse factors can increase its pathogenicity (Dudler, 2013; Schornack et al., 2013; Berdúo-Sandoval et al., 2019). The migration of its two mating types (A1 and A2) lead to its sexual reproduction, increasing its genetic variability (Skelsey et al., 2009). In the highlands of Mexico, the genetic variability of P. infestans, low temperatures (10-15 °C) and high relative humidity (> 90% 10 h día-1) are favorable for its pathogenic expression (Díaz et al., 2014). The dispersal pattern of the pathogen also depends on the location of the field, spatial distribution, duration of the survival of spores (Skelsey et al., 2010), and solar radiation (Skelsey et al., 2009). The release of sporangia is broadly and directly related to low levels of solar radiation, temperature and a high relative humidity (Díaz et al., 2014).
Temperature and relative humidity have a significant impact on the development of late blight. Differential effects such as rainfall, wind, relative humidity, temperature and light can influence the efficiency of sporangia to trigger the infection (Ojiambo et al., 2015), and are therefore important for the epidemiology and the management of the disease (Danies et al., 2013). Under favorable weather conditions for the pathogen, the tomato crop can be destroyed in a matter of days (Hu et al., 2012) and when conditions are unfavorable, its incidence and/or severity can be reduced (Bostock et al., 2014). Predicting the disease requires a solid comprehension of the relation between weather data and the development of the disease (Yuen and Mila, 2015). “LATEBLIGHT” is a predictive model that evaluates polycyclic leaf diseases and predicts the level of genetic resistance (Forbes et al., 2008; Yuen and Forbes, 2009). Studies do not define the moment and amount of initial infection for several reasons, including the time limitations related to the beginning of the epidemic after transplanting (Andrade-Piedra et al., 2005a; Díaz et al., 2014). The Area Under the Disease Progress Curve (AUDPC) helps quantify the genetic resistance to P. infestans under field conditions, by estimating the real area under the curve of the disease. The Relative AUDPC (RAUDPC) is used to compare the progress of the disease under different environmental conditions, or when comparing more than one growth season (Díaz et al., 2014)
Phytophthora infestans displays a wide range of genetic diversity in Chapingo, Mexico (Alarcón-Rodríguez et al., 2014). This region has a wide season of constant summer rains, which guarantees the natural infection of late blight. Under these conditions and evaluating the genetic resistance of various tomato lines, the present study was carried out with the aim of documenting the progress of the foliar infection caused by P. infestans in different lines of tomato with different levels of genetic resistance under three scenarios: (1) expected, based on the AUDPC derived from the historical means of variables; (2) direct observations in the field and (3) simulated, using the predictive mathematical model “LATEBLIGHT,” version LB2004.
Materials And Methods
Site of study. Chapingo is located at 2,250 m over sea level (19º 30’ latitude north and 98º 53’ longitude west), in the State of Mexico. Its weather is Cb (Wo) with an annual average temperature of 15.2 °C and an annual rainfall of 635.5 mm (García, 1987). Planting seasons in this region depend on rainfalls and last from mid-June to mid-October.
Tomato/blight pathosystem. The P. infestans-tomato pathosystem was studied under the weather conditions in Chapingo, State of Mexico during two planting cycles (2017 and 2018) in a period of five weeks, which ran between the months of August and September, using three scenarios: (1) expected, (2) observed and (3) simulated. In the experiment, we used a control (Rio grande) and six tomato lines (L-03, L-51, L-72, L-92, L-43, L-77). The expected scenario consisted in obtaining the amount of possible P. infestans infection cycles that could exist during the planting cycle. This is obtained from analyzing the association of weather variables with factors that influence the progress of P. infestans (Díaz et al., 2014). The observed scenario is the progress of the real infection of P. infestans during a particular plantation cycle. This consists of the evaluation of readings of the infection of the foliage using the Henfling scale to obtain the AUDPC (Henfling, 1987). The simulated scenario consists of the prediction of the AUDPC using the “LATEBLIGH” algorithm, which is executed with the supply of data on weather parameters, resistance of the host and epidemiological variables (Díaz et al., 2014; Andrade-Piedra et al., 2005b; Andrade-Piedra et al., 2005c).
Agronomic crop management. In 2017, seeds were planted on May 23 and transplanted on June 21. On both dates, seeds were planted in styrofoam trays with 200 holes. The transplants for both dates were carried out in experimental units composed of three furrows, with an area of 12 m2 in each experimental unit. The experiment was located in lot X-2 of the Xaltepa experimental field of the Autonomous University Chapingo. The auxiliary irrigations were performed using a drip tape (caliber eight thousand, with drippers every 20 cm and a flow of 1.02 L h-1 per emitter) when required by the crop; granulated N, P, K fertilizer was applied (46-00-00; 18-46-00; 00-00-60). Foliar fertilizer of microelements was applied (Tradecorp AZ). For pest control, we applied flonicamid and cypermethrin.Weed control was performed by hand. Depending on the phenological stage of the crop, the plant was provided support with nylon raffias.
Expected scenario. Six weather variables (Table 1) on the development of late blight were analyzed by multiple linear regression (SAS, 2002). The selection of the best model, with a minimum independence variability, was based on the criterion of the highest determination coefficient. The weather data were related with conditions that can impact the survival, permanence and dissemination of P. infestans (Andrade-Piedra et al., 2005c; Iglesias et al., 2010; Johnson et al., 2009; Morales et al., 2011; Nowicki et al., 2012; Skelsey et al., 2009; Skelsey et al., 2010). Temperature (T), relative humidity (RH) and solar radiation (SR) were chosen to determine the expected scenarios, considering their greatest contribution to the development of the disease.
Observed scenario. Six tomato lines were evaluated, along with a control and two levels of susceptibility (S = susceptible, R = resistant, C= control); L-03 (S), L-51 (S), L-72 (S), L-92(S), L-43 (R), L-77(R), and Rio grande (C) (Leyva et al., 2013). During the planting cycle, the plants were fertilized and the pest and weed controls were carried out. They were evaluated in the field with a complete random block experimental design with four repetitions (5 m in length, 0.80 m between furrows and 0.40 m between plants). The weekly readings of foliar infection were evaluated with the Henfling scale (Henfling, 1987) for a five-week period between August and September, 2017 and 2018, once the pathogen appeared naturally. Based on the initial symptoms after transplanting, the AUDPC was calculated progressively (Shaner and Finney, 1977). The values derived from AUDPC were used to calculate the RAUDPC (Fry, 1978; Bonierbale et al., 2010). Finally, the RAUDPC values were used to calculate the RaRAUDPC, using line 92 as the reference, which was possible during the experiment, following the procedure described by Yuen and Forbes (2009) and Taipe et al. (2011).
Table 1. Maximum and minimum limit values of the intervals of the weather variables registered between June 1 and September 30, 2007 to 2016 in Chapingo, Mexico.
| Variable | Abreviación | Unidad | 80%≤HR≤90% Rango | HR>90% Rango |
|---|---|---|---|---|
| Temperatura | T | °C | 12.7-17.6 | 12.7-16.3 |
| Punto de roció | PR | 12.1-16.7 | 12.3-16 | |
| Precipitación | PP | mm | 0-47.1 | 2.8-21.4 |
| Velocidad del viento | VV | ms-1 | 0-1 | 0-1.5 |
| Velocidad máxima del viento | VMV | ms-1 | 0-1 | 0-6.3 |
| Radiación solar acumulada | RS | W m2 | 3018y | 1701z |
y acumulado durante 23.5 h, de 00:00 a 23:30, 3,606 W m-2 ≈ 12.982 MJ m-2
z acumulado durante 3 h, de 06:00 a 09:00, 1,025 W m-2 ≈ 3.69 MJ m-2
Simulated scenario. An algorithm named LATEBLIGH was produced using “SAS forWindows 9.0” (SAS, 2002) considering the weather parameters and the level of the host resistant of the host within 2.4 m2 of tomato plants, based on forms reported by Díaz et al. (2014).
Results And Discussion
Expected scenarios. When selecting the multiple regression model for the execution of the expected scenarios, temperature (T), relative humidity (RH) and solar radiation (SR) were found to be independent variables that presented the highest coefficient of determination (R2 = 0.44). These variables are related to the presence, dissemination and effectiveness of P. infestans. Weather variables were recorded for a 10-year period (2007-2016) and averaged out in the tendency graph. Table 1 shows the minimum and maximum average records for weather variables derived from the application of two selection criterion for RH (80% ≤RH≤90% and RH> 90%). The upper limit of the average T, RH and SR records under the criterion of the 80% ≤RH≤90% was used to explain both the variability and the effect of these variables on the development of late blight. This comparison was made using the weather parameters for the expected scenarios with RH for 23.5 h and T 15.9 °C favoring the presence, dissemination and effectiveness of P. infestans, in comparison with the upper levels of the mean (Andrade-Piedra, et al., 2005c; Iglesias et al., 2010). Based on the conditions obtained through T, RH and SR as the best multiple linear model, highest peak fluctuation and selection criterion 80% ≤RH≤90%, five expected scenarios were identified, with ranges of four to ten infection cycles of variable lengths ranging from 6 to 12 h by night, dawn and sunrise (19:00 to 08:00). Figure 1 shows the infection cycles of the expected scenarios (I to V). The tendency curves (high and low peaks) are joined for the three variables (T, RH and SR). Both the beginning and the end of each cycle are determined by the reduction of the RH and the increase in T, based on daily intervals of 60 min. A cold and humid weather is required for the development of a greater amount of inoculant in a short timeframe (Kamoun and Smart, 2005). Darkness favors sporulation (Nowicki et al., 2012) and the expression of the pathogens in Chapingo (Díaz et al., 2014). The severity was favored with a T of 9.9 to 16.1 °C and an RH of 80.4 to 100% for 8 h in the tomato crop between June 18 and September 18 (Table 2). These conditions favor the beginning of an epidemic with temperatures at night below the condensation point for at least 4 h and a low temperature at night of 10 °C or below (Díaz et al., 2014; Morales et al., 2011; Nowicki et al., 2012). Significant differences (p <0.05) were observed between average registers for weather variables T and RH in the five expected scenarios analyzed.
Observed scenarios. In 2017 the genetic tolerance of Río grande and Line 77 was better than that of the tolerant Lines (Line 92 and Line 72), which were used as references in the initial progress of P. infestans, and in 2018, the expression of the tolerant line (Río grande) was greater to that of susceptible lines (Line 43, Line 51). In 2017, the infection observed in the field began on that same day, which led to the idea that both lines are susceptible to P. infestans under favorable conditions of RH and TR. Likewise, in 2018, the infection in lines 92 and Río grande began on the same day with a similar infection speed in comparison with 2017 according to the weather plan of conditions of that year (Figure 2). Weather conditions were favorable for the infection of leaves in susceptible lines. On days 90-91 after transplanting (ddt), plants of susceptible lines were infected by 73 % in 2017. A similar lag in the infection rates was also reported by Cadena-Hinojosa et al. (2007).
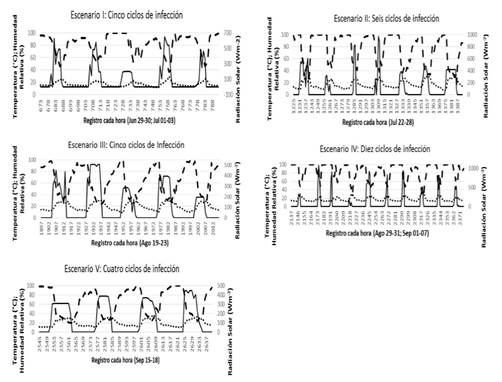
Figure 1 P. infestans infection cycles of five scenarios in tomato under the weather conditions in Chapingo, State of Mexico. (Temperature (°C), Relative humidity (%), Solar Radiation (Wm-2).)
Table 2. Expected scenarios and infection cycles by scenario for P. infestans in tomato under the weather conditions in Chapingo.
| Escenario | Ciclo de infección | Número de horasy | Días Julianos | Horario | Variables meteorológicas | |||
|---|---|---|---|---|---|---|---|---|
| H_hz | T | HR | RS | |||||
| I | 1 | 673-681 | 11-12 | 24:00-08:00 | 8 | 14.4-15.2 | 84.6-96 | 166.8 |
| 2 | 692-704 | 12-13 | 19:00-07:00 | 12 | 14.3-15.5 | 85.7-92.9 | 289.4 | |
| 3 | 716-727 | 13-14 | 19:00-06:00 | 11 | 13-14.5 | 98.4-100 | 83.7 | |
| 4 | 743-753 | 15-16 | 22:00-08:00 | 10 | 12.5-15.5 | 80.4-91.7 | 269 | |
| 5 | 766-777 | 16-17 | 21:00-08:00 | 11 | 14.1-15.6 | 90.8-94.8 | 16.6 | |
| Promedio | 10.4 | 13.6b-15.2a | 87.9a-95b | 165.1 | ||||
| II | 1 | 1244-1257 | 35-36 | 19:00-08:00 | 13 | 10.3-13.9 | 100-100 | 298.4 |
| 2 | 1268-1281 | 36-37 | 19:00-08:00 | 13 | 12.1-14.3 | 91.1-97.9 | 46.05 | |
| 3 | 1293-1306 | 37-38 | 20:00-09:00 | 13 | 12.1-14.4 | 91.3-99.5 | 264.65 | |
| 4 | 1318-1330 | 38-39 | 21:00-09:00 | 12 | 12-13.7 | 98.5-100 | 331.85 | |
| 5 | 1341-1352 | 39-40 | 20:00-07:00 | 11 | 12.7-15.2 | 82.2-97.2 | 219.95 | |
| 6 | 1365-1375 | 40-41 | 20:00-07:00 | 11 | 12-16.1 | 83.3-94.7 | 91.02 | |
| Promedio | 12 | 11.8b-14.6a | 91a-98.2ab | 190.04 | ||||
| III | 1 | 1897-1905 | 62-63 | 00:00-09:00 | 8 | 11.9-15.3 | 85.4-97.6 | 323.84 |
| 2 | 1916-1927 | 63-64 | 19:00-06:00 | 11 | 11.4-15.2 | 85-95.9 | 8.39 | |
| 3 | 1943-1951 | 64-65 | 22:00-06:00 | 8 | 8.9-14.2 | 80.1-99.1 | 166.28 | |
| 4 | 1967-1975 | 65-66 | 22:00-06:00 | 8 | 10.2-14.8 | 85.1-96.1 | 65.7 | |
| 5 | 1992-2000 | 66-67 | 23:00-06:00 | 8 | 10.3-13.7 | 85.2-99.7 | 97.02 | |
| Promedio | 8.6 | 10.5C-14.6a | 84.1a-97.6ab | 137.246 | ||||
| IV | 1 | 2137-2146 | 73 | 00:00-09:00 | 9 | 13-15.1 | 97.1-100 | 31.63 |
| 2 | 2157-2169 | 73-74 | 20:00-07:00 | 11 | 12.7-15.6 | 80.8-100 | 0 | |
| 3 | 2181-2191 | 74-75 | 20:00-06:00 | 10 | 12.5-13.3 | 99.6-100 | 60.76 | |
| 4 | 2204-2216 | 75-76 | 19:00-07:00 | 12 | 10.8-16.2 | 81.8-99.7 | 6.9 | |
| 5 | 2228-2241 | 76-77 | 19:00-08:00 | 13 | 12.2-16 | 89.5-99.4 | 575.75 | |
| 6 | 2254-2265 | 77-78 | 21:00-08:00 | 11 | 12.9-14.7 | 88.4-96.7 | 16.3 | |
| 7 | 2277-2290 | 78-79 | 20:00-09:00 | 13 | 12.9-14.5 | 99.1-100 | 134.21 | |
| 8 | 2301-2313 | 79-80 | 20:00-08:00 | 12 | 12.7-17 | 81.2-93.6 | 0 | |
| 9 | 2325-2337 | 80-81 | 20:00-08:00 | 12 | 12.8-15.9 | 87.3-100 | 0 | |
| 10 | 2349-2362 | 81-82 | 20:00-09:00 | 13 | 11.6-13.9 | 99.4-100 | 32.37 | |
| Promedio | 12.2 | 12.4b-15.2a | 90.4a-98.9a | 36.57 | ||||
| V | 1 | 2545-2551 | 90 | 00:00-06:00 | 6 | 9.9-14.9 | 81.1-98.3 | 66.48 |
| 2 | 2567-2576 | 90-91 | 22:00-07:00 | 9 | 10.9-13.9 | 82.7-93.1 | 45.02 | |
| 3 | 2589-2600 | 91-92 | 20:00-07:00 | 11 | 11.5-15.7 | 86.1-99.3 | 30.8 | |
| 4 | 2613-2625 | 92-93 | 20:00-08:00 | 12 | 10.3-17.4 | 85.2-100 | 441.03 | |
| Promedio | 10.5 | 10.6c-15.4a | 83.7a-97.6ab | 123.98 | ||||
* Averages with similar letters are not significantly different (Waller-Duncan t test for relation K, p <0.05).
y No. 0.5 h = number of 30-minute segments, accumulated between June 1 and September 18 (104 days) of each year.
z H_h hours accumulated for RH> 80%, highest and lowest temperatures T (°C), maximum and minimum relative humidity RH (% ), SR Solar radiation accumulated (Wm-2).
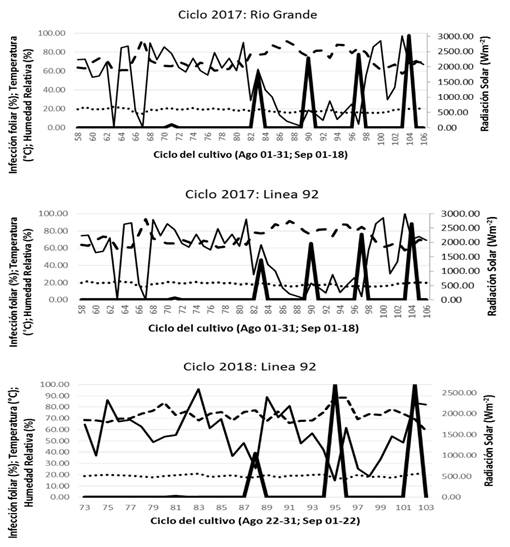
Figure 2. Progress of the infection by P. infestans on a line of susceptible tomato during two seasons (2017, 2018) and one tolerant line (2017) under the weather conditions in Chapingo. (Temperatura (°C), Relative humidity (%), Solar radiation (Wm-2), P. infestans).
The progress of the infection of Line 92 (plants dead 100-104 ddt displayed the presence of favorable weather conditions for the dissemination of the pathogen, with a temperature of 10.6-15.4 °C, RH of 83-98% for 12 h during the night, dawn and part of the morning (20:00 to 08.00 h) coinciding with the expected VI-4 scenario. However, in 2018, the infection began and progressed later (in approximately 79-81 ddt) in comparison to 2017, with 12-16.2 °C, 90-99% RH, which coincides with scenarios 6, 7, 8 (Table 3).
In 2018, plants present no infection at 95-96 ddt, 10-14.6 °C, and 100 % RH for 12 h in the nighttime, dawn and sunrise (20:00-08:00 h), making it similar to expected scenario IV-4. In general, during both planting cycles (2017 and 2018), the progress of the infection by P. infestans was favored by scenarios with T of 10-16.7 °C and an RH 80-100% for 8-13 h at night, dawn and part of the morning (19:00-08:00 h) (Andrade-Piedra, et al., 2005c; Iglesias et al., 2010). The average of 60-minute registers during the 102- to 104-day planting cycles in 2017 and 2018, displayed no significant differences between magnitudes of T (14.6 °C vs 15.4 °C) and RH (80% vs 83%). However, favorable conditions for the natural progression of the disease were observed and expected (based on the scenarios modelled). In 2017, the observed beginning of the infection coincided with scenarios I-2; in 2018, it coincided with scenarios II-3 and IV-5. In 2017, the point observed in which plants present no infection coincides with scenario IV-6, and in 2018, with scenario II-1 (Table 3).
The AUDPC, RAUDPC and RaRAUDPC were evaluated in a randomized experimental design with four blocks during 2017 and 2018. The results validated the proposed model, which was confirmed by the homogenous performance of the variance through an analysis of residues and the Shapiro-Wilk normality test, (SAS, 2002) (Tables 4 and 5).
Table 3. Progress of levels on infection by P. infestans in the observed and expected scenarios in Line 92 tomato, under the weather conditions observed in Chapingo, Mexico.
| Ciclo del cultivox | DAT_ty | Horario | Variables meteorológicasz | Infección (%) | Escenario Esperado | ||
|---|---|---|---|---|---|---|---|
| h | T | HR | |||||
| 2017 I | 70-71 | 19:00-07:00 | 12 | 9.8-17 | 84.4-100 | 3.1 | I-2 |
| 2017 M1 | 82-83 | 19:00-08:00 | 13 | 12.2-16 | 87.2-100 | 56.6 | IV-4, IV-5 |
| 2017 M2 | 89-90 | 19:00-08:00 | 13 | 11.8-16 | 83.8-99.2 | 73.8 | |
| 2017 M3 | 96-97 | 19:00-08:00 | 13 | 12.1-15 | 83.3-100 | 77.5 | |
| 2017 F | 103-104 | 21:00-08:00 | 11 | 11.5-16.7 | 83-99.3 | 97.5 | IV-6 |
| 2018 I | 80-81 | 19:00-08:00 | 13 | 12-16.2 | 82.8-98.7 | 0.9 | II-3, IV-5 |
| 2018 MI | 87-88 | 19:00-08:00 | 13 | 11.9-15.8 | 83-100 | 39.1 | II-2 |
| 2018 F | 94-95 | 19:00-08:00 | 13 | 10-14.6 | 98.9-100 | 100 | II-1 |
x I Early infection phase, M intermediate infection phase, F Final infection phase, 2017 I= 14 August 2017; 2017 M1= August 25 to 26; 2017 M2= September 1 to 2; 2017 M3= September 08-09; 2017 F= September 15 to 16; 2018 i= August 29 to 30; 2018 M= September 05 to 06; 2018 F= September 12 to 13.
y DAT_t1 = first evaluation when lesions caused by P. infestans were observed (number of days after emergence).
z H_h daily range of hours with RH≥80%, daily temperature range for T (°C), range of relative humidity for RH (%).
In 2017, the statistics of the tests produced the value of 0.45 for AUDPC, RAUDPC and RaRAUDPC with Pr <W 0.0001 and in 2018 the tree values were of 0.94. The Shapiro-Wilk normality validates the proposed model with a homogenous variance yield during both seasons. AUDPC, RAUDPC and RaRAUDPC were analyzed individually, although no differences were found between treatments with P <0.0001. During each planting cycle, the effect of the order of merit AUDPC, RAUDPC, and RaRAUDPC was greater in susceptible lines (line 92) in comparison with tolerant lines (Río grande). The t-test (LSD) and Tukey’s Honestly Significant Difference (HDS) Test for the variable AUDPC and its derivatives indicate that all possible comparisons between tolerant and susceptible lines were important in 2017.
RaRAUDPC was used to generate a susceptibility scale (1-8) for the degree of resistance or susceptibility of lines in two planting cycles (Yuen and Forbes, 2009). This scale system is practical and easy to use, since it allows the minimum difference between observed averages of 7.6 vs 7.7 in the 2017 and 2018 cycles, respectively. This value becomes the maximum value (≤ 8) for susceptible and intermediate lines and the minimum value (<1) for the resistant cultivar (Tables 4 and 5). The minimum value was not observed in the two planting cycles, due to their being no statistical differences in the RaRAUDPC of the lines due to their high AUDPC value.
Simulated scenario. The model “LATEBLIGHT” involved the use of specific procedures, including magnitudes of parameters and epidemiological variables (Table 6), weather parameters from the specific surroundings, and the estimation of the initial inoculant of the pathogen (Andrade-Piedra et al., 2005c). These procedures helped obtain observed and simulated AUDPC values, as well as to predict epidemics under natural infection conditions in Chapingo. In 2017, the model was used to obtain simulated and observed AUDPC values for each treatment(Figure 3). In addition, the model predicted the incidence of epidemics days before the natural infection in the field, which helps implement thorough control measures. Therefore, when predicting the outbreak, the model includes magnitudes of epidemiological variables and parameters (Table 6), as well as the weather parameters of T between 10.6 and 15.4 °C, RH between 80 and 100% for continuous periods of 9 to 13 h in the nighttime, dawn and morning.
Table 4. Mean values for AUDPC, RAUDPC, and RaRAUDPC in the tomato lines evaluated in the field, 2017 season in Chapingo, Mexico.
| Línea | AUDPC | Dev St | RAUDPC | Dev St | RaRAUDPC | Std. Dev. |
|---|---|---|---|---|---|---|
| Río grande (RG) | 1752.9a | 156.7 | 0.53a | 0.05 | 7.1a | 0.64 |
| Línea 3 | 1819.3a | 106.6 | 0.55a | 0.03 | 7.4a | 0.44 |
| Línea 51 | 1866.4a | 214.3 | 0.57a | 0.06 | 7.6a | 0.88 |
| Línea 72 | 1932.3a | 151.1 | 0.59a | 0.05 | 7.9a | 0.62 |
| Línea 92 | 1956.0a | 86.5 | 0.59a | 0.03 | 8.0a | 0.35 |
| Línea 43 | 1920.0a | 223.7 | 0.58a | 0.07 | 7.8a | 0.92 |
| Línea 77 | 1775.3 | 146.4 | 0.54a | 0.04 | 7.2a | 0.60 |
| Media | 1860.3 | 0.56 | 7.6 | |||
| DSM | 372.4 | 0.1 | 1.5 | |||
| CV | 8.7 | 8.7 | 8.7 | |||
| R2 | 0.2 | 0.2 | 0.2 | |||
* Averages with similar letters are not significantly different promedios con letras similares no son significativamente diferentes (Waller- Prueba t de relación K de Duncan, p <0,05) DMS diferencia significativa mínima.
Table 5. Mean values for AUDPC, RAUDPC, and RaRAUDPC of tomato lines evaluated in the field, season 2018 in Chapingo, Mexico.
| Línea | AUDPC | Dev St | RAUDPC | Dev St | RaRAUDPC | Std.Dev. |
|---|---|---|---|---|---|---|
| Río grande (RG) | 1333.2a | 79.8 | 0.4a | 0.03 | 7.4a | 0.45 |
| Línea 3 | 1380.3a | 90.4 | 0.4a | 0.03 | 7.7a | 0.51 |
| Línea 51 | 1410.9a | 47.4 | 0.5a | 0.02 | 7.9a | 0.27 |
| Línea 72 | 1354.5a | 140.6 | 0.4a | 0.05 | 7.6a | 0.79 |
| Línea 92 | 1330.0a | 48.9 | 0.4a | 0.02 | 7.4a | 0.27 |
| Línea 43 | 1426.2a | 115.8 | 0.5a | 0.04 | 8.0a | 0.65 |
| Línea 77 | 1362.8a | 59.9 | 0.4a | 0.02 | 7.6a | 0.34 |
| Media | 1371.1 | 0.4 | 7.7 | |||
| DSM | 205.6 | 0.07 | 1.1 | |||
| CV | 6.5 | 6.5 | 6.5 | |||
| R2 | 0.1 | 0.1 | 0.1 | |||
* Averages with similar letters are not significantly different (Waller-Duncan t test for relation K, p<0,05) DMS minimum significant difference.
Table 6. Factors and levels of condition of the parameters used for the LATEBLIGHT epidemiological model to simulate and predict the late blight epidemics in Chapingo.
| Factory | Nivel de condiciones para | ||
|---|---|---|---|
| Phytophthora infestansz | |||
| 0 | 0.5 | 1 | |
| LP | 2.8 | 3.1 | 3.4 |
| LGR | 4.1 | 3.7 | 3.4 |
| SR | 2.9 | 2 | 1.2 |
| IE | 1 | 0.9 | 0.8 |
| IL | 500 | 50 | 5 |
| DOI | 1 | 11 | 21 |
y LP Minimum latency time (days), LGR maximum proportion of lesion development (m día-1, × 10−3), SR maximum proportion of sporulation (sporangium m−2 día−1, × 108), infection efficiency factor IE (the proportion of sporangia and zoospores that infect the host with a maximum of 0,1 infections per sporangium every day and 0,01 infections per germinated zoospores every night), initial lesion of IL (lesions m−2 of the soil) does not apply under conditions of natural infection and the day of inoculation DOI (two days after emergence) does not apply under conditions of natural infection.
z 0 = favorable (susceptible cultivar Tomasa); 0.5 = intermediate (intermediate cultivar Yungay); 1 = less favorable (resistant cultivar Amarilis) Andrade-Piedra et al. 2005c.
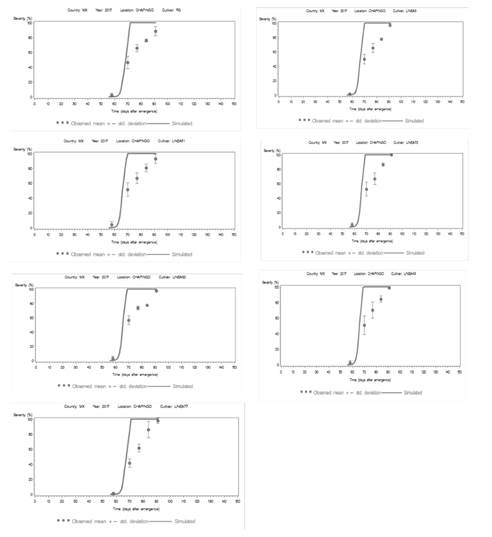
Figure 3. Area under the disease progress curve (AUDPC) of the data observed (circles) and simulated (solid line) of seven late blight epidemics under field conditions in Chapingo, State of Mexico in 2017. The simulated progress curve was developed using the LB2004 version of “LATEBLIGHT”. Vertical lines represent the standard deviation of the mean for the observed severity of late blight.
However, the magnitude of the relative humidity threshold did not remain fixed on 85 or 90% in this model, due to the variation caused by the weather conditions in Chapingo. The RH requires calibration, depending on the degree of susceptibility of the cultivars; specifically, at 80% for susceptible cultivars, and 88% for resistant cultivars. The top limit of 88% exists because humidity does not surpass 90% inside the canopy (Andrade-Piedra et al., 2005b) (Table 7). The susceptible lines have values for AUDPC > 1956 in comparison to the tolerant line (AUDPC < 1753) (Table 7).
Table 7 Parameters and LATEBLIGHT variables for AUDPC in plantation cycle 2017
| Líneaw | AUDPCx | LB2004 Variablesy | Eval0 | Horario | Variables meteorológicasz | ||||||
|---|---|---|---|---|---|---|---|---|---|---|---|
| Obs. | Sim. | HR | Mic | t0 | t1 | H_h | T | HR | |||
| Línea92 S | 1956.1 | 2559 | 80 | 209 | 50-51 | 58 | Ago. 06 | 19:00-04:00 | 9 | 10.1-17 | 84.4-100 |
| Línea72 I | 1932.3 | 2531 | 80 | 190 | 50-52 | 58 | Ago. 06 | 19:00-04:00 | 9 | 10.1-17 | 84.4-100 |
| Línea43 I | 1920 | 2523 | 80 | 160 | 50-53 | 58 | Ago. 06 | 19:00-04:00 | 9 | 10.1-17 | 84.4-100 |
| Línea51 I | 1866.4 | 2494 | 80 | 130 | 50-54 | 58 | Ago. 06 | 19:00-04:00 | 9 | 10.1-17 | 84.4-100 |
| Línea03 I | 1819.4 | 2446 | 80 | 98 | 50-55 | 58 | Ago. 06 | 19:00-04:00 | 9 | 10.1-17 | 84.4-100 |
| Línea77 I | 1775.3 | 2363 | 80 | 59 | 50-56 | 58 | Ago. 06 | 19:00-04:00 | 9 | 10.1-17 | 84.4-100 |
| RG R | 1753 | 2285 | 80 | 37 | 50-57 | 58 | Ago. 06 | 19:00-04:00 | 9 | 10.1-17 | 84.4-100 |
w S susceptible, I intermediate, R resistant.
x obs = AUDPC observed; sim = AUDPC simulated.
y RH = RH_threshold = relative humidity threshold to estimate the daily period of humidity of the leaf (%); Mic = InMicCol = initial microcolonies used in the simulation, t0 = last evaluation of unobserved lesions in P. infestans (days after emergence) to estimate the initial inoculum, t1 = first evaluation of lesions observed in P. infestans (days after emergence) to estimate the initial inoculum; Eval0 = date of evaluation of the severity of the pathogen without lesions observed in the field.
z Daily range of the minimum air temperature (°C), H_h daily period when relative humidity > 80%, calculated de 24:00 to 24:00, RH daily range of relative humidity ≥80%.
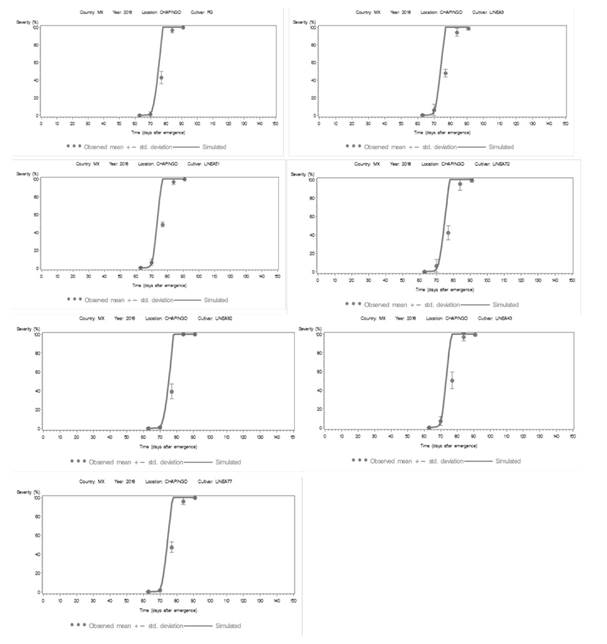
Figure 4. Area under the disease progress curve (AUDPC) of the data observed (circles) and simulated (solid line) of seven late blight epidemics under field conditions in Chapingo, State of Mexico in 2018. The simulated progress curve was developed using the LB2004 version of “LATEBLIGHT”. Vertical lines represent the standard deviation of the mean for the observed severity of late blight.
During the 2018 cycle, the application of the model’s algorithm generated simulated AUDPC values near to those observed in the field, and in turn (Figure 4), the model predicted the incidence of epidemics two days before the natural infection observed in the field. The epidemic prediction was developed with the magnitudes of the epidemiological variables and parameters (Table 6), as well as the weather parameters of T between 10.6 and 15.4 °C, an RH of between 80 and 100% for a continuous period of 5 to 13.5 h in the nighttime and part of the dawn. However, the threshold magnitude of relative humidity did not remain fixed on 85 to 90% according to the model, due to the variation caused by weather conditions in Chapingo. As a result, RH was calibrated to 80-85% for susceptible lines and 86% for tolerant lines. This value was used because the maximum RH did not surpass 90% within the foliar canopy (Andrade-Piedra et al., 2005b) (Table 8). The AUDPC distinguishes susceptible lines (AUDPC > 1426) from tolerant lines (AUDPC < 1333) (Table 8).
Table 8 Parameters and LATEBLIGHT variables for AUDPC in harvest cycle 2018.
| Líneaw | AUDPCx | LB2004 Variablesy | Eval0 | Horario | Variables meteorológicasz | ||||||
|---|---|---|---|---|---|---|---|---|---|---|---|
| Obs. | Sim. | HR | Mic | t0 | t1 | H_h | T | HR | |||
| Línea 43 | 1426.2 | 1789 | 80 | 77 | 55-56 | 63 | Ago. 16 | 22:00-08:00 | 10 | 12.8-15.4 | 82.1-96.3 |
| Línea 51 | 1410.9 | 1773 | 80 | 69 | 55-56 | 63 | Ago. 16 | 22:00-08:00 | 10 | 12.8-15.4 | 82.1-96.3 |
| Línea 03 | 1380.3 | 1736 | 80 | 53 | 55-56 | 63 | Ago. 16 | 22:00-08:00 | 10 | 12.8-15.4 | 82.1-96.3 |
| Línea 77 | 1362.8 | 1697 | 80 | 41 | 55-56 | 63 | Ago. 16 | 22:00-08:00 | 10 | 12.8-15.4 | 82.1-96.3 |
| Línea 72 | 1354.5 | 1670 | 80 | 34 | 55-56 | 63 | Ago. 16 | 22:00-08:00 | 10 | 12.8-15.4 | 82.1-96.3 |
| RG | 1333.2 | 1637 | 80 | 27 | 55-56 | 63 | Ago. 16 | 22:00-08:00 | 10 | 12.8-15.4 | 82.1-96.3 |
| Línea 92 | 1330 | 1615 | 80 | 23 | 55-56 | 63 | Ago. 16 | 22:00-08:00 | 10 | 12.8-15.4 | 82.1-96.3 |
w S susceptible, yo intermediate, R resistant.
x Obs = AUDPC observed; sim = AUDPC simulated.
y RH = RH_threshold = relative humidity threshold to estimate the daily period of humidity of the leaf (%); Mic = InMicCol = initial microcolonies used in the simulation, t0 = last evaluation of unobserved lesions in P. infestans (days after emergence) to estimate the initial inoculum, t1 = first evaluation of lesions observed in P. infestans (days after emergence) to estimate the initial inoculum; Eval0 = date of evaluation of the severity of the pathogen without lesions observed in the field.
z T Daily range of the minimum air temperature (°C), H_h daily period when relative humidity > 80%, calculated de 24:00 to 24:00, RH daily range of relative humidity ≥80%.
The expected scenarios were based on (1) a better multiple linear regression model; (2) a tendency graph, curves; and (3) selection criterion 80% ≤RH≤90% for T and RH. These criteria helped identify five favorable scenarios for P. infestans epidemics with four to ten P. infestans infection cycles with a duration of 5 to 12 h for the weather conditions in Chapingo. The infection rates observed during the 2017 and 2018 planting cycles confirmed that the real incidence of conditions favorable to P. infestans was influenced by (1) weather conditions (T and RH). The infection caused by P. infestans in the cycle observed in the field in 2017 was observed to coincide with expected scenarios IV-4 and III-1, and in 2018, it coincided with scenario V-2. The field experiment model is valid with a coefficient variation of <16%.
Conclusions
The number of infection cycles in the expected scenario was directly related with the severity presented by P. infestans in the scenarios observed. The higher the number of infection cycles related to favorable weather conditions, the higher the severity of late blight will be. The scenarios simulated with the LATEBLIGHT model predicted the severity of the scenarios observed two days in advance. This led to expected, observed and simulated scenarios having a broad relation for the prediction of P. infestans epidemics in tomato crops in Chapingo. In conclusion, the model proved to be able to predict infection epidemics in the field, facilitating the timely application of the thorough control methods, which would produce economic benefits and reduce the environmental impacts of agrochemicals.
Literatura Citada
Alarcón-Rodríguez, NM., Valadez-Moctezuma, E. and Lozoya-Saldaña, H. 2014. Molecular Analysis of Phytophthora infestans (Mont.) de Bary from Chapingo, Mexico. Phylogeographic Referential. American journal of potato research 91:459-466. DOI https://www.doi.org/10.1007/s12230-014-9375-y [ Links ]
Andrade-Piedra, JL., Hijmans, RJ., Forbes, GA., Fry, WE. and Nelson, RJ. 2005a. Simulation of potato late blight in the Andes I: Modification and parameterization of the LATEBLIGHT model. Phytopathology 95:1191-1199. DOI: https://www.doi.org/10.1094/PHYTO-95-1191 [ Links ]
Andrade-Piedra, JL., Hijmans, RJ., Juarez, HS., Forbes, GA., Shtienberg, D. and Fry, WE. 2005b. Simulation of potato late blight in the Andes II: Validation of the LATEBLIGHT model. Phytopathology 95:1200-1208. DOI: https://www.doi.org/10.1094/PHYTO-95-1200 [ Links ]
Andrade-Piedra, JL., Forbes, GA., Shtienberg, D., Grünwald, NJ., Chacon, MG., Yaipe, MV., Hijmans, RJ. and Fry, WE. 2005c. Qualification of a plant disease simulation model: Performance of the LATEBLIGHT model across a broad range of environments. Phytopathology 95:1412-1422. DOI: https://www.doi.org/10.1094/PHYTO-95-1412 [ Links ]
Berdúo-Sandoval, JE., Ruiz-Chután, JA. and Sanchéz-Pérez, A. 2019. Evaluación de la resistencia de genotipos de tomate frente a aislados de Phytophthora infestans provenientes de Guatemala. Ciencia, Tecnología y Salud 6:36-47. https://digi.usac.edu.gt/ojsrevistas/index.php/cytes/article/view/672/562 [ Links ]
Bonierbale, MW., Haan, SD., Forbes, A. and Bastos, C. 2010. Procedimientos para pruebas de evaluacion estandar de clones avanzados de papa: Guia para cooperadores internacionales. 151pp. https://cgspace.cgiar.org/bitstream/handle/10568/73221/73331.pdf?sequence=2 [ Links ]
Bostock, RM., Pye, MF. and Roubtsova, TV. 2014. Predisposition in plant disease: exploiting the nexus in abiotic and biotic stress perception and response. Annual review of phytopathology 52:517-549. DOI: https://www.doi.org/10.1146/annurev-phyto-081211-172902 [ Links ]
Cadena-Hinojosa, MA., Diaz-Valasis, M., Guzman-Plazola, RA., Fernandez-Pavia, S. and Grunwald, NJ. 2007. Late blight resistance of five mexican potato cultivars in the eastern sierra of the state of the Mexico. American Journal of Potato Research 84:385-392. https://pubag.nal.usda.gov/pubag/downloadPDF.xhtml?id=13571&content=PDF [ Links ]
Childers, R., Danies, G., Myers, K., Fei, Z., Small, IM. and Fry, WE. 2015. Acquired Resistance to Mefenoxam in Sensitive Isolates of Phytophthora infestans. Phytopathology 105:342-349. DOI: https://www.doi.org/10.1094/PHYTO-05-14-0148-R [ Links ]
Collinge, DB., Jorgensen, HJ., Lund, OS. and Lyngkjaer, MF. 2010. Engineering pathogen resistance in crop plants: current trends and future prospects. Annu Rev Phytopathology 48:269-291. DOI:https://www.doi.org/10.1146/annurev-phyto-073009-114430 [ Links ]
Danies, G., Small, IM., Myers, K., Childers, R. and Fry, WE. 2013. Phenotypic Characterization of Recent Clonal Lineages of Phytophthora infestans in the United States. Plant Disease 97:873-881. DOI: https://www.doi.org/10.1094/PDIS-07-12-0682-RE [ Links ]
Díaz, CJB., Lozoya-Saldaña, H., Sahagún-Castellanos, J. and Peña-Lomelí, A. 2014. The Pathosystem Solanum tuberosum L.-Phytophthora infestans (Mont.) de Bary in Chapingo, Mexico. Expected, Observed, and Simulated. American journal of potato research 91:312-326. DOI https://www.doi.org/10.1007/s12230-013-9351-y [ Links ]
Dudler, R. 2013. Manipulation of host proteasomes as a virulence mechanism of plant pathogens. Annual Review of Phytopathology 51:521-42. DOI:https://www.doi.org/10.1146/annurev-phyto-082712-102312 [ Links ]
Forbes, GA., Fry, WE., Andrade-Piedra, JL. and Shtienberg, D. 2008. Simulation models for potato late blight management and ecology. Integrated management of diseases caused by fungi, phytoplasma and bacteria. Pp: 161-177. Springer, Dordrecht. [ Links ]
Fry, WE. 1978. Quantification of general resistance of potato cultivars and fungicide effects for integrated control of late blight. Phytopathology 68:1650-1655. https://www.apsnet.org/publications/phytopathology/backissues/Documents/1978Articles/Phyto68n11_1650.PDF [ Links ]
García, E. 1987. Modificaciones al Sistema de Clasificación Climática de Koppen para adaptarlo a condiciones de México. Editorial de la Universidad Nacional Autónoma de México (UNAM). Distrito Federal de México. 246 pp. [ Links ]
Henfling, JW. 1987. Late blight of potato: Phytophthora infestans. Technical information bulletin 4. International Potato Center, Lima, Peru. (Second edition, revised). 25 pp. https://books.google.com.mx/books [ Links ]
Hu, CH., Perez, FG., Donahoo, R., McLeod, A., Myers, K., Ivors, K., Ristaino, JB. 2012. Recent Genotypes of Phytophthora infestans in the Eastern United States Reveal Clonal Populations and Reappearance of Mefenoxam Sensitivity. Plant Disease 96:1323-1330. DOI:10.1094/PDIS-03-11-0156-RE [ Links ]
Iglesias, I., Escudero, O., Seijo, C. and Mendez, J. 2010. Phytophthora infestans prediction for a potato crop. American Journal of Potato Research 87:32-40. DOI 10.1007/s12230-009-9114-y [ Links ]
Johnson, DA., Cummings, TF., Ghanem, RA. and Alldredge, JR. 2009. Association of solar irradiance and days of precipitation with incidence of potato late blight in the semiarid environment of the Columbia Basin. Plant disease 93:272-280. DOI:https://www.doi.org/10.1094/PDIS-93-3-0272 [ Links ]
Johnson, ACS., Jordan, SA., Gevens, AJ., Pathology, P. and Madison, W. 2015. Efficacy of Organic and Conventional Fungicides and Impact of Application Timing on Control of Tomato Late Blight Caused by US-22, US-23 and US-24 Isolates of Phytophthora infestans. Plant Disease 99:641-647. DOI:https://www.doi.org/10.1094/PDIS-04-14-0427-RE [ Links ]
Kamoun, S. and Smart, CD. 2005. Late blight of potato and tomato in the genomics era. Plant Disease 89:692-699. DOI: https://www.doi.org/10.1094/PD-89-0692 [ Links ]
Leyva-Mir, SG., González-Solano, CM., Rodríguez-Pérez, JE. and Montalvo-Hernández, D. 2013. Behavior of advanced lines of tomato (Solanum lycopersicum L.) to phytopathogens at Chapingo, Mexico. Revista Chapingo. Serie Horticultura 19:301-313. DOI: https://www.doi.org/10.5154/r.rchsh.2012.12.070 [ Links ]
Morales, W., Taipe, P. and Forbes, GA. 2011. Concentracion e infeccion de esporangios de Phytophthora infestans (Mont.) de Bary en pre-emergencia de tuberculos de papa (Solanum tuberosum). https://cgspace.cgiar.org/bitstream/handle/10568/67656/74877.pdf?sequence=1 [ Links ]
Nowicki, M., Foolad, MR., Nowakowska, M. and Kozik, EU. 2012. Potato and tomato late blight caused by Phytophthora infestans: an overview of pathology and resistance breeding. Plant Disease 96:4-17. DOI:https://www.doi.org/10.1094/PDIS-05-11-0458 [ Links ]
Ojiambo, PS., Gent, DH., Quesada-Ocampo, LM., Hausbeck, MK. and Holmes, GJ. 2015. Epidemiology and Population Biology of Pseudoperonospora cubensis: A Model System for Management of Downy Mildews. Annual Review of Phytopathology 53:223-246. DOI:https://www.doi.org/10.1146/annurev-phyto-080614-120048 [ Links ]
SAS Institute Inc. Cary. 2002. SAS Online Doc® 9. Cary, NC: SAS Institute Inc. [ Links ]
Saville, A., Graham, K., Grünwald, NJ., Myers, K., Fry, WE. and Ristaino, JB. 2015. Fungicide Sensitivity of U.S. Genotypes of Phytophthora infestans to Six Oomycete-Targeted Compounds. Plant Disease 99:659-666. DOI: https://www.doi.org/10.1094/PDIS-05-14-0452-RE [ Links ]
Schornack, S., Moscou, MJ., Ward, ER. and Horvath, DM. 2013. Engineering Plant Disease Resistance Based on TAL Effectors. Annual Review of Phytopathology 51:383-406. DOI:https://www.doi.org/10.1146/annurev-phyto-082712-102255 [ Links ]
Shaner, G. and Finney, RE. 1977. The effect of nitrogen fertilization on the expression of slow-mildewing resistance in Knox wheat. Phytopathology 67:1051-1056. [ Links ]
Skelsey, P., Rossing, WAH., Kessel, GJT. and Van der Werf, W. 2009. Scenario approach for assessing the utility of dispersal information in decision support for aerially spread plant pathogens, applied to Phytophthora infestans. Phytopathology 99:887-895. DOI:https://www.doi.org/10.1094/PHYTO-99-7-0887 [ Links ]
Skelsey, P., Rossing, WAH., Kessel, GJT. and Van der Werf, W. 2010. Invasion of Phytophthora infestans at the landscape level: how do spatial scale and weather modulate the consequences of spatial heterogeneity in host resistance? Phytopathology 100:1146-1161. DOI:https://www.doi.org/10.1094/PHYTO-06-09-0148 [ Links ]
Taipe, A., Forbes, G. and Andrade-Piedra, J. 2011. Estimacion del nivel desusceptibilidad a Phytophthora infestans en genotipos de papa. https://cgspace.cgiar.org/bitstream/handle/10568/67655/74876.pdf?sequence=1&isAllowed=y [ Links ]
Yuen, JE. and Forbes, GA. 2009. Estimating the level of susceptibility to Phytophthora infestans in potato genotypes. Phytopathology 99:782-786. DOI:https://www.doi.org/10.1094/PHYTO-99-6-0782 [ Links ]
Yuen, J. and Mila, A. 2015. Landscape-scale disease risk quantification and prediction. Annual Review of Phytopathology 53:471-484. DOI: https://www.doi.org/10.1146/annurev-phyto-080614-120406 [ Links ]
Zhan, J. and McDonald, BA. 2013. Experimental measures of pathogen competition and relative fitness. Annual Review of Phytopathology 51:131-53. DOI: https://www.doi.org/10.1146/annurev-phyto-082712-102302. [ Links ]
Received: October 29, 2019; Accepted: November 27, 2019
 Este es un artículo publicado en acceso abierto bajo una licencia
Creative Commons
Este es un artículo publicado en acceso abierto bajo una licencia
Creative Commons
