


Serviços Personalizados
Journal
Artigo
 texto em
  Inglês (pdf)
 Artigo em XML
 Referências do artigo
 Enviar este artigo por email
Indicadores
-
 Citado por SciELO
 -
 Acessos
Links relacionados
-
 Similares em
SciELO
Similares em
SciELO
Compartilhar

 Permalink
Revista mexicana de fitopatología
versão On-line ISSN 2007-8080versão impressa ISSN 0185-3309
Rev. mex. fitopatol vol.37 no.1 Texcoco Jan. 2019 Epub 21-Ago-2020
https://doi.org/10.18781/r.mex.fit.1809-4
Scientific articles
Applied regional epidemiology to inductive characterization and forecasting of blue agave gray-spot (Cercospora agavicola) in Jalisco, Mexico
1 Programa de Postgrado en Fitosanidad-Fitopatología, Colegio de Postgraduados (CP), Campus Montecillo, Km 36.5 Carretera México-Texcoco. Montecillo, Estado de México, C. P. 56230;
2 Laboratorio de Análisis de Riesgo Epidemiológico Fitosanitario (CP-LANREF);
3 Área de Investigación, Casa Sauza, Francisco Javier Sauza #80, Tequila, Jalisco, C.P. 46400.
Cercospora agavicola, causal agent of the gray spot of blue agave (Agave tequilana), is a regulated fungus under official control in states under the Denomination of Origin of Tequila (DOT). This work was carried out in Jalisco, Mexico, the main DOT region, to determine the spatial-temporal epidemic inductivity of the fungus and to develop stochastic models to forecast the gray spot in order to support regional preventive programs. Monthly, from October 2016 to December 2017 the severity, incidence and number of diseased plants were evaluated in 41 plots established in commercial agave plantations of 3-4 years of age selected with weighted risk criteria in Los Altos (20), Valleys (11) and South (10). The regional epidemic inductivity of C. agavicola was heterogeneous with a greater risk for at least nine counties of Los Altos. However, low epidemic rates (0.0008-0.006 units week-1), strong restriction spread (1-4 plants), reduced annual increment of incidence (0-32 plants / 0.5 ha) and no spore capture evidenced the low parasitic fitness and reduced fungus epidemic potential. Consequently, limited predictive capacity was found even with the best goodness of fit models (R2 adj 0.51-0.60). The favorable hours (HFav) of January-April, with respect to infection, was consistent among models, so it can be used as preventive algorithm in SIVEA (www.sivea.org.mx). The regional losses were estimated between 237 thousand US dollars and 98.01 MDD. Cercosporin, a toxin associated with Cercospora genus, may be involved in atypical linear temporal progress and should be integrated in future research.
Key words: Losses; drone; toxin,Weibull; NCBI; AUDPC; SIVEA
Cercospora agavicola, agente causal de la mancha gris del agave azul (Agave tequilana), es un hongo reglamentado bajo control oficial en estados bajo Denominación de Origen del Tequila (DOT). Este trabajo se desarrolló en Jalisco, México, principal región DOT, para determinar la inductividad epidémica espacio-temporal del hongo y desarrollar modelos estocásticos de pronóstico de la mancha gris con el fin de sustentar acciones preventivas regionales. De octubre 2016 a diciembre 2017 se evaluó mensualmente la severidad, incidencia y número de plantas enfermas en 41 parcelas establecidas en plantaciones comerciales de agave de 3-4 años de edad seleccionadas con criterios ponderados de riesgo en Los Altos (20), Valles (11) y Sur (10). La inductividad epidémica regional de C. agavicola fue heterogénea con mayor riesgo para al menos nueve municipios de Los Altos. Sin embargo, bajas tasas epidémicas (0.0008-0.006 unidades semana-1), fuerte restricción de contagio (1-4 plantas), reducido incremento anual de incidencia (0-32 plantas/0.5 ha) y nula captura de esporas evidenciaron la baja aptitud parasítica y epidémica del hongo. Consecuentemente, se encontró limitada capacidad predictiva aun con los mejores modelos generados (R2 adj 0.51-0.60). Las horas favorables (HFav) de enero-abril, respecto a la infección, fue consistente entre modelos por lo que puede integrarse como algoritmo preventivo en SIVEA (www.sivea.org.mx). Las pérdidas regionales establecidas se estimaron entre 237 mil dólares americanos y 98.01 MDD. La cercosporina, toxina asociada al género Cercospora, puede estar implicada en el progreso temporal lineal atípico y debe integrarse en futuras investigaciones.
Palabras clave: Pérdidas; dron; tóxina; Weibull; NCBI; ABCPE; SIVEA
Mexico holds the Denomination of Origin of Tequila (DOT) composed by 181 municipalities of the states of Guanajuato (7), Michoacán (30), Nayarit (8), Tamaulipas (11) and Jalisco in its entirety (125). The DOT represents 73.4% (81,053 ha) of the nationally grown blue agave (Agave tequilana Weber var. Azul), Jalisco being the most representative with 64,499 ha (SIAP 2018). Throughout the tequila industry, the DOT directly favors the regional economy by generating estimably 1,600 million of Mexican pesos per year and represents the economic support of 70,000 families (SIAP 2015). The implications of maintaining the DOT agave region, legally defined in time and space, is multidimensional but it is substantiated on the challenge of guaranteeing productive sustainability and profitability with a long-termed resilient model.
From the decade of the ‘90s, the productive inventories of agave in Jalisco have been strongly affected by phytosanitary factors amongst which the weevil (Scyphophorus acupunctatus), the agave wilt caused by Fusarium spp, and the gray spot caused by Cercospora agavicola stand out. Given the recurrent shortages of sowing plants and the increase tendency of the pineapple’s price (agave stem) the number of mobilized shoots (hijuelo in spanish) within and between states has increased, rising some major phytosanitary risks. Therefore it is important to strengthen and improve the control and sampling within the framework of the Campaign Against Regulated Pests of the Agave (SENASICA, 2017). Likewise, it is important to develop new preventive and control management algorithms for their incorporation into SIVEA (Comprehensive Epidemiological Surveillance System of the Agave), a phytosanitary web system operated by SENASICA-DGSV (www.sivea.org.mx). At present one of the main concerns of producers is the difficulty of C. agavicola control, therefore this project focused on studying the gray spot in Jalisco, a state in which plant damage has historically been reported in Los Altos (Acatic, San Juan de Los Lagos, Tepatitlán and Yahualica), Valleys (Amatitán, Ahualulco, Arenal, Magdalena, San Juanito de Escobedo and Tequila), Sur (Autlán, El Grullo, El Limón and Unión de Tula) and Sierra Occidental (Atenguillo, Mascota and Mixtlán) (Rubio 2007). The gray spot was first reported in 2003 in Pénjamo, Guanajuato and in 2005 the causal agent was identified as C. agavicola (Ayala et al., 2005). The fungus’ infection apparently occurs within October and March under favorable conditions of relative humidity ≥80% and average temperatures between 15 and 22 ° C (Ángeles-Espino et al., 2016; Valencia 2011; Rubio 2007). The primary infection causes black oval lesions of up to 1-3 cm commonly found in the middle to upper third of non-expanded leaves of the plant’s head. The disease develops rapidly producing coalescing, depressed grayish spots and ends with the collapse of the head and death of the plant.
Although the implication of cercosporin in the symptom has not been confirmed a non-specific toxin produced by Cercospora spp, activated by light and temperature (Daub and Ehrenshaft, 2000; Jens et al., 1989), this study was based upon the premise that it is possible to predict the primary infectious process independent of the effect of said toxin. Likewise, it was proposed to characterize spatio-temporal attributes at the plot-region level in order to understand processes of dispersion, prevalence and epidemic intensity applicable to the generation of an early warning system to strengthen the preventive management of the agave gray spot.
Materials and methods
Network monitoring and regional epidemiological inductivity. From October 2016 to December 2017 a monitoring network of 41 plots distributed in commercial agave plots of 3-4 years in Los Altos (20), Valley(11) and South (10) in the state of Jalisco was established and evaluated. The plots were selected based on an analysis of regional epidemic inductivity, for which data from the occurrence of focus points of infestation were used. These were generated during 2012-2015 by the Regulated Pests Campaign of the Agave (www.sivea.org.mx) cultivated surface (SIAP, 2015), weather (CONAGUA 2015) and edaphic factors. The Reg-N methodology was applied to the incorporated data matrix to generate a multivariate inductive epidemic indicator and to select plots that maximize the regional epidemic variability of the disease (Table 1) (Acevedo-Sánchez et al., 2017; Aguilera and Acevedo-Sánchez 2016). The epidemic indicator was used to generate a regional inductivity map using ArcMap from ArcGis v10.3. A plot with a plant population of approximately 0.5 ha was selected per commercial property amongst which 25 plots had a focal point of 1-94 infected plants with gray spot severity between 6-65%. This focal point constituted the Y o or initial epidemic intensity. In 16 plots there were only apparent healthy plant populations. At the center of each plot, a modified TIDE trap was placed with a device of passive impact and deposition (Mora-Aguilera et al., 2014). In each trap, three slides were placed with double-sided adhesive tape, two in the disposition device and one on the impact device. A Hobo® Pro V2 data logger configured at 30-minute intervals was installed in the trap support in order to relate changes in disease intensity with temperature and relative humidity variables. The trap slides were collected on a 15-days interval and in situ extraction of climatic data was conducted.
Molecular diagnosis of C. Agavicola . In order to confirm the relation between the gray spot and the disease-causing agent, plant samples with common disease lesions were collected in 13 monitoring plots. In the laboratory, the tissue was disinfested with 1.5% sodium hypochlorite for two minutes, rinsed 3 times with sterile water and incubated in a humid chamber at 24-28 °C alternating 12:12 h light:dark for 3 days. From the mycelial growth, the fungus was isolated and cultured in agave-agar medium (Ayala et al., 2005). DNA extraction was performed by the modified AP method (Sambrook and Russel, 2001) and the ITS region 1-4 was amplified through PCR (White et al., 1990). The PCR product was sent to Macrogen (Seoul Korea) for sequencing and the sequences identification was made through the web program Blast® blastn suite at NCBI (https://blast.ncbi.nlm.nih.gov/Blast.cgi).
Variables evaluation. The infected plants incidence and severity were evaluated monthly in each plot throughout a diagrammatic scale of 7 classes (0 = healthy, 1 = 2%, 2 = 6%, 3 = 22%, 4 = 65%, 5 = 85% and 6 = 100%) (Jiménez-González et al., 2017). The evaluation was solely conducted in the same plants, for which they were selected and marked in a discontinuous systematic pattern of 1x2 rows and 1x3 plants per row, with a total of 273 plants.
Table 1. Location of 41 monitoring plots in commercial blue agave plantations of 3-4 years of age selected by criteria of epidemic inducibility for the regional study of gray spot, and initial condition (Y 0 ) of disease occurrence represented by the number of symptomatic plants (P.enf) and average severity of diseased plant (SProm) per plot. Jalisco, Mexico. 2016-2017.
| Región | Municipio | Latitud | Longitud | ID Plantación | P.enf (Y0)x | SProm(Y0)y |
|---|---|---|---|---|---|---|
| Altos | Arandas | 20.6973 | -102.2572 | A-ARA-CP01 | 94 | 32.8 |
| 20.8508 | -102.1592 | A-ARA-CP04 | 1 | 100 | ||
| 20.7618 | -102.2936 | A-ARA-CP05 | 3 | 63.6 | ||
| 20.7624 | -102.3470 | A-ARA-CP06 | 7 | 31.4 | ||
| 20.6954 | -102.3241 | A-ARA-CP20 | 22 | 22.5 | ||
| Jesús María | 20.6161 | -102.1381 | A-JM-CP02 | 12 | 58.5 | |
| 20.6698 | -102.0802 | A-JM-CP03 | 0 | 0.0 | ||
| 20.5931 | -102.1582 | A-JM-CP19 | 4 | 57.2 | ||
| Tepatitlán M. | 20.7891 | -102.5530 | A-TEP-CP08 | 0 | 0.0 | |
| 20.8581 | -102.6558 | A-TEP-CP09 | 1 | 6.0 | ||
| 20.6605 | -102.6456 | A-TEP-CP14 | 0 | 0.0 | ||
| Zapotlanejo | 20.5797 | -102.8915 | A-ZAP-CP10 | 1 | 85.0 | |
| Cerro Gordo | 20.6842 | -102.5042 | A-SICG-CP15 | 10 | 43.5 | |
| 20.7505 | -102.4838 | A-SICG-CP07 | 18 | 61.1 | ||
| Ocotlán | 20.4247 | -102.7568 | A-OCO-CP11 | 0 | 0.0 | |
| Atotonilco A. | 20.5151 | -102.6127 | A-ATO-CP12 | 2 | 85.0 | |
| Mextican | 21.2626 | -102.7186 | A-MEX-CP16 | 1 | 22.0 | |
| Yahualica G. G. | 21.1117 | -102.8675 | A-YAH-CP17 | 0 | 0.0 | |
| 21.1674 | -102.8727 | A-YAH-CP18 | 2 | 2.0 | ||
| Ayotlán | 20.5357 | -102.3696 | A-AYO-CP13 | 1 | 65.0 | |
| Valles | Hostotipaquillo | 21.0404 | -104.1994 | V-HOS-CP01 | 3 | 42.6 |
| Magdalena | 20.9298 | -104.1078 | V-MAG-CP02 | 0 | 0.0 | |
| 20.8982 | -103.9450 | V-MAG-CP03 | 1 | 85 | ||
| 20.9674 | -104.0410 | V-AMA-CP11 | 0 | 0.0 | ||
| Tequila | 20.9362 | -103.8726 | V-TEQ-CP04 | 0 | 0.0 | |
| Amatitán | 20.8589 | -103.7688 | V-AMA-CP05 | 0 | 0.0 | |
| 20.8344 | -103.6795 | V-AMA-CP06 | 1 | 6.0 | ||
| San Juanito E. | 20.7724 | -103.9958 | V-SJE-CP07 | 0 | 0.0 | |
| Ahualulco M. | 20.7388 | -103.9321 | V-AHU-CP08 | 0 | 0.0 | |
| Ameca | 20.5029 | -103.9862 | V-AME-CP09 | 1 | 2.0 | |
| Cocula | 20.3672 | -103.8636 | V-COC-CP10 | 0 | 0.0 | |
| Sur | Tecolotlán | 20.1896 | -104.0236 | S-TEC-CP01 | 0 | 0.0 |
| Juchitlán | 20.0756 | -104.1008 | S-JUC-CP02 | 0 | 0.0 | |
| Autlán de N. | 19.8322 | -104.3041 | S-AUT-CP03 | 0 | 0.0 | |
| Tuscacuesco | 19.7397 | -103.8802 | S-TUS-CP04 | 0 | 0.0 | |
| San Gabriel | 19.6659 | -103.8135 | S-SGA-CP05 | 4 | 56.0 | |
| San Andrés I. | 19.8257 | -103.5072 | S-GF-CP06 | 3 | 64 | |
| Teocuitatlán C. | 20.0920 | -103.4223 | S-TEO-CP07 | 5 | 39 | |
| 20.1270 | -103.3524 | S-TEO-CP08 | 1 | 6 | ||
| Zacoalco de T. | 20.2014 | -103.5321 | S-ZAC-CP09 | 14 | 35.2 | |
| Acatlán de J. | 20.4808 | -103.6357 | S-ACA-CP10 | 1 | 85 | |
x Penf=Número de plantas enfermas con mancha gris al seleccionar el sitio localizadas al centroide de parcela. / Penf = Number of diseased plants with gray spot when selecting the site located at the plot centroid.
y SPromY0= Severidad promedio en planta enferma al seleccionar el sitio / SPromY0 = Average severity of diseased plant when selecting the site.
The evaluations record was made directly in App-SIVEA v1.1, an Android application for mobile phones developed by COLPOS-LANREF (Guzmán-Hernández et al., 2017). The data was sent via satellite to the SIVEA platform (www.sivea.org.mx) for automatic incorporation of the regional data matrix. The number of spores in 7 cm2 of each slide of the trap was counted in the aerobiological monitoring.
Characterization of epidemics, spatial and temporal analysis. A total of 41 epidemics induced by C. agavicola were temporally and spatially characterized. Based on an exploratory graphic analysis of epidemic parameters (Mora-Aguilera et al., 1993), 14 epidemics were selected, eight in Los Altos, three in Valleys and three in the South for the estimation of regionally representative epidemic rates. For this purposes, the Weibull flexible model was used, which describes and adjusts epidemic curves of diverse form (Mora-Aguilera et al., 1996). For the model fit, data of plant severity and number of infected plants accumulated proportionally, divided by their respective maximum value accumulated per region was transformed in order to standardize different epidemics. The Weibull model, with two parameters was adjusted with the NLIN procedure of SAS® v9.4 through the equation y = 1 - exp (t/b) c where: y = severity or the number of infected plants in proportion, t = time, b = rate estimator parameter and c = shape parameter of the curve. Additionally, the area under the disease progress curve (AUDPC) was estimated with data on plant severity and the number of infected plants. The additive combination was used as a damage index estimator (DI). For the spatial analysis, the epidemic with the highest intensity was selected per region to analyze the spreading behavior amongst plots. With the evaluations on Y o (Nov-2016) and Y max (Dec-2017), interpolated maps were generated and geostatistical semivariograms were analyzed with the Surfer® v10.6 program (Golden software, USA). Additionally, through the MorLloyd version 1.0 program developed in MS Excel (Rivas-Valencia and Mora-Aguilera 2010. Not published) the index of Morisita and Loyd was calculated to estimate the plot spatial dispersion pattern of the disease (Campbell and Madden, 1990).
Detection of foci with drone. To analyze the capacity of early detection of foci assisted with not tripulated vehicle, the DJI® Phantom4 drone with RMP 14mpx camera was used. Orchards of 3-5 years with variable incidence-severity of gray spot were chosen. To optimize the time, energy resources, digital and analytical storage, needed in regional approaches, flights were conducted on vertical trajectory from the centroid/orchard to capture of images between 10-200 m height. Imagens were collected between 8:00 a.m. and 6:00 p.m. to evaluate the effect of reflected light. The analysis of images by the classification method of the maximum probability and improvement of the resolution was made with ArcMap® v10.1 and QGIS® v2.18.2.
Development of forecast models. The generation of stochastic forecast models to estimate changes in disease intensity was developed in two stages: 1) Selection of representative epidemics per region and 2) Generation of multiple linear regression models between five dependent variables Y i with respect to eight independent variables X i with lags (LAG) of 2-20 weeks to include the effect of the incubation period. Models were generated for two epidemic inductivity period (VI i ) corresponding to january-april 2017 (VI 1 ) y june-octuber 2017 (VI 2 ), wich was obtained by graphical exploration between favorable hours and Y i . The goodness of fit of the models was evaluated with CP-Mallow, variance inflation factor (VIF) and the adjusted regression coefficient R2 adj (Mora-Aguilera et al., 1993). Model generation was performed with the REG and GLM procedures of the statistical program SAS v9.4.
Independent variables selection. Due to the parasitic characteristics of C. agavicola, climatic variables were chosen to correlate with dependent variables. The maximum and minimum average of temperature and relative humidity accumulated weekly were used. Successful infection of the fungus requires relative humidity greater than 80% and between 15-22ºC for optimal development (Ángeles-Espino et al., 2016). Based on this, the number of weekly accumulated optimal hours for the germination of C. agavicola conidia that met the two requirements was calculated. The calculation was made with the MS CalculaHF program (Santana-Peñaloza et al., 2015). In total, eight independent X i variables were used to generate forecast models (Table 2).
Dependent variables selection. The dependent variables analyzed were the number of infected plants (Y 1 ), the total number of infected plants (Y 2 ), plant severity (Y 3 ), plan severity in proportion (Y 4 ), and the number of infected plants in proportion (Y 5 ). All the variables represented absolute increments for each time interval t i -t i-l per plot (Y 1 , Y 3 - Y 5 ) or for the n-plots of each region (Y 2 ) (Table 2).
Results
Characterization of the fungus. The cultural, morphological and molecular characteristics of 13 fungal isolates corresponded to C. agavicola. The DNA sequences of the isolates were analyzed with the Blast® blastn suit program, resulting in 99% homology with respect to the sequence with accession number AY647237 corresponding to C. agavicola (Ayala et al., 2005). The sequenced samples were registered in GenBank with accession numbers MH458575-MH458587.
Regional epidemic inductivity. The map of epidemic inductivity at the level of Jalisco showed the potential of C. agavicola to induce epidemics with spatially heterogeneous intensity. The highest potential was estimated for Los Altos with moderate to very high levels, highlighting the municipalities of Jesus Maria, Atotonilco, Ayotlán, Degollado, San Ignacio, Cerro Gordo, Arandas, Tepatitlán and Cuquio (Figure 1). In Valleys, the epidemic induction potential was low to moderate, highlighting Ahualulco, San Juan and Magdalena. The South region showed homogeneous conditions of low inductivity (Figure 1).
Table 2. Dependent and independent variables to generate stochastic models to forecast disease intensity change of blue-agave gray spot in Jalisco, Mexico.
| Variables | Símbolo |
|---|---|
| Independientes (Xi)x | |
| Temperatura promedio semanal | Tprom(2-20 semanas) |
| Temperatura mínima semanal | Tmin(2-20 semanas) |
| Temperatura máxima semanal | Tmax(2-20 semanas) |
| Humedad relativa promedio semanal | HRprom(2-20 semanas) |
| Humedad relativa mínima semanal | HRmin(2-20 semanas) |
| Humedad relativa promedio semanal | HRmax(2-20 semanas) |
| Número de horas favorables con desfase (lag) de n semanas | HFav(2-20 semanas) |
| Número de horas supresivas con desfase (lag) de n semanas | HSup(2-20 semanas) |
| Dependientes en incrementos absolutos (Yi)y | |
| Número de plantas enfermas | Y1 |
| Sumatoria de plantas enfermasz | Y2 |
| Severidad en planta enferma (%) | Y3 |
| Proporción de severidad en planta | Y4 |
| Proporción del número de plantas enfermas | Y5 |
xEl cálculo de variables se realizó por parcela de monitoreo / The calculation of variables was done per each monitoring plot.
yIncremento absoluto: Yi t -Yi t-1 / Absolut increment: Yi t -Yi t-1
zLa sumatoria se realizó para las n-parcelas de monitoreo de cada región (Los Altos, Valles y Sur) por cada tiempo-i de evaluación. / The summatory was made for the n-monitoring plots per each region (Los Altos, Valleys and South) for evaluation time-i.
Characterization of epidemics. In a total of 12 monthly assessments of plant disease incidence severity, the gray spot of the agave was shown with low intensity in 33 of the 41 monitoring plots. In the remaining eight, the disease occurrence was null. In Y o , the average regional incidence in Los Altos was 3.6%, Valleys 0.33%, and South 0.51%. In the final phase of the epidemic study (Y f ) little variation on disease incidence was observed with 2.0, 0.9 and 0.1% with maximum absolute increments in the period from March to May 2017 of 4.4, 1.3 and 0.2%, respectively. In general, the severity of infected plants was within the range of 2-100%, with average severity somewhat between 0.01-12.8%. The absolute annual, regional incidence was in the range of 0-25%. Per plot, the greatest absolute increase in the number of infected plants from Y o to Y max was 94 to 125 plants in Los Altos, 1 to 6 in Valleys and 14 to 17 in the South. Of these plants, the mortality was 9, 1 and 9 in Y f , respectively. The absolute severity increased from 11.3 to 28.1% in Altos, 1.8 to 5.7% in the South and 0.02 to 0.7% in the Valleys. Amongst epidemics of 14 plots selected for temporal modeling, the Los Altos region had the highest damage index (DI) with 74.1-329.9 %num.day-1, followed by the South with 108-144.5 and Valleys 0-51.2 (Table 3).
Spatial Analysis. The analysis of spatial patterns at the plot level showed a limited increase of Y o to Y max in the number and expansion of foci in a period of 5-8 months. The biggest increase including foci coalescence was observed in the plots located in Los Altos, an extreme condition not observed in other monitoring plots (Figure 2). In the plot located on the South and in the Valleys, the increase was mainly in number and intensity of estimated foci with disease severity. The foci maintained practically their original size in Y o and increased from 5 to 9 and from 0 to 2 respectively (Figure 2). The Morisita aggregation index was within the range of 2.4-10.9, indicating moderate to strong aggregation (foci). However, the autocorrelation variograms showed a limited spatial dependence of 2 and 4 plants for the South and Los Altos, respectively. In the Valley region, the lowest spatial dependence with a value of 1 was observed, indicating a strong contagion restriction. Early foci detection of the gray spot was posible in vertical flights set to 50-100 m. The detection-delimitation of foci efficiency was >85%. The most accurate damage characterization was the variable of incidence with a percentage error of ±7%. Accuracy was related to the disease development, age, weeds, height and time/flight (Figure 3).

Figure 1 Map of epidemic inductivity of Cercospora agavicola estimated with a multivariate index of disease occurrence (2012-2015), climate, soil typology and municipal hectares of blue agave (Agave tequilana). Epidemic monitoring plots (white dots) in commercial agave plantations 3-4 years old. Jalisco Mexico.
Temporary Analysis. The estimated epidemic behavior for the standardized and cumulative plant severity ratio (Y 4 ) was the most adequate to forecast epidemic rates in the 14 selected epidemics. The Weibull model with two parameters had moderate goodness of fit in 8/13 epidemics with a range of R2 of 0.62-0.87 (p ≤ 0.001). On 4/13 the regression coefficient (R2) was within the range of 0.96-0.99 (p <0.0001). A plot of the Valley region had only one infected plant in the 12-month period, therefore the adjustment of the model was not required (Figure 3, Table 3). The estimated epidemic rates (b -1 ) were within the range of 0.0008-0.006, corresponding to very low-intensity epidemics. Relatively higher epidemic rates were observed in Los Altos followed by the South region. The shape of the epidemic curves (c) was within the range of 0.58-5.15 and represented atypical linear progress for a multiplicative infectious process (Campbell and Madden, 1990).
Table 3. Weibull model fit parameters and Damage Index (DI) of standardized severity proportion (Y 4 ) curves of 14 regionally selected epidemics to estimate the epidemic rate (1/b) and epidemic intensity (DI) induced by C. agavicola in Jalisco, Mexico. 2016-2017.
| Región | Parcela | Latitud | Longitud | Modelo | 1/b | IDX | R2 | Pr > F |
|---|---|---|---|---|---|---|---|---|
| Altos | A1 | 20.69727 - 102.25716 | Y4 =1- EXP (t/112.7)1.24 | 0.003 | 329.9 | 0.98 | <.0001 | |
| A4 | 20.85077 - 102.15921 | Y4=1- EXP (t/65149.7)0.74 | 0.005 | 168.0 | 0.71 | 0.001 | ||
| A7 | 20.75053 - 102.48384 | Y4=1- EXP (t/1197.1)0.86 | 0.003 | 161.4 | 0.96 | <.0001 | ||
| A10 | 20.57965 - 102.89150 | Y4=1- EXP (t/28742.1)0.85 | 0.004 | 149.9 | 0.62 | 0.004 | ||
| A13 | 20.53568 - 102.36955 | Y4=1- EXP (t/1716.4)2.76 | 0.0008 | 74.1 | 0.77 | 0.0003 | ||
| A15 | 20.68421 - 102.50424 | Y4=1- EXP (t/116.3)1.14 | 0.003 | 120.0 | 0.96 | <.0001 | ||
| A17 | 21.11167 - 102.86754 | Y4=1- EXP (t/3311)1.90 | 0.003 | 93.0 | 0.75 | 0.0005 | ||
| A20 | 20.69541 - 102.32411 | Y4=1- EXP (t/472)1.60 | 0.003 | 130.4 | 0.99 | <.0001 | ||
| Sur | S5 | 19.66587 - 103.81346 | Y4=1- EXP (t/113353)0.58 | 0.004 | 131.1 | 0.86 | <.0001 | |
| S7 | 20.09198 - 103.42234 | Y4=1- EXP (t/25831.5)0.83 | 0.003 | 102.8 | 0.85 | <.0001 | ||
| S9 | 20.20140 - 103.53209 | Y4=1- EXP (t/3629.6)0.86 | 0.004 | 144.5 | 0.99 | <.0001 | ||
| Valles | V9 | 20.50290 - 103.98623 | Y4=1- EXP (t/5740.9)5.15 | 0.0002 | 0.0 | 0 | - | |
| V10 | 20.36717 - 103.86355 | Y4=1- EXP (t/6490.9)1.26 | 0.004 | 30.6 | 0.87 | <.0001 | ||
| V11 | 20.96739 - 104.04096 | Y4=1- EXP (t/28742.1)0.85 | 0.006 | 51.2 | 0.63 | 0.004 | ||
XÍndice de daño=ABCPE del número de plantas enfermas + ABCPE de la severidad de plantas enfermas / Damage index = AUDPC of the number of diseased plants + AUDPC of the severity of diseased plants.
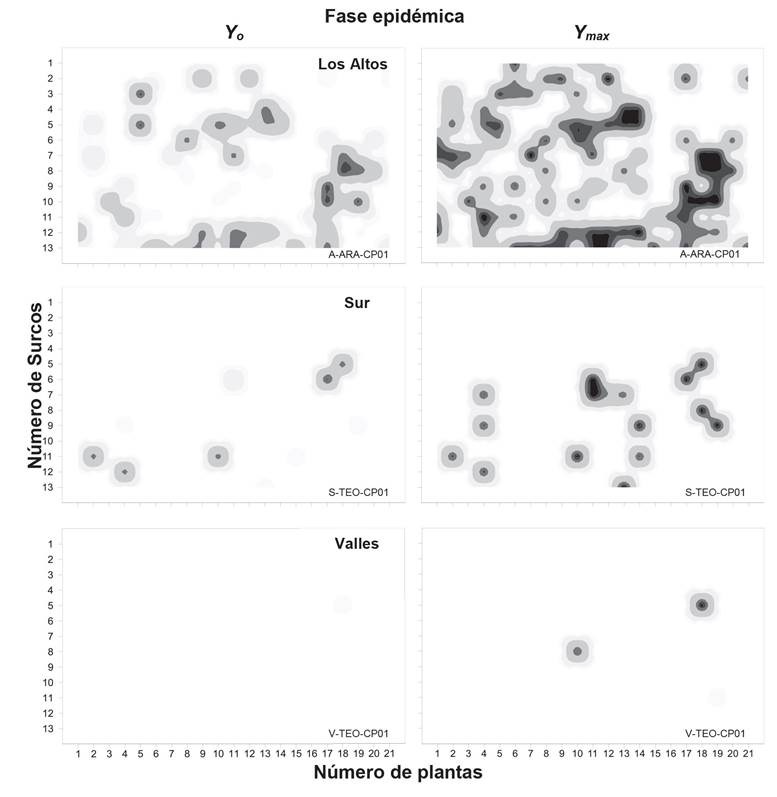
Figure 2 Spatial pattern in the epidemic stages Y0 and Ymax in three commercial plots selected by the largest number of diseased plants in three agave regions of Jalisco, Mexico. Y0 for Altos and South was October 2016; Y0 in Valleys November 2016. Ymax in Altos and South June and July 2017, respectively; Valleys September 2017.
Forecast models.14 epidemics were selected according to their form typology and time intensity contrast for the development of regional forecast models. A total of 82 models were generated and analyzed based on the number of epidemics previously mentioned and dependents variables Y i which was R2 adj of 0.15-0.60. Through with a low forecast capacity, the best models were obtained with Y 2 , the total sum of infected plants per unit of time and per region, and with the variables HFav and HRprom, with a LAG of 2 and 12 weeks as independent variables. These models obtained R2 adj within the range of 0.29-0.60, C(p) of 0.03-8.84, VIF of 1.00-5.93 and p <0.003. The best forecast models were for VI i (January-April 2017) for Los Altos and the South (Table 4, Figure 5).
Discussion
The causal agent of the gray spot of blue agave caused by C. agavicola, has a heterogeneous regional epidemic potential with a higher risk for the region of Los Altos (Figure 1). This insight was verified with 12 months worth of thorough data obtained from a monitoring network of 41 plots under commercial production conditions in Jalisco. However, all parameters, indicators and estimated variables consistently demonstrated the low epidemic capacity of C. agavicola. Due to the regional approach applied, which allows optimizing the epidemiological system and capturing regional epidemic variability, these results are inherently strong. Thus, very low epidemic rates (0.0008- 0.006, units weeks-1), strongly restricted contagion parameters(1-4 plants), an annual increase of diseased plants (0-32 plants) and no captures of spores amongst 41 traps show the low parasitic aptitude of the fungus (Table 2-3, Figure 2).
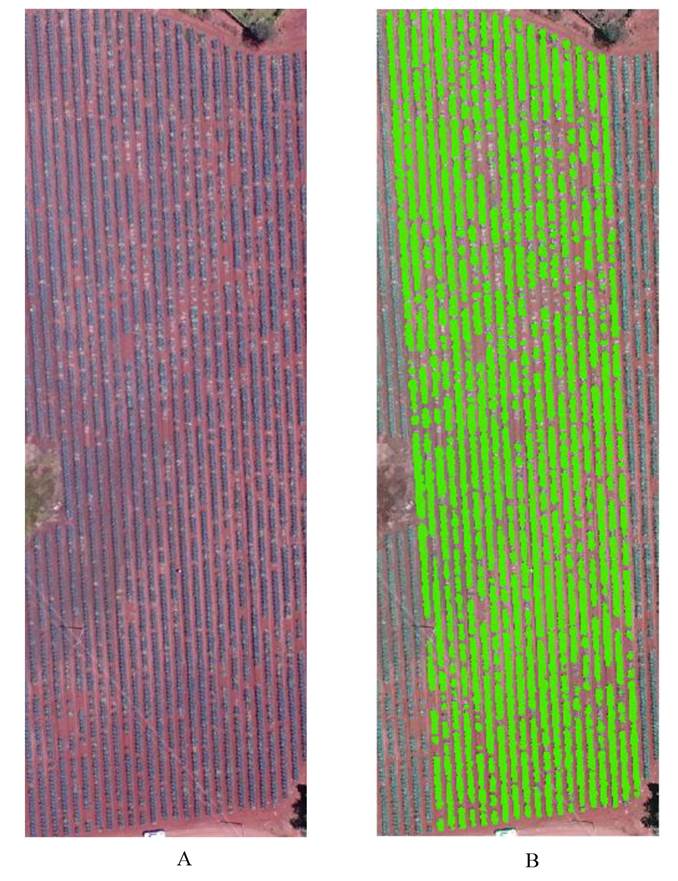
Figure 3 A. RGB image captured at 13 hr at 220 m height in centroid-vertical flight over a hectare of 3-year-old blue agave with incidence of gray spot in Arandas, Jalisco. B. Image processed in ArcGis to estimate plants number and disease incidence. Scout census: 3600 plants vs estimated census by image analysis: 3717. Census incidence vs estimated: 40.5 and 38.3%, respectively. Note the discontinuity within rows (absence of green color or loss of banding) representing simple or coalescent disease foci.
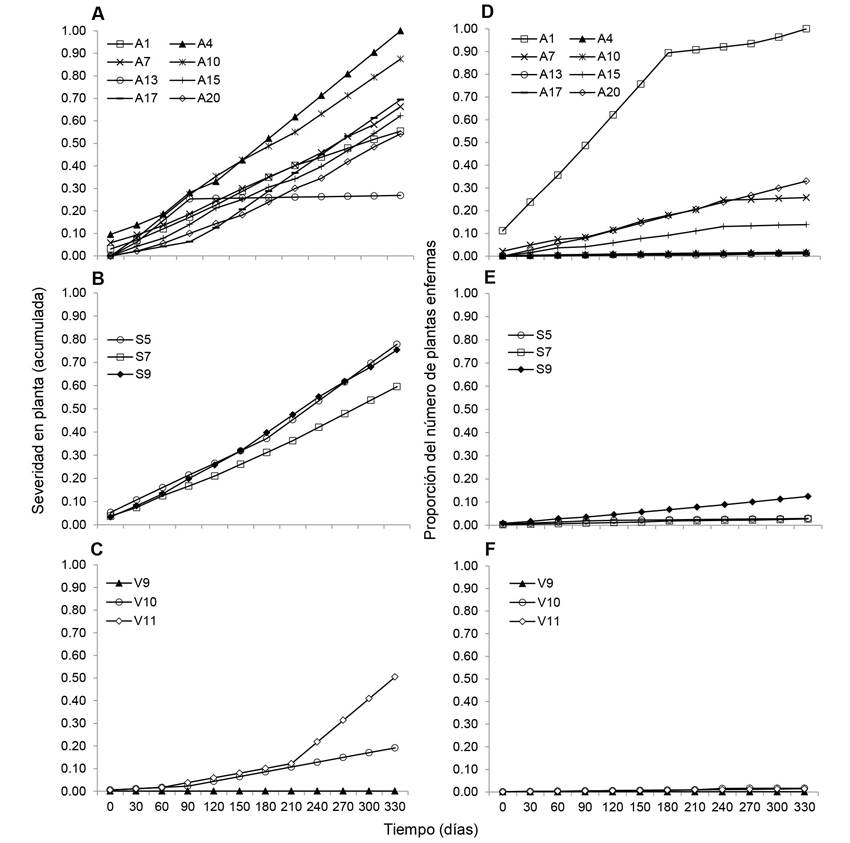
Figure 4 Epidemic progress in 14 commercial agave plots in Jalisco, Mexico. Cumulative standardized proportion of plant severity for A) Los Altos, B) South and C) Valleys. Accumulated standardized proportion of the number of disea sed plants for D) Los Altos, E) South and F) Valleys.
Stochastic forecast models are recurrent in epidemiology because of the analytical ease of including a set of variables in an automatic statistical process of selection of variables and models (Mora-Aguilera et al., 1993; Chuang y Jeger, 1987; Coakley et al., 1985). However, the practical application of these models is limited by regional level due to the restricted uptake of implicit variability in plot studies different with regional approaches (Mora-aguilera et al., 2015; Carmona et al., 2010). On the other hand, an obligatory condition for the viability of the forecast is the occurrence of epidemics with peaks of variable intensity to guarantee the identification of independent variables with a significant exploratory capacity (Mora-Aguilera et al., 1993). In this work, exhaustive in the characterization of the regional epidemic variance with the study of 41 epidemics, the low intensity of the disease did not allow the development of models with acceptable productive capacity (i.e. R2 > 0.70). This restriction, more than temporal, may be associated with the limited parasitic fitness of C. agavicola and to the role of the toxin in damage intensity (Apoga et al., 2002; Franco-Navarro y Zavaleta-Mejía, 2001; Daub y Ehrenshaft, 2000; Jens et al., 1989; Kurppa, 1985), which may be important due to the absence of a typical curve of infectious processes with linear temporal trends (Figure 4). Consequently, the premise of this research to predict the primary infectious process successfully, independent of the effect of the toxin could be ruled out and in future mixed models which include the infectious and toxic process would be necessary. More over considering the adaptation of agave to dry weather and high solar radiation, conditions which are possibly optimal for the activation of cercosporin (Daub and Ehrenshaft, 2000). The implications of fungal toxins and other abiotic factors in atypical epidemic processes have been recognized by Vanderplank (1984) and others (Apoga et al., 2002; Liljeroth, 1994, Kurppa, 1985; Ludwig, 1957). However, despite the limited predictive capacity, even of the best models generated, corresponding to Los Altos region and the South (R2 adj 0.51-0.60), some consistent analytical trends were observed: 1). Identification of two disease induction periods, the most important one being on January-April, possibly due to the most ideal conditions for the development of the primary infection with limited toxin effect (Ángeles-Espino et al., 2016). 2). Selection of a LAG period of 2 and 12 weeks that could estimate the incubation period and latency of the fungus, respectively. In Pseudocercospora opuntiae, a fungus with similar epidemic behavior (Hernández-Sánchez et al., 2014), a latency period of 14 weeks is reported (Quezada-Salinas et al., 2013). 3). The inclusion of cumulative favorable hours (HFav) regarding the infection of the fungus suggests that this indicator can be integrated into SIVEA (www.sivea.org.mx) through an algorithm that automates its calculation to represent an indicator of risk or inductance. This indicator could activate the monitoring of diseased plants at parcel and regional level for their early elimination, a practice that agave producers already undertake on an observational basis. The elimination of damaged plants, assisted by HFav with emphasis on inductive periods (VI i ), can be successful considering that the disease has a strong contagion restriction, an idea reinforced by the absence of spore capture in the impact and deposition devices, limited to a maximum of 1-4 plants in initial to advanced foci. In this context, the use of drones can be a promising strategy for the surveillance of early foci at parcel level (Figure 3), for both leading producers and companies, as well as for personnel from the Campaign against Regulated Pests of the Agave (www. sivea.org.mx).
Table 4. Stochastic models selected to forecast in two inductance windows, VI 1 (January-April) and VI 2 (June-October), the absolute increase of the summatory diseased plants (Y 2 ) of gray spot of blue agave in three agave regions of Jalisco 2016-2017.
| Región | Modelos X | F | C(p)Y | VIF | R2 adj Z |
|---|---|---|---|---|---|
| Altos /VI1 | Y2= 1.31(HFav12) | <.0001 | 8.84 | 2.04 | 0.47 |
| Altos / VI1 | Y2= 0.8(HFav2) | <.0001 | 0.03 | 1.00 | 0.51 |
| Altos / VI1 | Y2 = 0.95(HFav12) + 0.25 (HRprom12) | <.0001 | 2.00 | 2.04 | 0.50 |
| Altos /VI2 | Y2 = 0.0.005(HFav12) + 0.17 (HRprom12) | <.0001 | 2.00 | 2.54 | 0.23 |
| Sur / VI1 | Y2 = -0.04(HFav12) + 0.25(HRprom12) | <.0001 | 2.00 | 4.75 | 0.60 |
| Sur / VI1 | Y2 = 0.04(HRprom2) | <.0001 | 6.46 | 4.00 | 0.57 |
| Sur / VI2 | Y2 = 0.002(HFav12) + 0.02(HRprom12) | <.0001 | 2.00 | 3.67 | 0.31 |
| Sur / VI2 | Y2 = 0.004(HFav2) | <.0001 | 1.04 | 1.00 | 0.32 |
| Valles/ VI1 | Y2 = -0.006(HFav12) + 0.01(HRprom12) | 0.0003 | 2.00 | 3.67 | 0.32 |
| Valles/ VI1 | Y2 = -0.003(HFav2) + 0.008(HRprom2) | <.0001 | 2.00 | 3.25 | 0.31 |
| Valles/ VI2 | Y2 = -0.001(HFav12) + 0.02(Hprom12) | <.0001 | 2.00 | 4.15 | 0.32 |
| Valles/VI2 | Y2= -0.001(HFav2) + 0.014(Hprom2) | <.0001 | 2.00 | 5.93 | 0.29 |
xHRprom2,12=porcentaje de humedad relativa promedio semanal, HFav2,12= horas favorables acumuladas por una semana y desfasadas 2 o 12 semanas a partir de la evaluación de Y 2 / HRprom2,12 = percentage of weekly relative humidity, HFav2,12 = favorable hours week accumulated and lag-2 or lag-12 weeks from the evaluation of Y 2 .
YEstadísticos de bondad de ajuste: Cp-Mallow. VIF=Factor de inflación de la varianza. R2 adj=Coeficiente de regresión ajustado / Statistics of goodness of fit: Cp-Mallow. VIF = Variance inflation factor. R2 adj = Adjusted regression coefficient.

Figure 5 Epidemic curves of the sum of the number of diseased blue-agave plants with gray spot in 8, 3 and 3 monitoring plots for Los Altos, South and Valleys, respectively (lines). Accumulated number per week of favorable hours for C. agavicola infection obtained from March 2016 to December 2017 (bars). A) Epidemic inductivity window corresponding to January-April 2017 period (VI1). B) Epidemic inductivity window corresponding to Jun-Oct 2017 period (VI2).
Finally, in spite of the low parasitic fitness and epidemic potential of C. agavicola, the estimation of the productive impact at commercial level (6 years) can be significant at regional level under the scenario of the epidemic rates found in this investigation, 84 % of affected plots after 3 years and the absence of sanitary jimas that reduce the inoculum load. Thus, at the average price/kilo 2018 of 24 pesos MXN and pineapples / 50 kg, regional losses go from 2,058,187,075 MXN (98.01 MDD) to 4,985,330 MXN (237 thousand USD). At the level of one hectare under the same assumptions, the losses can range from 915,448 MXN to 124,500 MXN, respectively. For an industry that depends on medium-term productive inventories; growing exports of tequila, ranking in 2018 in fourth place on capturing agricultural divisions parasitic fitness and epidemic potential; competition with the agave insulin industry and the conversion of properties to the cultivation of berries make sanitary and productive efficiency imperative.
Conclusions
This work constitutes the first regional epidemiological study in Jalisco of Cercospora agavicola, the causal agent of the gray spot in blue agave (Agave tequilana). The regional epidemic inductivity of C. agavicola was heterogeneous with a greater risk for at least nine municipalities of Los Altos. However, all parameters, indicators and estimated variables consistently demonstrated the low epidemic potential of C. agavicola. Therefore a limited predictive capacity was found even with the best models generated (R2 adj 0.51-0.60). The cumulative favorable hours variable (HFav) with respect to the infection of the fungus was consistent among the best models, which suggests that this indicator could be integrated into SIVEA (www.sivea.org.mx) for preventive and control purposes. It is necessary to strengthen the understanding of the biology of the fungus with an emphasis on pathogenesis, dispersion, inoculum charge, and the effect of cercosporin. In spite of the low parasitic fitness of C. agavicola, the regional losses can range between 98.01 MDD and 237 thousand US dollars.
Acknowledgments
The first author thanks COLPOS and CONACYT for the scholarship for master’s studies. To LANREF for its unconditional support in the development of the project. To Miranda Mora Gutiérrez for the English translation.
REFERENCES
Apoga D, Åkesson H, Jansson HB, Odham G. 2002. Relationship between production of the phytotoxin prehelminthosporol and virulence in isolates of the plant pathogenic fungus Bipolaris sorokiniana. European Journal of Plant Pathology 108: 519-526. https://doi.org/10.1023/A:1019976403391 [ Links ]
Acevedo-Sánchez G, Santana-Peñaloza B, López-Bautista V, Martínez-Bustamante V, Coria-Contreras J, Mendoza-Ramos C, Jiménez-González L y Mora-Aguilera G. 2017. Criterios epidemiológicos para implementar una red de monitoreo de enfermedades causadas por Fusarium spp. en regiones agaveras de Jalisco. Revista Mexicana de Fitopatología 35(S): 176-177. http://rmf.smf.org.mx/suplemento/Suplemento352017.html [ Links ]
Ángeles-Espino A, Virgen-Calleros G, Valencia-Botín J, Ramírez-Serrano C, Paredes-Gutiérrez L y Hurtado de la Peña S. 2016. Evaluación no destructiva de la patogenicidad de Cercospora agavicola en vitroplántulas de agave azul tequilero irradiadas con rayos gamma Co60. Acta Universitaria 26(6): 3-10. doi: 10.15174/au.2016.1121 [ Links ]
Ayala-Escobar V, Yañez-Morales M, Braun U, Groenewald JZ and Crous PW. 2005. Cercospora agavicola a new foliar pathogen of Agave tequilana var. azul from Mexico. Mycotaxon 93:115-121. https://www.researchgate.net/publication/25481243 [ Links ]
Carmona M, Moschini RC, Cazenave G y Sautua F. 2010. Relación entre la precipitación registrada en estados reproductivos de la soja y la severidad de Septoria glycines y Cercospora kikuchii. Tropical Plant Pathology 35:71-78. http://www.scielo.br/scielo.php?pid=S1982-56762010000200001&script=sci_abstract&tlng=es [ Links ]
Campbell CL and Madden LV. 1990. Introduction to Plant Disease Epidemiology. John Wiley and Sons. New York, USA. 532 p. [ Links ]
Chuang TY. and Jeger MJ. 1987. Predicting the rate of development of black sigatoka (Mycosphaerella fijiensis var. difformis) disease in southern Taiwan. Phytopathology 77: 1542-1547. [ Links ]
Coakley SM, McDaniel LR and Shaner G. 1985. Model for predicting severity of Septoria tritici blotch on winter wheat. Phytopathology 75: 1245-1251. [ Links ]
Daud ME and Ehrenshaft M. 2000. The photoactivated Cercospora toxin cercosporin: Contributions to plant disease and fundamental biology. Annual Review of Phytopathology 38: 461-490. doi.org/10.1146/annurev.phyto.38.1.461. [ Links ]
Franco-Navarro F y Zavaleta-Mejía E. 2001. Estado actual del conocimiento acerca del modo de acción de las toxinas no selectivas. Revista Mexicana de Fitopatología 19(2): 237-244 [ Links ]
Guzmán-Hernández E, Flores-Colorado OE, Acevedo-Sánchez G, Mora-Aguilera G, López-Javier MA y González-Gómez R. 2017. APPS como herramientas de soporte epidemiológico aplicado a sistemas regionales de vigilancia epidemiológica. Revista Mexicana de Fitopatología 35(S): 178-179. http://rmf.smf.org.mx/suplemento/Suplemento352017.html [ Links ]
Hernández-Sánchez E, Mora-Aguilera G, Tlalpal-Bolaños B, Rodríguez-Leyva E y Alvarado-Rosales D. 2014. Effect of initial disease intensity of cactus black spot (Opuntia ficus-indica) in temporal and spatial characterization. Mexican Journal of Phytopathology 32(2): 132-146. http://rmf.smf.org.mx/Vol3222014/AR/32-2_05.pdf [ Links ]
Jens AE, Daub ME and Upchurch RG. 1989. Regulation of cercosporin accumulation in culture by medium and temperature manipulation. Phytopathology 79: 213-219. DOI: 10.1094/Phyto-79-213. [ Links ]
Jiménez-González LR, Mendoza-Ramos C, Santana-Peñaloza B, Coria-Contreras J, Delgado-Mora F, Acevedo-Sánchez G, Guzmán-Hernández E y Mora-Aguilera G. 2017. Escala logarítmica diagramática de severidad para medición de pudrición seca del cogollo, marchitez y mancha gris del agave azul. Revista Mexicana de Fitopatología 35(S): 177. http://rmf.smf.org.mx/suplemento/Suplemento352017.html [ Links ]
Kurppa A. 1985. Reaction of spring barley cultivars grown in Finland to soil-borne infection by Bipolaris sorokiniana and to its toxic metabolites. Journal of Agricultural Science in Finland 57: 85-96. file:///C:/Users/Editor%20en%20Jefe%20-%20RMF/Downloads/72189-Article%20Text-96272-1-10-20180618.pdf [ Links ]
Liljeroth E, Franzon-Almgren I, and Gustafsson M. 1994. Effect of prehelminthosporol, a phytotoxin produced by Bipolaris sorokiniana, on barley roots. Canadian Journal of Botany 72: 558-563. https://doi.org/10.1139/b94-074 [ Links ]
Ludwig RA. 1957. Toxin production by Helminthosporium sativum and its significance in disease development. Canadian Journal of Botany 35: 291-304. https://doi.org/10.1139/b57-026 [ Links ]
Mora-Aguilera G y Acevedo-Sánchez G. 2016. Desarrollo de REG-NCafé v1.0 para determinar n-sitios de monitoreo-muestreo regional de roya del cafeto en México usando criterios epidemiológicos ponderados. Acta del 49° Congresso Brasileiro de Fitopatologia; 29 ago - 01 sep; Alagoas, Maceio, Brasil. [ Links ]
Mora-Aguilera G, Acevedo-Sánchez G, Coria-Contreras J, González-Gómez R, López-Buenfíl A y Javier-López MA. 2015. Alertas tempranas regionales para manejo de focos de roya del cafeto en México. Revista Mexicana de Fitopatología 33(S): 62. http://rmf.smf.org.mx/suplemento/Suplemento332015.html [ Links ]
Mora-Aguilera G, Coria-Contreras J, Flores-Sánchez J, Domínguez-Monje S, Acevedo-Sánchez G, Aguilar-Pérez L, Martínez-Bolaños M y Guzmán-Deheza A. 2014. Desarrollo y validación de una trampa pasiva para monitoreo de esporas de Hemileia vastatrix. Revista Mexicana de Fitopatología 32(S): 83. http://rmf.smf.org.mx/suplemento/Suplemento322014.html [ Links ]
Mora-Aguilera G, Nieto AD, Campbell CL, Téliz D, and García E. 1996. Multivariate comparison of papaya ringspot epidemics. Phytopathology 86:70-78. https://www.apsnet.org/publications/phytopathology/backissues/Documents/1996Articles/Phyto86n01_70.pdf [ Links ]
Mora-Aguilera G, Téliz D, Nieto D, and Campbell CL. 1993. Development and validation of a prediction model for papaya ringspot in Veracruz, México. Plant Disease 77:1205-1211. https://www.apsnet.org/publications/phytopathology/backissues/Documents/1996Articles/Phyto86n01_70.pdf [ Links ]
Quezada-Salinas A, Sandoval-Islas JS, Alvarado-Rosales D y Moreno-Velázquez, M. 2013. Histopatología y patogénesis de Pseudocercospora opuntiae en nopal. Rev. Mex. Micología 38: 9-18. http://www.scielo.org.mx/scielo.php?script=sci_arttext&pid=S0187-31802013000200003&lng=es&tlng=es. [ Links ]
Rubio CR. 2007. Enfermedades del cultivo de agave. Pp. 170-195. Conocimiento y prácticas agronómicas para la producción de Agave tequilana Weber en la zona de Denominación de Origen del Tequila. Rulfo VFO (ed.). Libro Técnico 4. INIFAP. Tepatitlán de Morelos, Jalisco, México. [ Links ]
SIAP. 2015 y 2018. Servicio de Información Agrícola y Pesquera. SAGARPA. https://nube.siap.gob.mx/cierreagricola/ (consultado enero 2015 y abril 2018). [ Links ]
Sambrook JF and Russell DW (Eds). 2001. Molecular Cloning: A Laboratory Manual 3ª Ed. Cold Spring Harbor Laboratory Press 2100p. https://www.cshlpress.com/pdf/sample/2013/MC4/MC4FM.pdf [ Links ]
Santana-Peñaloza B, Acevedo-Sánchez G, Coria-Contreras J, Mora-Aguilera G, González-Gómez R y López-Buenfil A. 2015. CALCULA-HF V.1.0: Estimación de horas favorables de inductividad epidémica debido a la germinación de uredosporas de Hemileia vastatrix. Revista Mexicana de Fitopatología 33(S): 117. http://rmf.smf.org.mx/suplemento/Suplemento332015.html [ Links ]
SENASICA. 2017. Servicio Nacional de Sanidad, Inocuidad y Calidad Agroalimentaria. Manual operativo de la campaña contra plagas reglamentadas del agave. Dirección de Protección Fitosanitaria. Clave: MOP-DPF-PRAV. http://www.sivea.org.mx/ [ Links ]
Vanderplank JE. 1984. Disease Resistance in Plants. 2ed. Academic Press Inc. London. 208p. [ Links ]
Valencia BA. 2011. Evolución histórica y situación actual de la mancha gris en el cultivo del Agave azul tequilero. In: 1er Foro de discusión fitosanitaria en el cultivo del agave azul tequilero integrando esfuerzos para impulsar bienestar en el sector. 31 de may-01 jun Guadalajara, Jalisco, México. https://www.crt.org.mx/images/documentos/MEMORIA1erFORODEDISCUSIONFITOSANITARIA%28FINAL%29.pdf [ Links ]
White TJ, Brüns T, Lee S, Taylor J, Innis A, Gelfand HD and Sninsky J. 1990. Amplification and direct sequencing of fungal ribosomal RNA genes for phylogenetics. Pp. 315-322 In: PCR Protocols: A Guide to Methods and Applications. Innis MA, Gelfand DH, Sninsky JJ, and White TJ. (Eds). Academic Press, Inc. New York. [ Links ]
Received: September 29, 2018; Accepted: December 21, 2018
 Este es un artículo publicado en acceso abierto bajo una licencia
Creative Commons
Este es un artículo publicado en acceso abierto bajo una licencia
Creative Commons
