


 texto en
  Inglés (pdf)
 Artículo en XML
 Referencias del artículo
 Enviar artículo por email
 Citado por SciELO
  Similares en
SciELO
Similares en
SciELO 
 Permalink
Roselle (Hibiscus sabdariffa L.) is an important crop for Mexico, as annually around 19,000 hectares are used for its cultivation. Guerrero is the main state producer nationwide where Ayutla and Tecoanapa municipalities provide more than 50 % of the state production (SIAP, 2014). Spotted leaves and calyces induced by Corynespora cassiicola, is currently considered the main limiting factor for the production of this crop, as there have been incidence in the order of 100 % (Ortega-Acosta et al., 2015). The symptoms in leaves consist of circular to irregular spots with straw-colored center, black borders and purple rings, which coalesce into large necrotic lesions. In calyces, initially stage occur sunken spots necrotic of circular or irregular shape, and in advanced stages of infection originated blight (Ortega-Acosta et al., 2015). Despite the importance of this disease, currently there is not a standardized method to assess its severity, which is a fundamental parameter in epidemiological studies and evaluation of management practices, among others. These studies require simple and fast methods with the same standards that can be used under different conditions; thus, they must be accurate, precise, and reproducible. Diagrammatic scales reduce subjectivity and measure accurately and reliably the estimates of the severity of disease (Tovar-Soto et al., 2002; Martins et al., 2004; Belan et al., 2014). These scales must consider representative symptoms of the disease, as well as the maximum and minimum values in field (Tovar-Soto et al., 2002). Furthermore, according to Capucho et al. (2011), the diagrammatic scales must be subject to validation before their practical use in order to improve the accuracy and precision of the severity assessments. Current trend is the use of robust evaluation systems, in them is evaluated the accuracy, precision, reproducibility and other attributes. These are important due to the participation of group of evaluators in field, essential epidemiological surveillance systems (Mora-Aguilera et al., 2014). Based on the above, the objective of this study was to develop and validate two diagrammatic logarithmic scales in order to assess the severity of spotted leaves and calyces of roselle.
Materials and methods
Development of scales
In the municipalities of Ayutla and Tecoanapa, Guerrero, in based to climatic station (12012) situated at 365 m.a.s.l, these characterized by presented average annual temperature and precipitation of 27 °C and 1519 mm respectively (SMN, 2016). From August to December 2013, in commercial plantations of roselle cv. “Criollo” naturally infected by Corynespora cassiicola, 200 leaves and 200 calyces were collected with different levels of severity of spotted (Tovar-Soto et al., 2002; Capucho et al., 2011). Afterwards, 50 leaves and 50 calyces representative of different ranges of severity were visually selected (Belan et al., 2014). The selected leaves and calyces were digitally photographed and with the use of the GIMP® ver. 2.0 software, the background of each image was removed in order to facilitate the quantification of affected area. With the use of the Image Tool 3.0 (UTHSCSA, 2002) software, the total area of each leaf or calyx was quantified, as well as the damaged area (necrotic tissue), then, the percentage of actual severity of the disease was obtained by using the formula: severity = (diseased area / total image area) * 100 (Nutter Jr. et al., 2006). After obtaining the real levels of severity for leaves and calyces, six classes were defined, then the maximum level of severity obtained from leaves and calyces was introduced into the 2LOG program (Osada-Velázquez and Mora-Aguilera, 1997) in order to obtain severity ranges and the midpoint (Tovar-Soto et al., 2002).
Validation of the scales
In order to validate the scales, 50 leaves and 50 calyces of roselle representative of the different levels of spotted severity were used (Belan et al., 2014). The images were inserted randomly into individual slides to be viewed in Microsoft® PowerPoint® 2010, and they were presented to eight evaluators without experience in the quantification of plant diseases (Celoto and Papa, 2010), and whom conducted three evaluations for leaves and calyces. The first evaluation was made without scales and the two remaining were conducted with scales 7 and 14 days after the first evaluation by the same evaluators (Belan et al., 2014).
In order to quantify the accuracy of the evaluators in the severity assessments, these were compared with the actual severity values obtained electronically, by a simple linear regression, to verify the following set of hypotheses: for interceptor Ho: b0=0 versus H1: b010 and for the slope Ho: b1=1 versus H1: b111. The evaluation of both sets of hypotheses was performed with a significance level of 5 %. The estimated values of the slope that are significantly different from 1, indicate overestimation (>1) or underestimation (<1) at all levels of disease severity. While if the intercept estimated values are significantly different from 0, they indicate overestimation (>0) or underestimation (<0) of the actual severity of the disease, at low severity values (Nutter Jr. and Schultz, 1995).
In addition, the accuracy of the estimates was determined by the coefficient of determination (r2) of the linear regression, and the absolute errors which are defined as the difference between the estimated severity by evaluators and the actual severity obtained electronically, both in leaves and calyces were graphed. The reproducibility of the scales was assessed by using the coefficient of determination (r2) of the linear regression among the severities estimated by the evaluators, combined in pairs (Nutter Jr. and Schultz, 1995).
Data were tabulated in Microsoft® Excel 2010® software, and the statistical analyzes were performed with SAS® program ver. 9.0 (SAS Institute, 2002).
Results
Development of scales
Roselle calyces and leaves under natural conditions of infection collected in field, showed leaves and healthy calyces asymptomatic (0 %), and as values of minimum severity of 0.2 and 2.8 in leaves and calyces respectively, and maximum value of 69.9 % in leaves and over 85 % in calyces.
Based on the percentages of the damaged area of the 50 leaves and 50 calyces selected, six classes of severity were defined; the range and midpoints of each class (0, 1, 2, 3, 4 and 5) were expressed in percentage of the affected area as follows: for leaves: 0=0, 1=(>0- 2 - 4), 2=(>4-7-12), 3=(>12-19-29), 4 (>29-42-57) and 5=(>57-70-≤100); in calyces: 0=0, 1=(>0-3-5), 2=(>5-10-18), 3=(>18-30-46), 4=(>46-63-77) and 5=(>77-87-≤100) (Figures 1A and 1B).

Validation of the scales
In general, the accuracy of evaluations of spotted leaves and calyces was high with or without the use of scales (Tables 1 and 2). Without the use of scales, r2 values ranged from 0.55 to 0.92 with a 0.79 mean and 0.63 to 0.89 with a 0.80 mean for spotted leaves and calyces, respectively.
Table 1. Intercept (b0), slope of the line (b1) and coefficient of determination (r2) of the equation of the linear regression of the visual estimates of spotted leaves severity of roselle (Hibiscus sabdariffa), carried out with and without diagrammatic scale, compared to the actual percentages of affected area.
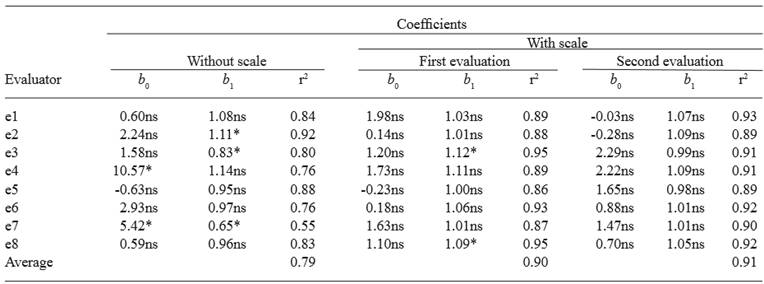
ns= Not significant
* Situation where the null hypothesis (b0=0 or b1=1) was rejected by the t-test (P=0.05)
Table 2. Intercept (b0), slope of the line (b1) and coefficient of determination (r2) of the equation of linear regression of the visual estimates of spotted calyces severity of roselle (Hibiscus sabdariffa), carried out with and without diagrammatic scale, compared to the actual percentages of affected area.
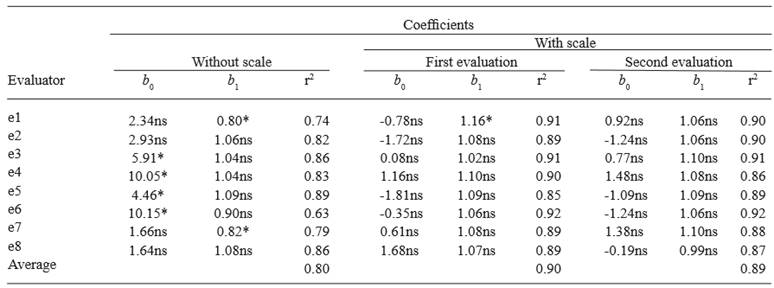
ns= Not significant
* Situation where the null hypothesis (b0=0 or b1=1) was rejected by the t-test (P=0.05)
With the use of scales, r2 values ranged from 0.86 to 0.95 with a 0.90 mean and 0.89 to 0.93 with a 0.91 mean for the first and second evaluations of spotted leaves, respectively. For calyces, r2 values were 0.85 to 0.92 with a 0.90 mean and 0.86 to 0.92 with a 0.89 mean for the first and second evaluations, respectively (Tables 1 and 2). These results show that the estimates were accurate when diagrammatic scales were used.
According to the results of the linear regression, without the use of the scales, the values of the intercept for leaves were significantly different from 0 in two evaluators (25 %), whereas for the slope were statistically different from 1 in three evaluators (37.5 %). In calyces, the intercept values were significantly different from 0 in four evaluators (50 %), whereas for the slope they were statistically different from 1 in two evaluators (25 %). In absolute terms for the intercept, in leaves, five evaluators overestimated (e2, e3, e4, e6 and e7) and three of them underestimated (e1, e5 and e8). In calyces, all evaluators showed tendencies to overestimation. For the slope in absolute terms, in leaves, three evaluators overestimated (e1, e2 and e4) and five underestimated (e3, e5, e6, e7 and e8). While in calyces five evaluators overestimated (e2, e3, e4, e5 and e8) and three underestimated (e1, e6 and e7) (Tables 1 and 2).
On the other hand, with the use of scales a tendency to improve the accuracy of severity estimates, in leaves and calyces, was observed, the values of the intercept of all evaluators were not significantly different from 0 in the first and second evaluations in both cases (Tables 1 and 2). Additionally, in the case of leaves, the values of the slope of the linear regression were statistically different from 1 in two evaluators (25 %), whereas in the second evaluation, values statistically equal to 1 were obtained in all evaluators. In calyces, the slope of the line was statistically different from 1 in one evaluator (12.5 %), while in the second evaluation values non-statistically different from 1 were obtained in all the evaluators. These results show that there is a good precision with the use of the proposed scales to assess the severity of spotted leaves and calyces of roselle.
Moreover, in all cases, highest absolute errors were obtained without the use of scales. In leaves without scale, a range of 43.81 to -39.48 was obtained as maximum and minimum values respectively, whereas with the scales, an average range of 32.28 to -27.95 was obtained in both assessments. In calyces, without the scale a range of 47.13 to -63.45 was obtained, and when scales were used, the average range of the two evaluations was 31.46 to -27.88 (Figure 2). In the evaluations of leaves, without scale, 30.5% of the absolute errors were outside of -10 and +10, while in calyces values were 34.25 %. With the use of scales, these values were 21.75 % and 19.5%, and 23.75 % and 23.0 % for the first and second assessments of leaves and calyces, respectively.
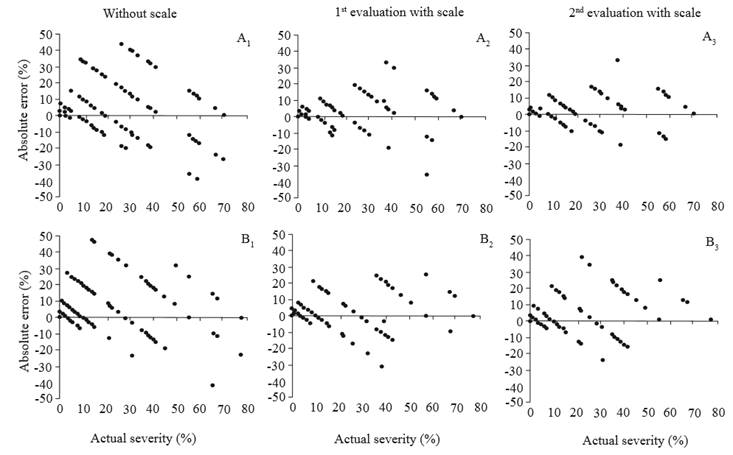
Figure 2. Distribution of residuals (estimated severity - actual severity) of the severity evaluations of spotted leaves and calyces of roselle. (A) Leaves: A1; without scale. A2; first evaluation with scale. A3; second evaluation with scale. (B) Calyces: B1; without scale. B2; first evaluation with scale. B3; second evaluation with scale.
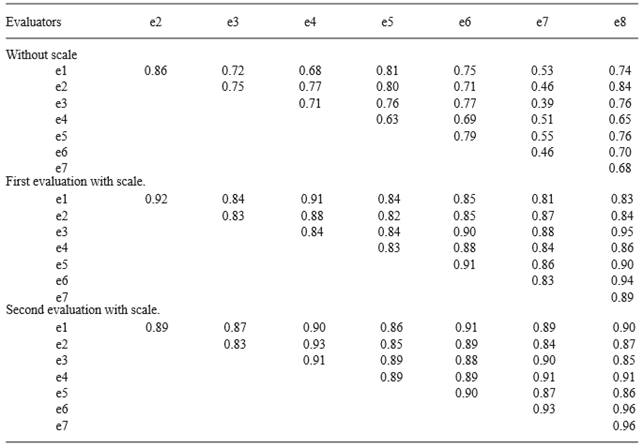
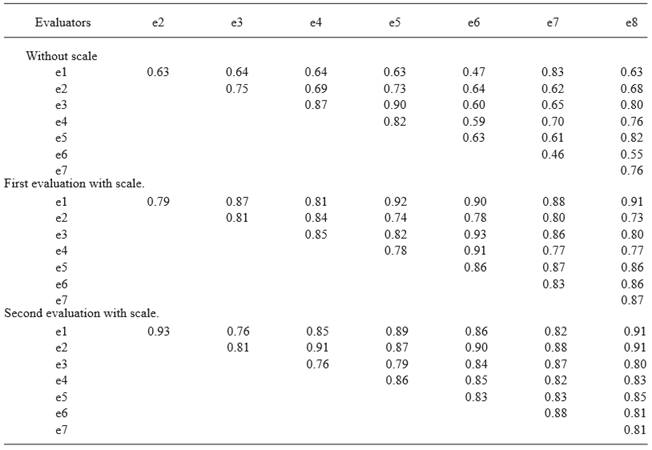
Diagrammatic scales were reproducible. In the case of leaves, without the use of the scale, the r2 values were 0.39 to 0.86 with 0.69 average. By using the scale, the r2 values were from 0.81 to 0.95 and from 0.83 to 0.96 in the first and second evaluations respectively (0.88 average), and they were >0.80 in 100 % of the combinations of evaluators (Table 3). In calyces, without the use of the scale, the r2 values were from 0.46 to 0.90, and 0.68 average. With scale, the r2 values were from 0.81 to 0.95, and from 0.83 to 0.96 in the first and second evaluations, respectively, (0.84 average) and they were ≥0.80 in 82.14 % of the cases (Table 4).
Table 3. Coefficient of determination (r2) of the linear regression equation related to the estimations of severity of spotted leaves of roselle (Hibiscus sabdariffa) induced by Corynespora cassiicola between evaluators in pairs, with and without diagrammatic scale.
Discussion
The diagrammatic scales improve the accuracy and precision of the evaluation of the severity of different diseases (Tovar-Soto et al., 2002; Barbosa et al., 2006) by allowing a better approach of the actual percentage of affected tissue. With the scales developed in this research, the precision and accuracy of the severity spotted leaves and calyces of roselle, was improved; this improvement has been observed in the severity assessment of other diseases (Capucho et al., 2011; Mengue et al., 2013). Besides, in the present study the evaluations were made by people inexperienced in this activity.
The r2 values obtained for the scales developed in leaves and calyces were ≥0.85, therefore, they are considered accurate (Belan et al., 2014). Godoy et al. (2006) evaluated the severity of soy rust induced by Phakopsora pachyrhizi with and without diagrammatic scale, and they determined that the r2 values improved when the scale was used. In addition, numerous authors have found that when scales are used to assess severity, the estimates are more accurate (Michereff et al., 2006).
In studies conducted in agricultural pathosystems, there have been tendencies to overestimation when no scales are used (Capucho et al., 2011; Belan et al., 2014). However, there have also been some cases of underestimation (Gomes et al., 2004). In the present study, when evaluations without scales were carried, there were tendencies to overestimation of 50 % in leaves, i.e. overestimates and underestimates were present in the same proportion. However, in calyces there were tendencies to overestimation in 81.25 % of the evaluators, without scales.
As for the evaluated hypotheses for the intercept (b0) and the slope (b1), they had more rejections in leaves and calyces when the scales were not used (Tables 1 and 2), similar results have been obtained by other authors (Michereff et al., 2006; Librelon et al., 2015). In the first evaluation with scale in leaves, two slope values were different from 1. In calyces, only one value was significantly different from 1. Additionally, in the second evaluations for leaves and calyces with scale, in any case, there were no significantly different values from 0 and 1 for the intercept and the slope, respectively. Therefore, the evaluations for leaves and calyces are considered accurate with the use of scales. In Mexico, actually using diagrammatic scales are part of regional system assessment coffee rust (Hemileia vastatrix), where 60 trained evaluators located in the coffee producing regions, is assessed weekly severity of the disease in field, through data platform assessments and the accuracy and precision are concentrated. This is part of robust evaluation system diseases, important epidemiological surveillance systems (Mora-Aguilera et al., 2014; DGSV-CNRF, 2016).
According to the criteria used in evaluations of scale, absolute errors values below 5 % are considered excellent, while up to 10 % are acceptable (Nutter Jr. and Schultz, 1995). In this study, a tendency to decrease the absolute errors was observed, especially in this range when the scales were used. In leaves with the use of the scales, the absolute error between -10 and +10 of the first and second evaluations was 79.38 % in average, and 76.63 % in calyces. While, without scales, were 69.5 % and 65.75 % for leaves and calyces, respectively. Similar results have been obtained by Celoto and Papa (2010) and Belan et al. (2014).
The reproducibility of the estimates was determined by the r2 value of the linear regression between evaluators in pairs with and without scale. Without the use of scales, a 0.69 r2 value was obtained for leaves, and 0.68 for calyces. The highest r2 values were obtained when using the scales (the average of the first and second evaluations was 0.88 and 0.84, in leaves and calyces, respectively), besides r2 values ≥0.80 were obtained in 100 % of the combinations between evaluators for leaves; while in evaluations for calyces, in more than 80 % of the cases the r2 values were ≥0.80. Similar results have been obtained in evaluations of diagrammatic scales for severity in other plant pathosystems (Belan et al., 2014). The above demonstrates that estimations with the scales developed in this research were reproducible.

