


Servicios Personalizados
Revista
Articulo
 texto en
  Inglés (pdf)
 Artículo en XML
 Referencias del artículo
 Enviar artículo por email
Indicadores
-
 Citado por SciELO
 -
 Accesos
Links relacionados
-
 Similares en
SciELO
Similares en
SciELO
Compartir

 Permalink
Revista mexicana de fitopatología
versión On-line ISSN 2007-8080versión impresa ISSN 0185-3309
Rev. mex. fitopatol vol.34 no.1 Texcoco 2016
https://doi.org/10.18781/R.MEX.FIT.1507.8
Scientific articles
Phenotypic characterization of Mycosphaerella fijiensis and its relation with sensitivity to fungicides in Colombia
1Corporación para Investigaciones Biológicas (CIB). Medellín, Colombia.
Controlling Mycosphaerella fijiensis increasingly requires the use of greater amounts of fungicides due to the resistance this pathogen has developed. A phenotypic characterization of M. fijiensis isolates in relation to their sensitivity to fungicides pyraclostrobin, epoxiconazole and tridemorph was carried out, with the intention of complementing existing methods of resistance monitoring. From symptomatic leaf tissue gathered from 12 banana farms in Colombia in 2013 and 2014, monosporic isolates were obtained and their population sensitivity and individual sensitivity were measured. This sensitivity was then compared with phenotypic traits expressed by each isolate. Results indicated that the traits associated with a greater sensitivity to pyraclostrobin were expressed in a greater number of individuals; in addition, the expression of these same features was observed as response to epoxiconazole. For tridemorph, an apparent shared domain was observed among individuals with traits associated to low and high sensitivities. A phenotypic characterization would help find if there are more or fewer individuals tolerant to an active ingredient and to define the time most suitable to apply this active ingredient without increasing the selection pressure on these individuals.
Key words: Pyraclostrobin; Epoxiconazole; Tridemorph; Selection pressure; Biological fitness
El control de Micosphaerella fijiensis, requiere cada vez la aplicación de una mayor cantidad de fungicidas debido a la resistencia que este patógeno ha desarrollado. Se realizó una caracterización fenotípica de aislamientos de M. fijiensis en relación a su sensibilidad a los fungicidas piraclostrobin, epoxiconazol y tridemorf esperando complementar los métodos actuales de monitoreo de resistencia. A partir de tejido foliar sintomático recolectado desde 12 fincas bananeras de Colombia durante los años 2013 y 2014, se obtuvo aislamientos monospóricos a los que se les cuantificó la sensibilidad poblacional e individual. Posteriormente esta sensibilidad se comparó con los rasgos fenotípicos que cada aislamiento expresó. Los resultados indicaron que los rasgos asociados con una mayor sensibilidad a piraclostrobin se expresaron en un mayor número de individuos, además se observó la expresión de estos mismos rasgos como respuesta a epoxiconazol. Para tridemorf se observó un aparente dominio compartido entre individuos con rasgos asociados a baja y alta sensibilidad. Una caracterización fenotípica permitiría conocer si existe un mayor o menor número de individuos tolerantes a un ingrediente activo y poder definir de esta forma el momento adecuado para aplicar este ingrediente activo sin aumentar la presión de selección sobre estos individuos.
Palabras clave: Piraclostrobin; Epoxiconazol; Tridemorf; Presión de selección; Eficacia biológica
Introduction
In Colombia, the banana tree is the most widely exported crop after coffee and flowers, yet these levels of export are largely affected by plant health problems (AUGURA, 2015). Amongst the pathogens that affect banana plantations, Mycosphaerella fijiensis Morelet, the agent that causes black sigatoka, is considered the most important and relevant disease on a global scale (FRAC, 2014). Due to the vulnerability of this crop to the disease, multiple fungicides are required to be used at relatively high frquencies with costs estimated at more than 30 % of the total of the production (Churchill, 2011).
In Colombia, as in all the other banana-exporting countries in which M. fijiensis has been reported, its control has come at a great cost, both economically and environmentally, since the necessary number of treatments has increased with time, due to the fast apprearance of resistance to the different fungicides that have been used (Pérez-Vicente, 2006; de Bellaire et al., 2010; FRAC, 2014).
Despite the resistance to fungicides is one of the main limitations in the control of this disease, it is worth noting that resistance is a direct cause of the application of fungicides, and is therefore inevitable (Grimmer et al., 2015). However, its intensity and impact on the final production costs can be controlled, and for this purpose, the most useful tool is considered to be a continuous monitoring of the evolution of the resistance, which helps identify the individuals resistant to the action of a fungicide, which, depending on their number, will determine if the resistance is being consolidated in the population (Van Den Bosch et al., 2011).
In M. fijiensis, the most reliable monitoring method to help identify the presence of resistant individuals consists of measuring the length of the germ tube of spores that germinate in the presence of the fungicide (FRAC, 2008). Nevertheless, in a population of M. fijiensis, different levels of inhibition of the germ tubes can be found for one concentration of the fungicide, and therefore some resistant individuals could go unnoticed (Pérez-Vicente, 2006).
The aim of this investigation was to compliment current methods for monitoring the resistance to the fungicides piraclostrobin, epoxiconazol, and tridemorf, by increasing the phenotypical variables that could be related to levels of sensitivity, which would give a greater degree of certainty by identifying the resistant individuals, thus defining the application of one of these active ingrediants beforehand if the pethogenic population is composed of a greater or lower number of individuals tolerant to those active ingredients, therefore avoiding a greater selection pressure on these individuals.
Materials and Methods
Experimental design
The experimental design was carried out taking the following into consideration:
1) Each finca, or property, was taken as an independent pathogenic population, the individuals of which were represented by the multiple spores or individuals produced in the infectious cycle of the disease. 2) If the phenotype is considered the expression of the genotype based on a given environment, and that in M. fijiensis´ environment, the pressure exerted by the fungicides favors the genotypes that help tolerate, to a greater or lesser degree, the action of these fungicides, it would be therefore expected that if there is a favored genotype, it would express itself through phenotypical traits, identifiable among individuals. 3) Previous evaluations have shown that different phenotypical traits repeat themselves between individuals, indicating a probable relationship between these traits. 4) The active ingredients evaluated have been used commerically on the field, therefore the population and the pathogenic individuals of this study have already undergone the selection pressure of these fungicides. Based on these conditions, in vitro experiments were designed to compare if the population sensitivity (property) or the individual sensitivity (monosporic) to piraclostrobin, epoxiconazol, and tridemorf, is related to the phenotypic behavior of each individual.
Phenotypic Variables Evaluated
A phenotypic characterization was performed which helped divide the isolates into two groups, one made up of quantitative variables, and the other, by six qualitative variables (Figure 1). The first group was composed of the phenotypic data, qualified quantitatively: length of the germ tube and biomass production (weight of the mycelium); the second group was composed of qualitative variables: 1) number of germ tubes (one germ tube only, two germ tubes of similar lengths or two unequal germ tubes in which one is less than half as long as the other. 2) Branching of the germ tube (germ tubes, branched or not branched. 3) Color of the mycelium (white, pink, or gray), 4) Morphology of the mycelium (circular division on the mycelium, parallel division on the mycelium, irregular division and indefinite division, 5) Presence of exudate (exudate present or absent, 6) Shape of the mycelium (ovoidal or undefined "amorphous").
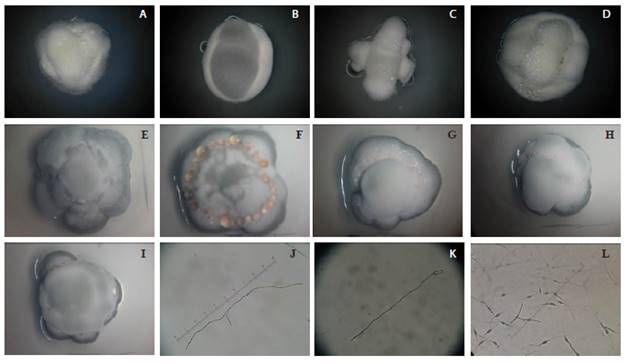
Figure 1 Qualitative phenotypic variables. From left to right: A) White, undefined morphology, with exudate, amorphous shape. B) Gray, parallel morphology, no exudate, oval-shaped. C) white, undefined morphology, no exudate, amorphous shape. D) white, parallel morphology, with exudate, oval-shaped. E) gray, circular morphology, no exudate, oval-shaped. F) pink, irregular morphology, with exudate, oval-shaped. G) pink, circular morphology, with exudate, oval-shaped. H) pink, parallel morphology, with exudate, oval-shaped. I) gray, undefined morphology, with exudate, oval-shaped. J) two germ tubes of similar length with ramifications. K) one germ tube, without ramifications. L) two germ tubes of similar length where one is less than half the length of the other, without ramifications.
Plant Material
Plant samples were used with symptoms of being in stage six of the disease (final stage of the disease, characterized by sexual recombination and the production of spores), obtained during 2013 and 2014, from 12 banana-producing properties in Colombia, seven of which are found in the Urabá region, and six in the Santa Marta region. Out of the 12 properties, 10 were commercial properties, and therefore the pathogenic population found there has been constantly placed under the pressure of fungicides, and they are expected to have lost, to a greater or lesser degree, their sensitivity, whereas in the two remaining properties (named as wild fincas) are not commercial properties, so the pathogenic populations found there have not undergone the pressure of fungicides and show high levels of sensitivity towards the different active ingredients.
Determining the Sensitivity of M. fijiensis Populations to Fungicides
Initially, the sensitivity was measured in each property using the protocol endorsed by FRAC (Fungicide Resistance Action Commitee) (FRAC, 2008) for the evaluation of systemic fungicides in M. fijiensis, called "Ascospore germ tube elongation," based on the measurement of the length of the germ tube, which helps value the level of population sensitivity from the average of individual measurements. Both the concentrations and the number of individuals or spores measured were fixed according to FRAC specifications. For fungicides QoI to which piraclostrobin belongs, three concentrations were evaluated for every property (0-1-10 mg/L) and 600 spores were measured for each property. For the two remaining active ingredients, the specifications given for SBI (Sterol Biosynthesis Inhibitors)-type synthesis were taken, to which both epoxiconazol and tridemorf belong. In this way, for epoxiconazol, for every finca 210 spores were evaluated in five concentrations (0-0.01-0.03-0.1 and 1 mg/L). For tridemorf, six concentrations were evaluated (0-0.1-0.3-1-3 and 10 mg/L) and 240 spores for every finca.
Monosporic Isolates
After establishing population sensitivity and from this setup, germinated spores were selected at random in the absence of the fungicide (0 mg/L), which were previously quantified for length, the existence of ramifications, and number of germ tubes. These spores were isolated using a light microscope and a glass capillary tube, and transferred to a PDA nutritional medium where they grew at room temperature (26±1 °C) for 40 days until a monospore culture was obtained. After this time, the color, morphology, the presence of an exudate, and the shape of the mycelia were determined. Next, and taking advantage of the compact and non-extended growth of M. fijiensis under in vitro conditions, the total mycelia were weighed using an analytic scale, and the biomass produced was quantified. A total of 123 monospore cultures was obtained, and comparisons were carried out on these.
Determining the Individual Sensitivity of M. fijiensis to Fungicides
Out of the 123 monospore cultures, those with the greatest differences in the length of the germ tube and weight of the mycelia were chosen (since the sensibility measurements were based on these traits) and a total of 41 monospore isolates was obtained; their individual sensitivity to the three active ingredients was quantified using spectrophotometric microtechnics (Table 1). This technique is also endorsed by FRAC, but not for M. fijiensis, since the absence of sexual sporulation of this pathogen in vitro implies that this evaluation must be performed on monosopre cultures or on a limited number of individuals that would not represent the population. In this way, this technique would not be useful for determining the sensitivity of a population, but it would be to determine the sensitivity of an individual from that population. This technique was based on the preparation, based on the mycelia of each one of the 41 monospore isolates, a suspension at a concentration of 104 mycelium fragments/ml, which was incubated for eight days in eight ELISA dishes with 96 pits. For each active ingredient, four concentrations were evaluated: piraclostrobin (0-0.1-1-20 mg/L); epoxiconazol (0-0.1-1 and 10 mg/L) and tridemorf (0-1-10 y 100 mg/L). These concentrations were fixed from previous evaluations in which the inhibition range was established for each active ingredient when this technique was used.
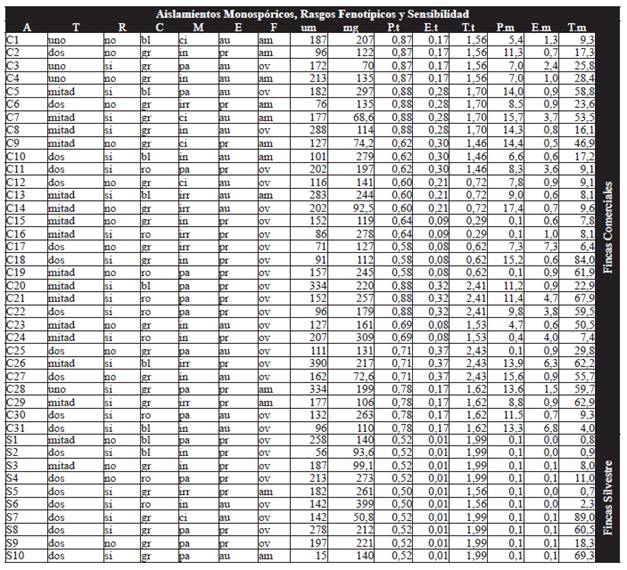
Table 1 Phenotypic traits for the 41 monospore isolates (31 from commercial properties and 10 from wild properties) which were measured for sensitivity via measurement of the germ tube and microtechnics. (A) Isolation. (T) Number of germ tubes. (R) Ramification. (C) Color (bl:white. ro: pink. gr: gray). (M) Morphology (ci: circular. pa: parallel. in: undefined. irr: irregular). (E) Exudate (au: absent. pr: present). (F) Shape(am: amorphous. ov: oval). (um) Length germ tube. (mg) Biomass weight. (P.t) IC50 piraclostrobin germ tube. (E.t) IC50 epoxiconazol germ tube. (T.t) IC50 tridemorf germ tube. (P.m) IC50 piraclostrobin microtechnics. (E.m) IC50 epoxiconazol microtechnics. (T.m) IC50 tridemorf microtechnics.
Quantification of Sensitivity
The parameter used to quantify the sensitivity, both at a population and an individual level, was the IC50 "half maximal inhibitory concentration", calculated from a linear regression of two points (Y = mX + b), where the points graphed were the concentrations above and below, between which would lie 50 % of inhibition and the resulting curve for each fungicide was represented in an Excel spreadsheet, along with the IC50 estimated. The estimated IC50 was the dose or concentration (X axis) produced by 50 % inhibition (Y axis) in the curve (Chinn, 1997).
Statistical Analysis
In order to establish if there were significant differences between the expression of the different phenotypical features, as well as between the expression of these ranges with individual or population sensitivity to the fungicides evaluated, variance analyses were carried out with 95 % confidence to compare between the factors that represent the quantitative variables: a) Length of the germ tube, b) Production of biomass, c) Population or individual sensitivity to each active ingredient (IC50). And the factors that represent the qualitative variables: a) Number of germ tubes, b) Branching of germ tube, c) Color of mycelium, d) Morphology of the mycelium, e) Presence of exudate, f) Shape of mycelium. Accepting the statistical significance as long as the P-value is less than 0.05 (Table 2). Likewise, multiple comparison tests within the factors were carried out using Fisher's minimum significant difference method (LSD) to define if there were significant differences between the averages obtained for each quantitative variable when compared to the presence of each trait that the qualitative variables represent (Table 3).
Tabla 2 P-value obtained from the variance analysis that compared quantitative variables (T.g: length germ tube; P.b: biomass production; In: individual sensitivity to fungicide; Po: population sensitivity to fungicide) and qualitative variables (y). And when comparing only between quantitative variables (z). From the moment the P-value was lower than 0,05 was there a statistical significance.
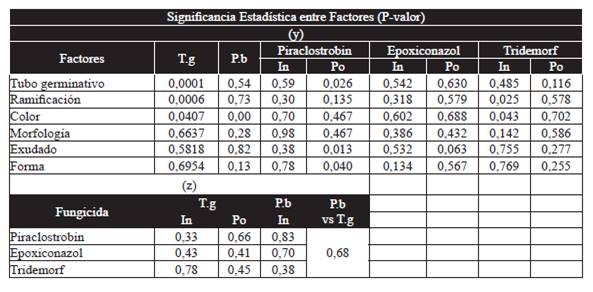
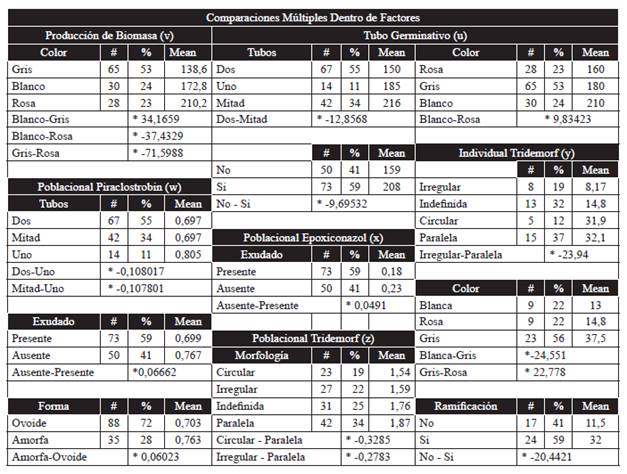
Table 3 The traits evaluated are shown, along with the number of individuals with each feature, its population percentage, the statistical average of the germ tube length in micrometers (u), the statistical average of the weight of the biomass in milligrams (v), the statistical average of the IC50 for the phenotypical traits related to the sensitivity of the population to piraclostrobin (w), epoxiconazol (x), tridemorf (z), and the individual sensitivity to tridemorf (y). (*) indicates significant difference when comparing factors.
Active Ingredients
The active ingredients evaluated (piraclostrobin, epoxiconazol, and tridemorf), were taken from products belonging to the company BASF Química S.A. and used in the banana industry under the commercial names of COMET (Piraclostrobin 250 g/L), OPUS (Epoxiconazol 75 g/L), CALIXIN (Tridemorf 750 g/L).
Results
Phenotypic Traits related to the Length of the Germ Tube
The variance analysis showed differences between factors for the number of germ tubes (Table 2y). In this way, within factors, when comparing averages, it was observed that spores that generated two germ tubes, but in which one reached less than half of the other's length, displayed a significant relation with germ tubes of greater length (X=216 um). However, when two tubes were presented with similar sizes, they related to a shorter length (X=150 um). Spores that only generated one germ tube were related to intermediate lengths and showed no significant differences with those spores with two germ tubes (X=185 um). The individuals that presented two similar-sized germ tubes, and therefore the shortest length, were the majority of the population, and represented 55 % of it, whereas those with greater lengths represented 34 % of the population (Table 3u). The existence of ramifications was another factor that presented significant differences between factors in relation to the length of the germ tube (Table 2y). Within the factors, and when comparing the averages, the appearance of these ramifications was significantly more related to longer germ tubes (X=208 um) than to shorter tubes (X=159 um). Individuals that presented ramifications and a greater length were the majority of the population, and accounted for 59 % (Table 3u). Germ tube length also displayed significant differences between factors with the mycelium color (Table 2y). Within the factors, and in the comparison of averages, it was observed that a greater length gave rise to a white mycelium (X=210 um), while a shorter length generated pink mycelia (X=160 um). No significant differences were observed when the mycelium obtained was gray (X=180 um). The gray mycelia related to medium-sized germ tube spores were the majority in the population, with 53 %. Meanwhile, the white mycelia related to a greater length accounted for 24 % of the population, a similar percentage to the 23 % of the pink mycelia related to a shorter length (Table 3u).
Phenotypic Traits Related to Biomass Production
There were significant differences between factors for the amount of biomass produced by each individual and the color of the mycelia (Table 2y). Within the factors, and in the comparison of the averages, individuals that weighed less corresponded to those colored gray (X=139 mg), white ones were related to a heavier weight than gray (X=173 mg), although lighter than pink (X=210 mg), which was the color related to a greater production of biomass. Proportional distribution indicated that 53 % of all individuals showed gray mycelia, and therefore lower weight, while 24 % presented white mycelia, and the remaining 23 % displayed pink mycelia and a higher weight (Table 3v).
Phenotypic Traits Related to Sensitivity to Fungicides
The level of sensibility to the evaluated fungicides was established using an IC50 found by spectrophotometric microtechnics from monospore crops that helped find a response for individuals, as well as an IC50 found from the average of the lengths reached by the germ tubes of a particular number of spores that helped find a response for the population.
Piraclostrobin
Individual Response. Among the factors, no significant differences were found between the sensitivity of an individual to piraclostrobin and the phenotypical characteristics evaluated (Table 2y).
Population Response: Among the factors there were significant differences for the level of population sensitivity to piraclostrobin and the number of germ tubes (Table 2y). Within the factos, and in the comparison of averages, spores with only one germ tube were found to be significantly more related to a population with a lower sensitivity to piraclostrobin (IC50=0,805) than spores with two germ tubes, the latter related to a more sensitive population, regardless of one of the tubes being less than half as long as the other (IC50=0,697). Proportional distribution indicated that 89 % of the population presented two germ tubes, and therefore a lower population IC50, whereas the remaining 11 % presented only one germ tube and a higher population IC50 (Table 3w). Also among the factors, significant differences were found with the production of exudate (Table 2y) and within the factors, comparing factors proved that isolated spores of a population with a lower IC50 (IC50= 0,699), and therefore a greater sensitivity to piraclostrobin, were significantly more related with the production of exudate in their mycelia, while the increase in the IC50 (IC50= 0,767) was related with no production of exudate. Proportional distribution indicated that 59 % of the population presented exudates, whereas the remaining 41 % did not (Table 3w). Among factors, the shape of the mycelium of the monosporic crop also displayed significant with the sensitivity of the population to piraclostrobin (Table 2y), and within the factors it was found, when comparing averages, that the spores from a population with a lower IC50 (IC50= 0,703) were significantly related with an oval shape in their mycelia, whereas if the population displayed a greater IC50 (IC50= 0,763) the remaining mycelium was more related to a lack of any particular shape (amorphous). Proportional distribution indicated that 72 % of the individuals presented an oval shape, and were therefore related to a greater sensitivity to piraclostrobin, while the remaining 28 % displayed no particular shape (Table 3w).
Epoxiconazol
Individual Response. Among the factors, no significant differences were found between the phenotypic characteristics evaluated and the sensitivity of the monospore individuals to epoxiconazol (Table 2y).
Population Response. Among the factors no significant differences were found (Table 2y), although within the factors and comparing averages, it was observed that population sensitivity to epoxiconazol displayed significant differences for the trait exudate production, since isolates from a more sensitive population to this active ingredient (IC50=0,18) displayed exudate, while less sensitive isolates did not (IC50=0,23). Proportional distribution indicated that 59 % of the population presented exudate, and therefore a higher sensitivity to epoxiconazol, while the remaining 41 % displayed no exudate (Table 3x).
Tridemorf
Individual response. Among the factors, significant differences were found for the existence of ramifications in the germ tube(s) (Table 2y). And within the factors, when comparing averages, it was observed that the presence of ramifications was significantly related to a lower sensitivity to tridemorf (IC50=32), while the absence of ramifications was related to a higher sensitivity (IC50=11,5). When analyzing the proportional distribution, it was found that individuals without ramifications were only a few in the population (41 %), while the individuals with ramifications and a lower sensitivity were the majority (59 %) (Table 3y). Among the factors, significant differences were also observed for the color of mycelia (Table 2y), and within the factors, when comparing averages, a lower sensitivity of the monospore culture to tridemorf (IC50=37,5) was noticed to be significantly related to a gray mycelium, whereas if its color is white (IC50=13) or pink (IC50=14,8) it relates to a higher sensitivity. When the proportional distribution was evaluated, grey isolates related to a lower sensitivity to tridemorph were found to be the majority and accounted for 56% of the population, while white and pink isolates were found at equal proportions of 22 % (Table 3y). Within the factors, when comparing the averages for the trait of morphology, it was noticed that if a monospore culture presented a mycelium with an irregular morphology, this individual would be significantly more related to a higher sensitivity (IC50=8,17), since in vitro it would require a lower concentration of tridemorf to achieve the same level of inhibition than a monospore culture with an undefined morphology (IC50=14,8), or circular (IC50=31,9) or parallel (IC50=32,1), the latter having the highest IC50. The proportional distribution showed that the parallel morphology related to a lower sensitivity to tridemorph was present in a higher percentage of individuals (37 %), followed by an undefined morphology (32 %) related to a higher yet intermediate sensitivity. The irregular morphology related to the highest sensitivity to tridemorph was found at a lower proportion (19 %), while a lower percentage of individuals (12 %) presented a circular morphology, characterized by having the second lowest levels of sensitivity, very close to those observed for the parallel morphology (Table 3y).
Population response. Among the factors there were no significant differences observed (Table 2y), although within the factors, when comparing averages, there were significant differences for the morphology of the mycelium. A population with a higher sensitivity to tridemorf was related to individuals with a circular (IC50=1,54) or irregular morphology (IC50=1,59), whereas a lower sensitivity to tridemorf was related to individuals with an undefined (IC50=1,76) or parallel morphology (IC50=1,87). In this case, proportional distribution showed that the parallel morphology related to a lower sensitivity was found in a greater proportion within the population (34%), followed by undefined (25%), irregular (22%), and circular morphologies (19%) (Table 3z).
Length of the Germ Tube and Biomass Production in Relation to Sensitivity to Fungicides
The length reached by the germ tube and the amount of biomass produced in vitro and in the absence of the fungicide did not display significant differences with the degree of sensitivity, acquired or inherent, of an individual or a population an individual belongs to, toward piraclostrobin, epoxiconazol, or tridemorf (Table 2z). In other words, a higher or lower IC50 had no relation with a longer or shorter length of the germ tube or production of biomass (Table 1).
Length of the Germ Tube in Relation to Biomass Production
In the absence of the fungicide, the length of the germ tube and the amounts of biomass were compared, and no significant differences were found between these two factors (Table 2z), that is to say, a greater or less elongation of the germ tube had no relation with the production of more or less mycelia (Table 1).
Discussion
When the results were analyzed for the predominant phenotypic traits in M. fijiensis populations in Colombia, it was found that the color of the mycelium was a trait that, although seemingly unrelated to fitness, it was related to representative traits such as the length of the germ tube and biomass production. The color gray was the trait that was present in the most individuals, that is, this would be a trait favored by selection, although the individuals with the highest biomass production or longer germ tubes were not of this color, that is, the gray individuals had increased their number beyond individuals with greater fitness. Therefore, there may be external pressures that would be selecting individuals of less fitness, and these pressures would be related to the action of fungicides.
The selection exerted by the fungicides would be differential according to the active ingredient and for piraclostrobin it would be causing the individuals with traits related to a higher sensitivity to be the majority (Table 3w), indicating that the individuals with greater opportunities of spreading would be sensitive to piraclostrobin. Alterations in the biological efficiency related to the resistance to QoI fungicides have been reported for other pathogenic fungi (Veloukas et al., 2014; Fernández-Ortuño et al., 2010; Ma, B. y Tredway 2013). Monitoring the time of these traits related to higher or lower sensitivity would help determine if piraclostrobin affects the fitness of M. fijiensis, and, should this be proven, it would indicate a low risk of this fungicide generating resistance, and not a high risk, as it is currently considered (FRAC, 2014).
For both piraclostrobin and epoxiconazol, sensitive individuals presented exudates, whereas less sensitive individuals did not, indicating a possible relation between mechanisms that generate the resistance to these two active ingredients. Should these results be proven, it would help determine if in M. fijiensis, as in other pathogenic fungi in plants, there is multiple "Multidrug" resistance (MDR) between fungicides QoI and DMI (Villani and Cox 2014; Kretschmer et al., 2009). Also, it would be a warning on the inconvenience of a spraying program based on the mixture of epoxiconazol and piraclostrobin due to the increase in the selection pressure on individuals tolerant to both active ingredients.
For tridemorf, the traits related to a lower sensitivity were found in a smaller percentage of the population, yet this did not mean that there was a decrease in sensitivity, since individuals from populations subjected to the pressure of fungicides (commercial properties) displayed less sensitivity than those from populations not subjected to the pressure of fungicides (wild properties) (Table 1). The explanation to these results may be related to observations on the morphology trait, where individuals related to a higher sensitivity added up to a similar population percentage to those with a lower sensitivity (Table 3y; z). These results would indicate that within the same population there would be different groups of individuals with variable levels of tolerance, in which no group would dominate in the population. This heterogeneity of sensitivities would imply the inexistence of loss in sensitivity, but it would also imply a constant presence of both sensitive and insensitive individuals.
Conclution
Individuals were identified that expressed phenotypic traits related to the level of tolerance to an active ingredient, and this level of tolerance would establish if individuals with a series of specific traits are a majority within a population or not. Therefore, a phenotypic characterization by way of monitoring would help establish when the best time would be to apply an active ingredient, depending on whether there is or not, in that moment, a greater or lower number of individuals with traits that express tolerance to that active ingredient.
Some phenotypic traits were found to be related, or in contrast, they were expressed differentially, according to the active ingredient, indicating that the phenotypic characterization could help establish which mixtures of fungicides that still belong to different families, would not lead to cross-resistance.
Acknowledgements
BASF Química staff in Colombia, Eberst de León and Julio Angulo, who have supported the investigation on resistance to fungicides and have granted access to the biological material. This investigation was carried out based on monitoring the sensitivity to fungicides in M. fijiensis that the Central Service Lab of the CIB has been carrying out since the year 2008.
REFERENCES
A. U. G. U. R. A. Asociación de Bananeros de Colombia, (2015). Coyuntura Bananera Colombiana 2014. Disponible en línea: http://www.augura.com.co/servicios-gremiales/informacion-economica/ [ Links ]
Chinn, B. (1997). Effectively Displaying Statistical Results in a High Volume Drug Research Environment Using SAS/GRAPH(r). In Proceedings of the Twenty-Second Annual SUGI Conference (pp. 819-823). Disponible en línea: http://www2.sas.com/proceedings/sugi22/INFOVIS/PAPER175.PDF [ Links ]
Churchill, A. C. (2011). Mycosphaerella fijiensis, the black leaf streak pathogen of banana: progress towards understanding pathogen biology and detection, disease development, and the challenges of control. Molecular plant pathology, 12 (4), 307-328. Doi: 10.1111/J.1364-3703.2010.00672.X [ Links ]
de Bellaire, L. D. L., Fouré, E., Abadie, C., & Carlier, J. (2010). Black Leaf Streak Disease is challenging the banana industry. Fruits, 65 (06), 327-342. http://dx.doi.org/10.1051/fruits/2010034 [ Links ]
Fernández-Ortuño, D., Torés, J. A., De Vicente, A., & Pérez-García, A. (2010). Mechanisms of resistance to QoI fungicides in phytopathogenic fungi. International Microbiology, 11 (1), 1-9. http://dx.doi.org/10.2436/20.1501.01.38 [ Links ]
FRAC, Fungicide Resistance Action Committee. Summary banana guidelines (2014). Annual meeting minutes. Disponible en línea: http://www.frac.info/working-group/banana-group/general-use-recommendations [ Links ]
FRAC, Fungicide Resistance Action Committee. Monitoring Methods (2008). Disponible en línea: Disponible en línea: http://www.frac.info/monitoring-methods (consulta, julio 2015). [ Links ]
Grimmer, M. K., van den Bosch, F., Powers, S. J., & Paveley, N. D. (2015). Fungicide resistance risk assessment based on traits associated with the rate of pathogen evolution. Pest management science, 71 (2), 207-215. http://dx.doi.org/10.1002/ps.3781 [ Links ]
Kretschmer, M., Leroch, M., Mosbach, A., Walker, A. S., Fillinger, S., Mernke, D., ... & Hahn, M. (2009). Fungicide-driven evolution and molecular basis of multidrug resistance in field populations of the grey mould fungus Botrytis cinerea. PLoS Pathogens, 5 (12), e1000696. http://dx.doi.org/10.1371/journal.ppat.1000696 [ Links ]
Ma, B., & Tredway, L. P. (2013). Induced overexpression of cytochrome P450 sterol 14α-demethylase gene (CYP51) correlates with sensitivity to demethylation inhibitors (DMIs) in Sclerotinia homoeocarpa. Pest management science, 69 (12), 1369-1378. http://dx.doi.org/10.1002/ps.3513 [ Links ]
Pérez Vicente, L. (2006). Manejo convencional y alternativo de la Sigatoka Negra en bananos: estado actual y perspectivas. Fitosanidad, 10 (1), 55-72. Disponible en línea: http://www.redalyc.org/articulo.oa?id=209116158009 [ Links ]
van den Bosch, F., Paveley, N., Shaw, M., Hobbelen, P., & Oliver, R. (2011). The dose rate debate: does the risk of fungicide resistance increase or decrease with dose?. Plant Pathology, 60 (4), 597-606. http://dx.doi.org/10.1111/j.1365-3059.2011.02439.x [ Links ]
Veloukas, T., Kalogeropoulou, P., Markoglou, A. N., & Karaoglanidis, G. S. (2014). Fitness and Competitive Ability of Botrytis cinerea Field Isolates with Dual Resistance to SDHI and QoI Fungicides, Associated with Several sdh B and the cyt b G143A Mutations. Phytopathology, 104 (4), 347-356. http://dx.doi.org/10.1094/PHYTO-07-13-0208-R [ Links ]
Villani, S. M., & Cox, K. D. (2014). Heteroplasmy of the cytochrome b Gene in Venturia inaequalis and Its Involvement in Quantitative and Practical Resistance to Trifloxystrobin. Phytopathology, 104 (9), 945-953. http://dx.doi.org/10.1094/PHYTO-06-13-0158-R [ Links ]
Received: August 05, 2015; Accepted: November 18, 2015
 Este es un artículo publicado en acceso abierto bajo una licencia Creative Commons
