


Servicios Personalizados
Revista
Articulo
 texto en
  Inglés (pdf)
 Artículo en XML
 Referencias del artículo
 Enviar artículo por email
Indicadores
-
 Citado por SciELO
 -
 Accesos
Links relacionados
-
 Similares en
SciELO
Similares en
SciELO
Compartir

 Permalink
Revista mexicana de fitopatología
versión On-line ISSN 2007-8080versión impresa ISSN 0185-3309
Rev. mex. fitopatol vol.33 no.1 Texcoco 2015
Phytopatological notes
Diagrammatic Scale Severity for Tar Spot Complex in Maize
1Instituto de Fitosanidad-Fitopatología, Colegio de Postgraduados, km 36.5 Carr. México-Texcoco, Montecillo, Texcoco, Edo. México, CP 56230, México
2Instituto de Fitosanidad-Fitopatología, Colegio de Postgraduados, km 36.5 Carr. México-Texcoco, Montecillo, Texcoco, Edo. México, CP 56230, México.
The tar spot complex of maize, induced by the fungi Phyllachora maydis and Monographella maydis, is a disease of economic importance in Mexico and Central America because it causes severe yield losses. Given the growing importance, standardized methods are required to quantify disease that allow for reproducible epidemiological methods. For this purpose a logarithmic scale of severity was developed with intervals and midpoints of 0(0-0), 3(1-6), 12(7-22), 38(23-55), 72(56-84), 91(85-95) and 98(96-100)% of the affected leaf area, analyzing accuracy, precision and reproducibility. The evaluation considered ten evaluators and 50 plants with different levels of severity, determined by the Image Tool 3.0 Software. The precision and accuracy was determined by a simple linear regression analysis between actual and estimated severity. All evaluators tended to overestimate the disease, and recorded values of the b1 coefficient statistically equal to 1 (P <0.01), so that the disease evaluation with the proposed scale gives values close to real results. High levels of accuracy were observed; r2 was comprised between the range of 0.71 and 0.91, indicating that the scale can be successfully implemented in the evaluation of the tar spot complex disease.
Key words: Phyllachora maydis ; Monographella maydis ; Zea mays
El complejo mancha de asfalto del maíz, inducido por los hongos Phyllachora maydis y Monographella maydis, es una enfermedad de importancia económica en México, debido a que provoca severas pérdidas en rendimiento. Dada su importancia se requieren métodos estandarizados de cuantificación de los daños ocasionados por la enfermedad, que permitan realizar estudios epidemiológicos reproducibles; con este propósito fue elaborada una escala logarítmica de severidad con los intervalos y punto medio de cada clase de 0(0-0), 3(1-6), 12(7-22), 38(23-55), 72(56-84), 91(85-95) y 98(96-100) % de área foliar afectada, analizándose su exactitud, precisión y reproducibilidad. La evaluación consideró a diez evaluadores y 50 plantas con distintos niveles de severidad, determinadas con el Software ImageTool 3.0. La precisión y exactitud se calculó mediante un análisis de regresión lineal, entre la severidad real y estimada. Todos los evaluadores mostraron una tendencia a sobreestimar la enfermedad; y registraron valores del coeficiente b1 estadísticamente igual a 1 (P<0.01), por lo que la evaluación del CMA con la escala propuesta arroja resultados cercanos a los valores reales. Se observaron buenos niveles de precisión, la r2 estuvo comprendida entre el rango 0.71 a 0.91; indicando que la escala puede ser implementada exitosamente en la evaluación de los daños de la enfermedad.
Palabras clave: Phyllachora maydis ; Monographella maydis ; Zea mays
The Tar Spot Complex (TSC), associated with the Phyllachora maydis Maubl and Monographella maydis Müller & Samuels fungi, is a disease that has turned into the main limiting factor for maize production (Zea mays L.) in a number of humid/sub-humid, tropical regions and transitional zones (Hock et al., 1989) in several regions of Mexico and Central America. The incidence of TSC causes severe yield losses and deteriorates the quality of the fodder; furthermore, it has the potential to entirely destroy parcels of land (Pereyda et al., 2009). In Mexico, the disease is considered potentially significant in around 800 thousand hectares distributed among the states of Michoacán, Puebla, Veracruz, Guerrero, Oaxaca and Chiapas (Gómez et al., 2013).
In the field, it has been observed that the maize is first infected by P. maydis, causing small black stains in the form of exalted carbonaceous scabs, that due to their appearance are denominated asphalt stains (Hock et al., 1989). Subsequently, a necrotic diameter is formed around each one of the lesions of P. maydis due to the secondary infection of M. maydis, originating the so called fish-eye symptom (Hock et al., 1992). From all the organisms associated with M. maydis, the one that causes foliar necrosis has the most devastating effect. Under favorable conditions, the foliage of the plant may completely dry out in less than eight days due to the fusion of the lesions of the two pathogenic organisms and due to the possible production of a toxin (Hock et al. 1995).
Given the increasing importance of the Tar Spot Complex, standardized methods for the quantification of the disease are required, methods that allow the conduction of accurate, precise, and reproducible epidemiological studies; understanding 'accuracy' as the proximity that an estimated value has to the real value, 'precision' as the variation or repeatability associated with an estimation, and 'reproducibility' as the absence of change in the estimations when several evaluators quantify the same characteristics (Nascimiento et al., 2005).
Among the methods of measurement for the intensity of a disease, the use of diagrammatic logarithmic scales is the most widely used. These scales consist in the representation of a series of plants or parts of plants that show the symptoms of a disease in varying degrees of severity (Nascimiento et al., 2005) and are based on the Weber-Fechner law which states that the visual acuity of the damage is proportional to the stimulus logarithm up until a 50% severity, and from this value on, the relation is inversely proportional to the stimulus logarithm caused by the quantity of remaining healthy tissue (Mora et al., 2000).
Despite the increasing importance of TSC in maize and the resulting need to carry out epidemiological or control studies, there is no standardized quantification method of the disease that provides easily reproducible results among investigators or institutions; therefore, the objective of this investigation was to design and validate a diagrammatic logarithmic severity scale for the maize - Phyllachora maydis and Monographella maydis - pathosystem that allows the evaluation of the damage caused by the disease in fields, analyzing the accuracy, precision and reproducible values generated with its use.
Design of the diagrammatic logarithmic scale. The methodology proposed by Mora et al. (2000) was employed, utilizing 50 leaves with a wide range of severity levels, originating from different hybrids with different genetic basis, which allowed the representation of different severity levels.
The photographic documentation was obtained from the parcels in the experimental station Agua Fría CIMMYT, Puebla and from communities in Chilpancingo, Guerrero in 2013. The total foliar area and the total diseased area of each digitalized image was determined through the Image Tool 3.0 software; the ratio of the healthy and diseased tissue allowed the calculation of the severity of the disease. The logarithmic scale was generated through the 2-Log V1.0 program, proposed by Mora et al. (2000).
Validation of the diagrammatic scale. A sequence of 50 photographs of leaves and maize plants with different TSC severity levels was used, previously determining the affected area of each one of them. The severity of each image was evaluated by ten evaluators with the help of the scale, five of them with experience in the quantification of disease severity and five without direct experience in the phytopathological area. The accuracy and precision of each evaluator was determined through a simple analysis of linear regression as described by Nutter et al. (1991).
The accuracy of each evaluator was determined through the T test applied to the intercept of the linear regression (b0), to verify the H0: b0=0 hypothesis; and with the coefficient of the slope of the line (b1) to estimate if it was different from 1 (H0: b1=1), with P ≤ 0.01. The accuracy of the tests was estimated with the coefficient of determination (r2) of the same linear regression and with the absolute deviation of the error. The simple linear regression analysis was done through the GLM procedure of the SAS 9.0 statistical package.
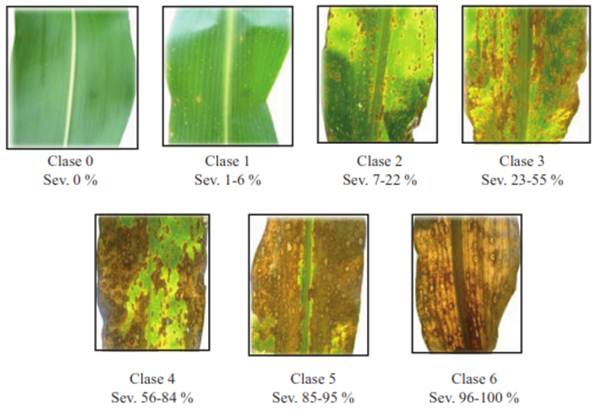
In the field, the maximum severity value of TSC observed was 100 %, causing the premature senescence and death of the entire plant; conversely, the inferior limit had 0% severity. Considering both limits, the diagrammatic logarithmic scale was constituted by seven classes, represented by the intervals 0(0-0), 3(1-6), 12(7-22), 38(23-55), 72(56-84), 91(85-95) and 98(96-100)% of the necrotic foliar area (Figure 1).
The accuracy, represented by the degree of proximity of the estimated values to the real values (Nutter et al. 1991), measured by the b0 intercept and by the b1 coefficient of the linear model, was greater for the evaluators with experience in the quantification of diseases (Table 1). The values of the b0 intercept were closer to zero for the first group. The value of the b0 intercept was positive in almost all cases, which indicates that there is a tendency to overestimate the severity of the disease; this tendency was greater for the evaluators without experience. Based on the null hypothesis (a=0 o b=1), the coefficient b1 was statistically equal to 1 (P<0.01) for most of the evaluators, indicating that the assessment of TSC generates results that are close to the real values, even when there is a tendency to overestimate them. Nascimiento et al. (2005) point out that an overestimation of the majority of evaluators indicates the presence of positive constant deviations for all levels of severity of the disease.
Table 1 Estimate of the interception parameters (b0), slope (b1), and coefficient of determination (r2) of the simple linear regression analysis calculated between the real and estimated severity of TSC, carried out by 10 evaluators with and without experience in the quantification of diseases.
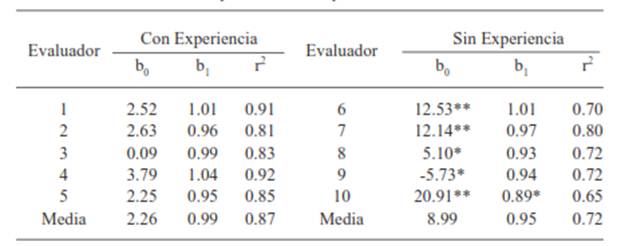
*, **Situation where the intercept value of the line (b0) or the coefficient of the slope (b1) were statistically different from 0 and 1 respectively; based on the T test with α=0.05 and 0.01, respectively.
According to Sherwood et al., (1983) the leaves with similar severities but with a different number of lesions generate a tendency to overestimate the disease, mainly when the number of lesions is high and their size is small, such is the case of TSC, where the usual symptom denominated "fish-eye" is presented in a high number of lesions. The overestimation of the severity levels using logarithmic scales has been common in several pathosystem. This has been reported, among others, by Barbosa et al., (2006) for Puccinia horiana; and Aquino et al., (2008) for Ramularia gossypii.
The precision (reproducibility or variation associated with an estimation), estimated by the coefficient of determination (r2) and by the variability of the absolute errors (Nutter et al., 1991), was greater for those evaluators with experience, fluctuating in the range of 0.81 to 0.92 (Table 1; Figure 2). The precision levels observed indicate that the first contact with the scale is appropriate for successful implementation in the evaluation of TSC. In regards to this, Michereff et al., (2006) determined precision values appropriate for a first evaluation with the use of scales; conversely, Tovar et al., (2002) had to familiarize the evaluators in order to increase precision and accuracy.
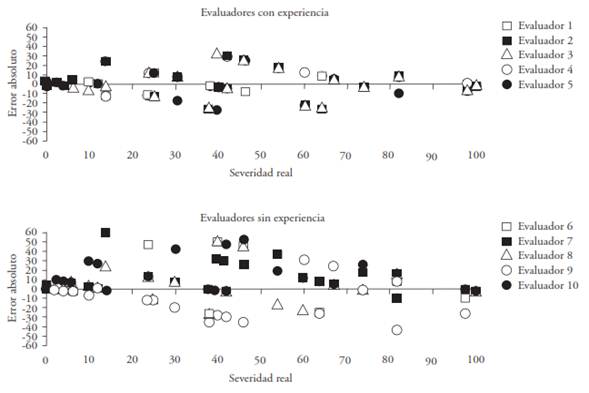
Figure 2 Errores absolutos (severidad real - severidad estimada) de las evaluaciones del CMA con el uso de la escala logarítmica; en la parte superior los evaluadores con experiencia en la cuantificación de enfermedades, en la parte inferior los evaluadores sin experiencia.
The precision values observed in the evaluators without experience are acceptable; prior training could have a positive influence on the quality of the evaluations. This has been demonstrated for other pathosystems: Barbosa et al.,(2006) and Aquino et al., (2008) considerably elevated the accuracy and precision of the estimations of the evaluators without experience after prior training. The same author indicates that there was no significant improvement for the experienced evaluators.
The reproducibility of the scale was high using the same scale for the assessment of the material, given different evaluators estimated similar severity percentages. The linear regression of the severities estimated by the evaluators produced coefficients of determination that varied within the range of 65 to 91 (Table 1). Therefore, the use of the diagrammatic scale for the evaluation of TSC generates a high concurrence with the real severity values, reflected in a high precision among the evaluators.
Hock et al., (1992) developed a scale that was also based on the logarithmic law for the in-field evaluation of the severity of TSC; however, the obtained precision values were not adequate. This was due to the complicated quantification system and to the elevated number of classes with which it was developed; furthermore, it considered the symptoms caused by both infectious agents separately. In this study, the symptoms of P. maydis and M. maydis were considered together, resulting in the observance of the combined symptoms of the disease by the evaluator.
Finally, the use of standardized systems for the quantification of maize diseases, and those of any other crop, proves to be a powerful tool as it allows the perfect comparison of experiments carried out by different institutions and investigators. The diagrammatic logarithmic scale for the TSC proposed in this study represents a standardized quantification method for the disease that will help obtain easily reproducible results, due to its high levels of accuracy and precision among several evaluators, therefore, it can be used as supporting material for different kinds of studies related to the quantification of the severity of TSC.
REFERENCES
Aquino LA, Berger PG, Rodríguez FA, Zambolim L, Hernández FR, Miranda LM. 2008. Elaboração e validação de escala diagramática para quantificação da mancha de ramularia do algodoeiro. Summa Phytopathologica 34(4):361-363. [ Links ]
Barbosa MA, Michereff SJ, Mora AG, 2006. Elaboration and validation of diagrammatic key to evaluate white rust severity in Chrysanthemum. Summa Phytopathologica 32:57-62. [ Links ]
Gómez MN, González CM, Cantú AM, Sierra MM, Coutiño EB, Manjarrez SM. 2013. "H-563", Híbrido de maíz tropical tolerante a la enfermedad "Mancha de asfalto". Revista Fitotecnia Mexicana 36(1):81-83. [ Links ]
Hock J, Kranz J, Renfro BL. 1989. El "complejo mancha de asfalto" del maíz, su distribución geográfica, requisitos ambientales e importancia económica en México. Revista Mexicana de Fitopatología 7(2):129-135. [ Links ]
Hock J, Kranz J, Renfro BL. 1992. Tests of standard diagrams for field use in assessing the tarspot disease complex of maize (Zea mays). Tropical Pest Management 38:314-318. [ Links ]
Michereff SJ, Noronha MA, Andrade DEG, Oliveira EP, Xavier FMS, Moreira PAA. 2006. Development and validation of diagrammatic key for Cercospora leaf spot of sweet pepper. Summa Phytopathologica 32(3):260-266. [ Links ]
Mora AG, Rivas VP, Góngora CC, Tovar SA, Cristóbal AJ, Loeza KE, Michereff JS, Marinelli A, Osada VK. 2000. Sistemas computarizados en la epidemiología: 2-Log ver. 1.0 y su aplicación en el diseño de escalas diagramáticas logarítmicas. XXIX Simposio Nacional de Parasitología Agrícola. Puerto Vallarta, México. [ Links ]
Nascimiento RPA, Michereff, JS, De la Rosa LR, Gómez MAA. 2005. Elaboração e validação de escala diagramática para cancro bacteriano da videira. Summa Phytopathologica 31: 59-64. [ Links ]
Nutter FW, Teng PS, Shokes FM. 1991. Disease assessment terms and concepts. Plant Disease 75: 1187-1188. [ Links ]
Pereyda HJ, Hernández MJ, Sandoval IJS, Aranda OS, De León GC, Gómez MN. 2009. Etiología y manejo de la mancha de asfalto (Phyllachora maydis Maubl.) del maíz en Guerrero, México. Agrociencia 43(5):511-519. [ Links ]
Sherwood RT, Berg CC, Hoover MR, Zeiders KE. 1983. Illusions in visual assessment of Stagonospora leaf spot of orchardgrass. Phytopathology 73(2): 173-177. [ Links ]
Tovar SA, Hernández MM, Cristóbal AJ, Romero HR, Mora AG. 2002. Escala logarítmica diagramática de severidad de la mancha negra (Colletotrichum gloeosporioides Penz.) en Chirimoyo (Annona cherimola M.). Revista Mexicana de Fitopatología 20:103-109. [ Links ]
Received: July 22, 2014; Accepted: December 20, 2014
 This is an open-access article distributed under the terms of the Creative Commons Attribution License
