


 nueva página del texto (beta)
 Inglés (pdf)
 Artículo en XML
 Referencias del artículo
 Enviar artículo por email
 Citado por SciELO
  Similares en
SciELO
Similares en
SciELO 
 Permalink
The arrival of Europeans to the Americas after 1492 initiated a sea-change in the demographic patterns of indigenous peoples. Europeans brought highly contagious Old-World “crowd diseases” such as smallpox and measles that killed thousands. Warfare claimed lives, and there were instances of competition for sexual partners. Many populations experienced demographic collapse.
Several generations of scholars have hypothesized heavy epidemic mortality, and almost continuous population decline following sustained contact with Old-World pathogens. One of the studies that has defined the conventional wisdom on the question is the 1976 article by Alfred Crosby who proposed the model of “virgin soil” epidemics. He hypothesized heavy epidemic mortality caused by the first epidemics following sustained contact, but a gradual lessening of mortality with the passage of time as the population built-up immunities to the new pathogens.1 Henry Dobyns elaborated on the model. He argued that epidemics spread across the Americas decimating indigenous populations.2 In an academic study and edited volume, Noble David Cook presented mostly qualitative evidence of the effects of epidemics on the indigenous populations of the Americas.3
The Crosby hypothesis and the studies of Dobyns and Cook, among others, make assumptions about the short and long-term effects of epidemics based largely on qualitative sources in the absence of quantitative sources. Moreover, the debate on post-contact demographic patterns has largely ignored comparative studies of contemporary European populations that have a foundation in more sophisticated methodologies and detailed quantitative sources that can offer insights to demographic change in the Americas. Furthermore, recent research on the population of medieval Europe suggests that chronic ailments were more important than epidemics in shaping demographic patterns, which is also a factor not generally considered in the discussion of the effects of disease in the Americas.
Detailed studies of discrete indigenous populations offer insights that modify and refine older assumptions about post-contact demographic patterns. Pathogens such as smallpox and measles spread with contact between large numbers of people, and not so easily among spatially dispersed populations such as small bands of nomadic hunters and gatherers. This article examines the relationship between demographic patterns and the Spanish policy of congregating indigenous populations found on the frontiers in spatially compact mission communities created from whole cloth. Bringing large numbers of people to live on missions helped facilitate the spread of contagion, but also caused sanitation problems. This study outlines the development of mission urban plans to more fully understand the demographic consequences of resettlement on missions, and challenges conventional wisdom of post-contact demographic patterns.
The question of indigenous demographic patterns in sixteenth-century central Mexico has generated considerable debate, and has been an important case study in the debate over post-contact demographic collapse. The inquiries that have defined the conventional wisdom on the question are those of the “Berkeley School” (Lesley Simpson, Sherburne Cook, Woodrow Borah), who engaged in the exercise of trying to estimate the pre-contact size of the indigenous populations of central Mexico.4 The estimate of the size of the contact population of central Mexico has been important in several generations of scholarly assumptions made regarding sixteenth-century indigenous population decline. In their last studies Cook and Borah estimated a population in the range of 18 to 30 million, and a mid-point figure of 25 million.
Although there is no question that the indigenous population of central Mexico was large at the point of contact, the Cook-Borah estimate was an example of what can be called fuzzy math. Later sixteenth-century tribute censuses provide a reasonable foundation for population estimates. However, the problem was with the figure of 25 million. Cook and Borah relied on the suma de visitas to extrapolate the size of the population in 1519.5 The suma de visitas was a series of reports on the tribute obligations of some central Mexican jurisdictions prepared around 1550. The reports were produced for royal officials to understand the status of tribute obligations, and not to provide demographic information. The reports used different categories to indicate the number of tributaries, and the categories cannot be reconciled to provide the basis of a reliable population estimate. The assumptions Cook and Borah made about the information provided in the suma de visitas and their nuancing of the data could not overcome the deficiencies in the data of the reports to extrapolate a contact population size. In the absence of reliable data, it is impossible to know the size of the indigenous population in 1519. The discussion of the sixteenth-century decline of the indigenous population of central Mexico has assumed a more than 90 percent drop in numbers based on the flawed Cook-Borah estimate of 25 million in 1519.
This study focuses on case studies of the Jesuit Guaraní missions in the eighteenth-century, that evidenced examples of rates of catastrophic epidemic mortality in the range of what has been hypothesized for sixteenth-century “virgin soil” epidemics. This heavy epidemic mortality occurred some 200 years following the arrival of the Spanish and the Portuguese in the region, and calls into question assumptions made regarding patterns of epidemic mortality over time. Moreover, there were also differential mortality rates between mission communities. The mission populations were not large enough to sustain contagion in endemic form, and there were epidemics about once a generation when there was a sufficiently large number of people not previously exposed to the contagion, that is children born since the previous outbreak, to sustain the chain of infection. The evidence from the Guaraní missions, as well as of contemporary European populations, shows demographic recovery following epidemic and catastrophic epidemic mortality, which is generally not considered in studies of the effects of sixteenth century epidemics. The second case study is of the Franciscan missions established in California a after 1769. Few epidemics spread to the California mission populations, and demographic collapse resulted from high mortality from chronic ailments and intestinal parasites from poor sanitation. Moreover, a recent study suggests that heavy mortality among the indigenous populations did not occur prior to the establishment of the missions, suggesting that epidemics did not spread to the region until the late eighteenth-century.6 Recent research on the population of late medieval England suggests that chronic ailments were more important than epidemics in shaping demographic patterns which is not a factor considered in the discussion of the effects of disease in central Mexico.7 This adds another factor to an understanding the role of sixteenth century demographic patterns.
The final case study is of the development of mission urban plans on existing communities, in this case communities in sixteenth-century central Mexico. Recent research by Ryan D. Crewe interjects the demographic question in the context of the construction of doctrina (mission) complexes as an element of the development of the mission urban plan in central Mexico communities. However, in addressing the question of why the indigenous peoples of central Mexico collaborated in the construction of expensive and time-consuming doctrina building projects, Crewe offers a one-dimensional interpretation that dismisses other scholarly views on the question, and ignores many of the nuances of the history of the development of the complexes. Crewe argues that a surge in building projects in the 1550s following a devastating epidemic in the mid-1540s was a way for indigenous communities to reconstruct themselves in the wake of a severe demographic disaster, and that there was a direct cause and effect relationship between the epidemic and the building projects.8 Crewe does not conceptualize the possibility of demographic recovery following the epidemic, and does not give credence to other factors that may have resulted in indigenous communities providing labor and resources for more than 200 convent construction projects.
Crewe’s interpretation also lacked a more nuanced understanding of the different architectural elements in the doctrina jurisdictions the missionaries administered, and the stages in the development of the main doctrina complexes themselves. In addition to the main complex, and head mission communities frequently had capillas de barrio that roughly corresponded to the pre-Hispanic social-political jurisdiction, the calpulli, as well as the visita chapels in communities that did not have resident missionaries. In giving members of the missionary orders (Franciscan, Dominican, Augustinian) considerable agency in imposing their notion of the mission urban plan, Crewe largely ignored another important element in community development which was the ways in which indigenous peoples incorporated their own vision of sacred geography in the communities.
Mission Urban Plan and Demographic Patterns
Royal policy sought to integrate indigenous populations into the emerging colonial society, and integration also included evangelization. In the areas with hierarchical and stratified state systems such as central Mexico the transition was not difficult, since a similar pattern of urban spatial organization already existed and the Spanish imposed the new urban norms on an existing matrix. In the case of Mexico City, the Spanish began the process of modifying the urban plan to convert the indigenous city into the seat of power for the new colonial order soon after the conquest.9 The process of the imposition of new urban norms took longer in other indigenous communities, and also became an important element of the program of evangelization and social engineering among indigenous groups on Spanish American frontiers.10
Beyond the frontier of advanced sedentary indigenous societies in the different regions of Spanish America, the Spanish encountered peoples with different levels of social-political organization, and relied on missions staffed by members of different religious orders as a cost-effective way to promote integration. The mission project entailed not only religious conversion, but also a process of social engineering designed to create stable indigenous communities. Missions settled on different frontiers consisted of new communities created from whole cloth based on the grid plan with indigenous peoples congregated or brought to live on the new settlements, or the “establishment” of missions on existing indigenous communities. Missions founded beyond the Chichimeca frontier in Mexico at the end of the sixteenth century were an example of the creation of new communities. An initial military effort to subjugate the bands of nomadic hunters and gatherers collectively known as Chichimecas failed, and Church officials pressed for a changed policy of evangelization and integration. The Jesuit mission San Luis de la Paz (Guanajuato) founded in the early 1590s was an example of a new community established on the grid plan.11
What did mission settlements look like? Missionaries on different Spanish American frontiers directed the development of mission building complexes of varying degrees of intricacy. Contemporary historic diagrams exist of the fully developed building complexes of missions, and examples from two frontiers are analyzed here. The fully developed mid-eighteenth-century compounds of the Jesuit Guaraní missions (parts of Argentina, Paraguay, and Brazil) were, along with those of Chiquitos and Moxos in eastern Bolivia, perhaps the most sophisticated mission communities in the Americas, and most closely corresponded to the ideal of the urban scheme introduced by royal fiat. There are historic drawings and paintings of mission compounds while still administered by missionaries, but very few examples of contemporary professionally drawn diagrams of mission complexes.
One exception is the existence of diagrams of selected Guaraní missions. Mixed Spanish-Portuguese boundary commissions undertook the process of establishing the limits of Spanish and Portuguese territory in South America following the Treaty of Madrid (1750) and the Treaty of San Ildefonso (1777). King Fernando vi (r. 1746-1759) was married to a member of the Portuguese royal family, and pursued a more pro-Portuguese policy. He signed the Treaty of Madrid that defined Spanish and Portuguese spheres of influence in South America. King Carlos III (r. 1759-1788) ascended the throne on the death of his brother, and pursued an anti-Portuguese policy. He abrogated the Treaty of Madrid in 1761, and in 1777 signed the Treaty of San Ildefonso after a renewed period of armed conflict during the Seven Years War (1755-1763) and after the declared peace.12 Members of the mixed commissions produced professionally drawn diagrams of the fully developed complexes of the seven Guaraní missions located east of the Uruguay River in what today is Rio Grande do Sul, Brazil, and of other missions. Under the terms of the Treaty of Madrid, Spain transferred the territory east of the Uruguay River to Portugal in exchange for Colônia do Sacramento located in what today is Uruguay, and members of the joint commission organized under the terms of the treaty prepared the earliest detailed diagrams.
An undated and unsigned document and diagram found in the Archivum Romanum Societatis Iesu (henceforward, arsi, Vatican City) depicted the typical urban plan of the Jesuit Guaraní missions, and the document also described the types of structures and construction materials of the different buildings.13 The churches were large monumental structures that generally measured 70-80 varas (about .864 meters) in length, and 26-28 in width, and in some cases 90 x 30 varas. Most had three naves, whereas the church at Concepción had five naves and was 86 x 40 varas. They were built of stone or a combination of stone and adobe with one to two varas of stone construction, as in the case of the San Juan Bautista mission church. The monumental church dominated the mission compound and fronted the plaza or main square. The square was the center of communal life, and the document reported that the plaza generally was 160 square varas. The streets in the mission community reportedly were 16-18 varas in width. Other architectural elements included the colegio complex with residences for the Jesuit missionaries, kitchen, store rooms, and workshops. Adjoining the church there generally was a free-standing bell tower and cemetery divided into four sections for the burials of men, women, boys, and girls.
There was also the cabildo and housing for the Guaraní that usually consisted of long barracks-like structures with multiple small apartments. The Jesuits congregated thousands of Guaraní, and the spatially compact mission villages had a high population density. In these conditions, epidemics spread easily. The same document described the housing in broad terms, and that generally was not built or the same quality as other structures in the complexes. In some cases, as at Trinidad and San Ignacio Miní, housing was built of stone. Others had stone walls to a height of about a vara, and the rest adobe. They had stone or wooden columns to support the tile roofs with overhangs that protected the walls from rain and provided shade. The document reported that the apartments were generally three varas wide.14 A comment below the diagram suggests that the author may have based the diagram on information from the joint boundary commission of the late 1750s.
There are two surviving Portuguese diagrams of San Miguel mission that date to the late 1750s, and they document the typical mission urban plan (see plates 1 and 2). One drafted in a two-dimensional form shows the similarity of the church façade to that of Il Gesu church in Rome. It also shows the different elements found on the other missions that included the colegio, cabildo, chapels, housing for the mission residents, and a structure known as the cotiguaçu or dormitory for widows and orphans. The undated diagram is part of an atlas that documents the suppression of Guaraní resistance to the transfer of the seven missions located east of the Uruguay River per the terms of the Treaty of Madrid.15 The second probably dates to 1759, and is a one-dimensional representation of the mission complex.16 At about the time of the drafting of the two diagrams, in 1754, the population of San Miguel totaled 6 450.17
Demographic Patterns on the Guaraní Missions
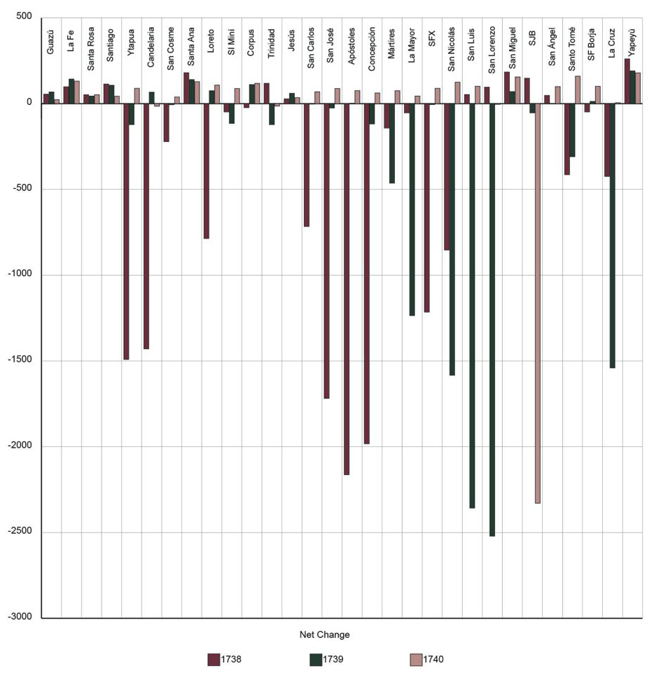
The mission urban plan played an important role in determining demographic patterns, and particularly in the expansion of lethal epidemics of diseases such as smallpox and measles. Large populations lived in spatially compact communities where contagion spread easily, as in the case of the 1737-1740 smallpox epidemic that reached levels of catastrophic mortality in some missions. It was one in a series of outbreaks exacerbated by poor crops and famine between 1733 and 1740 that left more than 90 000 Guaraní dead. Most of the missions experienced a net decline in population during the period of crisis (see table 1, graph 1), and in some instances, catastrophic mortality during the smallpox epidemic that in some cases claimed the lives of more than half the population of individual mission communities.

Plate 1 A c. 1759 diagram of San Miguel Mission: Missió de S. Migl. Biblioteca Nacional de Brasil (BNB), Rio de Janeiro. In the public domain.
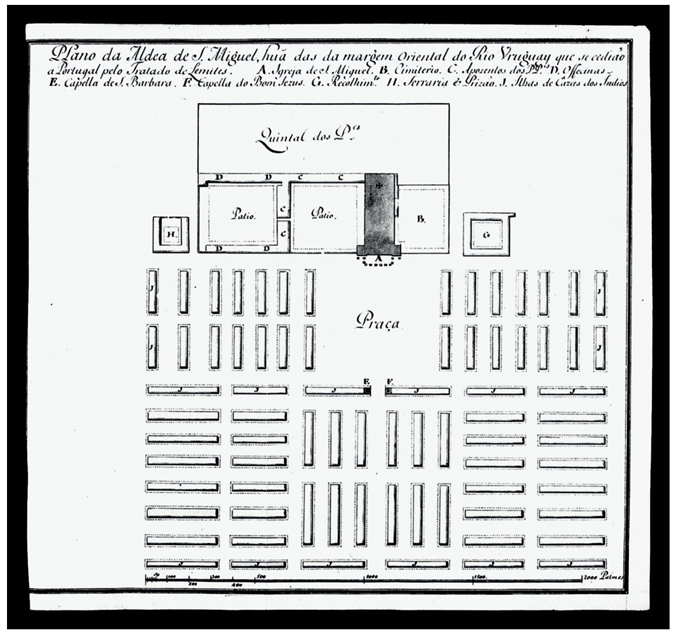
Plate 2 Plano da Aldea de São Miguel. “Diario das tres partidas de demarcaçâo da America em virtude do tratado do limites ajustado entre as doas coroas de Espanha e Portugal [1759]”, BNB. In the public domain
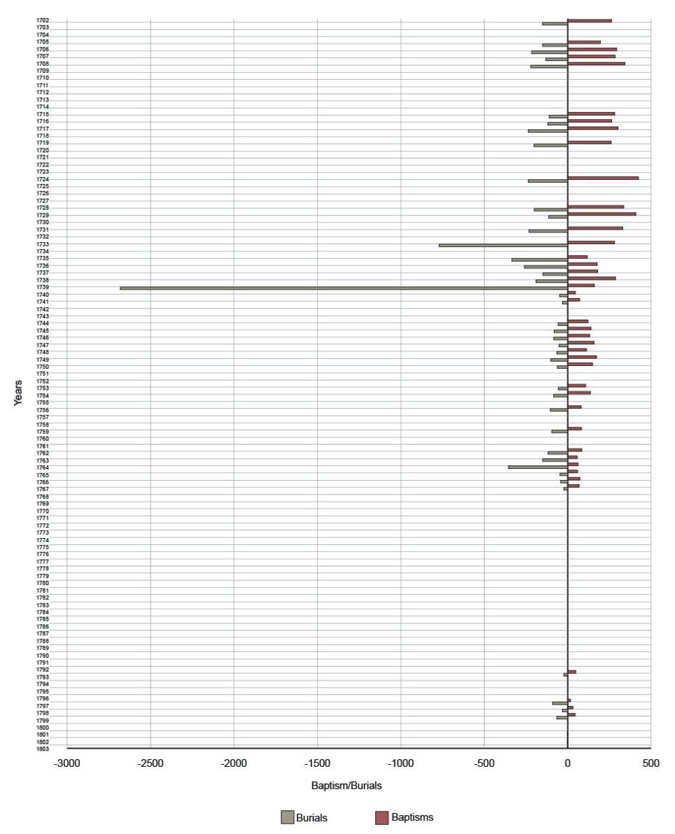
The population of San Lorenzo mission, for example, dropped from 6 513 recorded in 1732, to 974 at the end of 1739. Mortality during 1739 reached 557 per thousand population.18
However, the populations of the missions rebounded or recovered following the epidemic, as shown in the case of San Lorenzo mission where there was an increase in the formation of new families and increased birth rates following the epidemic. In the non-crisis year 1724, San Lorenzo mission had a population of 5 224. The Jesuits recorded 52 marriages, or 10 marriages per thousand population. Following the first epidemic in 1733, the number of marriages recorded at San Lorenzo jumped to 155 or 24 per thousand population. Following catastrophic smallpox mortality at the mission in 1739 that left a population of 974, there was a total of 122 marriages or 25 per thousand population.19 Graph 2 shows baptisms and burials recorded on San Lorenzo mission. Evident is the heavy mortality during crisis years, and particularly in 1739. However, it also shows a pattern of larger numbers of baptisms than burials in non-crisis years.
Table 1 NET CHANGE +/- IN THE POPULATION OF THE GUARANÍ MISSIONS, 1733, 1735-1740
| Mission | 1733 | 1735 | 1736 | 1737 | 1738 | 1739 | 1740 |
|---|---|---|---|---|---|---|---|
| Guazú | -1076 | 15 | 5 | 56 | 55 | 68 | 23 |
| La Fe | -2472 | -1 | 51 | -50 | 98 | 143 | 131 |
| Santa Rosa | -2153 | -4 | 19 | 42 | 52 | 44 | 52 |
| Santiago | -86 | 76 | 37 | 95 | 114 | 107 | 43 |
| Ytapúa | -604 | -17 | 27 | -272 | -1491 | -122 | 89 |
| Candelaria | -50 | -24 | -14 | -2 | -1429 | 67 | -15 |
| Santos Cosme y Damián | -192 | -27 | -154 | 0 | -221 | -6 | 39 |
| Santa Ana | -758 | 53 | -187 | 56 | 180 | 140 | 128 |
| Loreto | -723 | -459 | -1182 | -10 | -786 | 75 | 108 |
| San Ignacio Miní | -247 | -320 | -437 | 38 | -48 | -115 | 88 |
| Corpus | -306 | -346 | -178 | 40 | -23 | 111 | 118 |
| Trinidad | -227 | 34 | -48 | -197 | 118 | -122 | -14 |
| Jesús | -154 | -10 | -24 | -292 | 28 | 60 | 35 |
| San Carlos | -91 | -31 | -30 | -56 | -716 | -2 | 69 |
| San Jose | -201 | 16 | -159 | 92 | -1718 | -25 | 88 |
| Apóstoles | -179 | 34 | 67 | 2 | -2163 | 2 | 76 |
| Concepción | -86 | 61 | 5 | -12 | -1982 | -118 | 62 |
| Mártires | -289 | -84 | -11 | 3 | -142 | -463 | 75 |
| La Mayor | -323 | -130 | -169 | -25 | -53 | -1235 | 44 |
| SFX | -329 | -24 | -182 | 27 | -1215 | -5 | 89 |
| San Nicolás | -304 | -187 | -496 | 15 | -853 | -1583 | 125 |
| San Luis | -669 | -122 | -112 | 18 | 53 | -2357 | 101 |
| San Lorenzo | -491 | -218 | -82 | 31 | 96 | -2521 | -4 |
| San Miguel | 150 | 109 | 83 | 135 | 184 | 70 | 155 |
| San Juan | -289 | 40 | -19 | 114 | 148 | -53 | -2329 |
| Santo Ángel | -142 | -67 | -18 | 64 | 48 | 0 | 99 |
| Santo Tomé | 20 | 77 | 3 | 44 | -414 | -309 | 160 |
| SF Borja | -212 | 138 | 25 | 105 | -48 | 13 | 101 |
| La Cruz | -602 | 116 | 114 | 34 | -424 | -1540 | 5 |
| Yapeyú | -407 | 115 | 283 | 37 | 261 | 191 | 179 |
| Yapeyú | 1731 181 | 1732 -32 | 1734 -227 |
SOURCE: Catálogo de la Numeración Annual de las Doctrinas del Río Paraná/del Río Uruguay. Año de 1738, Coleção de Angelis, BNB, Rio de Janeiro. Robert H. Jackson, Demographic Change and Ethnic Survival Among the Sedentary Populations on the Jesuit Mission Frontiers of Spanish South America, 1609-1803: The Formation and Persistence of Mission Communities in a Comparative Context (Leiden: Brill Academic Publishers, 2015), 213-215, 217-220; Robert H. Jackson, The Bourbon Reforms and the Remaking of Spanish Frontier Missions (Leiden: Brill Academic Publishers, 2022), 151.
SOURCE: Table 1.
Graph 1 NET CHANGE IN THE POPULATION OF THE GUARANÍ MISSIONS DURING THE 1738-1740 SMALLPOX EPIDEMIC
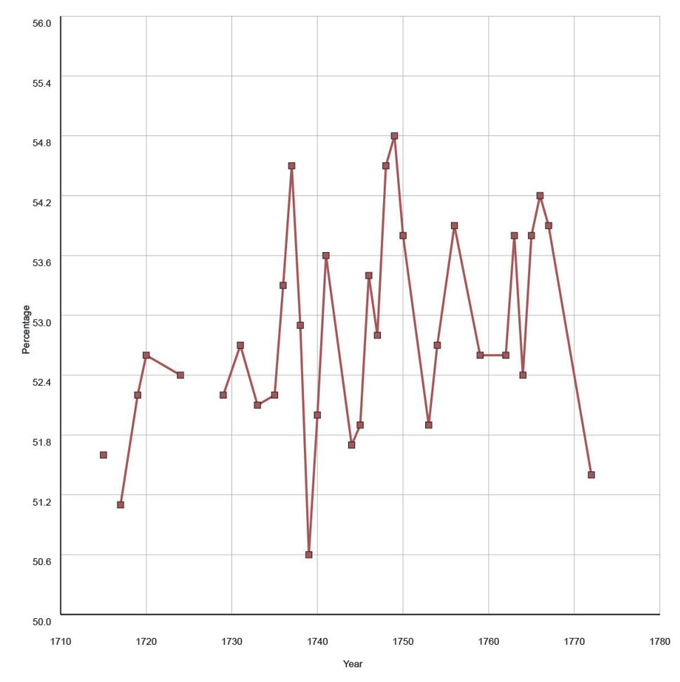
Two other factors explain the resilience of the Guaraní mission populations. One was a pattern of a balanced gender structure in the mission population. In other words, the female population generally constituted the majority in the mission populations, as seen in the case of San Lorenzo mission (graph 3). Females as a percentage of the total population of San Lorenzo dropped in 1739 as a result of heavier smallpox mortality among women and girls. This was evidence of the TH-2 response in the immunological system of women and girls that exacerbates infections by pathogens such as smallpox and measles resulting in higher mortality.20 Nevertheless, and despite the heavier mortality, women and girls still constituted the majority, and there was a large enough pool of potential marriage partners to form new families. This pattern was different from that on the California missions discussed below, where heavy chronic mortality among women and girls resulted in a pronounced gender imbalance.
The second factor was the high birth rates among the Guaraní mission populations, and the survival of more young children to adulthood. Graph 4 shows the population of young children under age nine as a percentage of total population. There were high rates of infant mortality, as was also the case of the California missions discussed below. However, more children survived infancy in non-crisis years. Moreover, women tended to marry at a young age soon after puberty, at around age 13. This meant that women had the potential to bear more children during their cycle of fertility.21 This was also an important factor in the pattern of moderate to high birth rates. In a sample of 20 non-crisis years at San Luis Gonzaga mission, for example, the crude birth and death rates per thousand population averaged 61.2 and 39.6 respectively. In other words, the mission population grew at an average rate of 2.2 percent per year.22

1854 Plat Maps and Coastal Survey Maps of the California Missions
The second group of mission diagrams analyzed here document the urban plan of the Franciscan missions of California, that were similar to the Guaraní missions in that the Franciscan missionaries congregated the indigenous populations on new mission communities created from whole cloth. The Franciscan mission urban plan also included European-style housing for the indigenous populations. The diagrams are a series of plat maps produced in 1854 as part of the process by the California Bishopric to petition for the return of the mission sites to the Catholic Church. In 1850, the United States government established a special land court in San Francisco to adjudicate titles to lands granted to private individuals in the 1830s and 1840s. The California Catholic Church successfully petitioned for the return of the mission sites.
Franciscans from the Apostolic College of San Fernando in Mexico City established and administered the California missions between 1769 and 1834, and founded 21 mission communities. In 1833, the Mexican government ordered the secularization of the California missions, or in other words to transfer the mission parishes to secular clergy and the process also entailed the appointment of civil administrators to manage mission assets. In theory, the Franciscans and later the civil administrators were to operate the mission estates on behalf of the indigenous inhabitants of the missions, but few actually received land, tools, or livestock. Non-indigenous recipients of land grants and the civil administrators themselves pillaged the mission estates, and in particular took mission livestock to stock their own properties.23 For example, the value of the San Juan Bautista mission estate reportedly dropped from 138 973 pesos in 1834, at the time of the preparation of an inventory as a part of the secularization process, to 7 860 pesos in 1845.24
The surveyors hired by the Catholic Church prepared the plat maps in 1854, 20 years following mission secularization. During the period of their administration of the missions, the Franciscans directed the construction of most buildings in the mission complexes of adobe roofed with burnt roof tiles.25 During the period of civil administration, the managers allowed the roof tiles to be removed for buildings erected elsewhere, and once exposed to the elements the adobe structures rapidly deteriorated and particularly the housing built on the missions for the indigenous populations. However, there are several drawings of the fully-developed mission complexes prior to mission secularization. One is a 1827 drawing of the San Jose mission complex by William Smyth. The drawing shows the mission church and cloister, but also the housing built for the indigenous mission residents. The housing consisted of rows of barracks-like structures similar to the housing on the Guaraní missions. The 1854 San Jose mission plat map shows that most of the housing had fallen into ruin for lack of maintenance, and only one housing unit remained.26
Several of the plat maps recorded details of the fully developed mission complexes as they were twenty years earlier at the time of the implementation of the secularization decree, including housing for the indigenous population. The plat map for Santa Bárbara mission (established in 1786) (see plate 3) documented an arrangement similar to that shown in the 1827 drawing of San Jose mission as well as the Guaraní missions. There were eight rows of barracks-like structures with multiple small apartments. The Franciscans reported the construction of 252 housing units at the mission in the years 1798-1807.27 In contrast, housing at San Miguel (established in 1797) missions consisted of a single long row of small apartments in a “u” shape, and the Franciscans expanded the number of housing units by adding to the existing apartments (see plate 4). There is a record of the construction of housing at San Antonio in 1786, 1791, 1805-1806, 1808-1809, and 1829. At San Miguel, the Franciscans reported the construction of housing in 1805.28
A second set of maps document the California mission urban plan in the 1850s and 1860s. They are coastal surveys that charted the California coast and coastal waters, and in some instances also documented the towns and ex-mission complexes. One example is an 1853 map of the harbor at Santa Cruz, that also included the mission and town (see plate 5). The map depicts the church and main quadrangle already showing signs of deterioration for lack of maintenance. Adjoining the quadrangles is a long structure built between 1822 and 1824 as housing for neophyte families. A similar long structure for neophyte housing that paralleled that shown in the map had fallen into ruin and disappeared. The configuration of neophyte housing at the mission was similar to that at San Miguel mission. The structure does not appear in the 1854 plat map of the mission, because it was one of the rare instances where former neophytes occupied mission housing, and thus was in private hands when the Catholic Church received title to the mission site.29
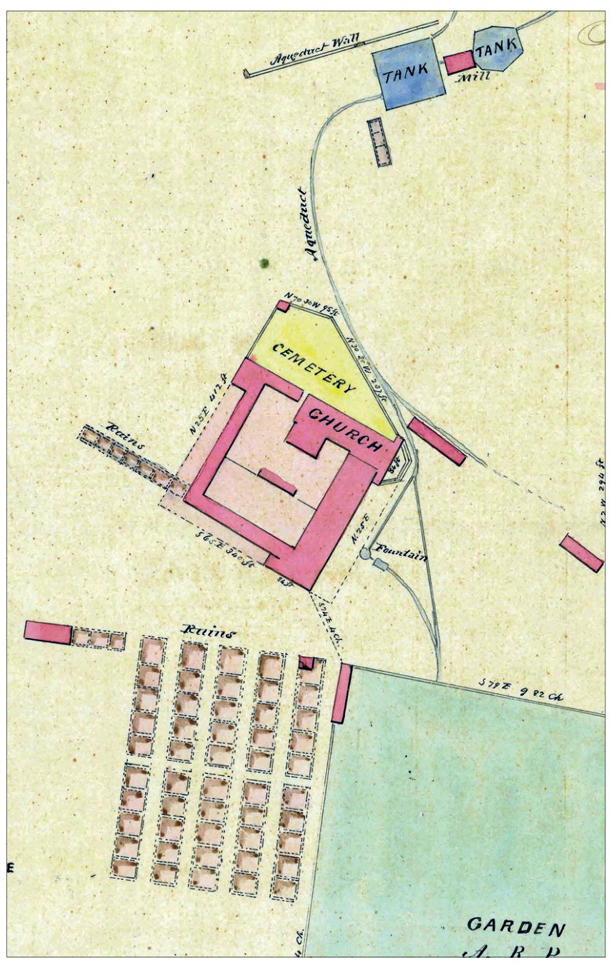
Plate 3 Detail of the 1854 plat map of Santa Barbara mission, showing neophyte housing. The Bancroft Library, University of California, Berkeley. In the public domain.

Plate 4 Detail of the 1854 plat map of San Miguel mission, showing neophyte housing. The Bancroft Library, University of California, Berkeley. In the public domain.
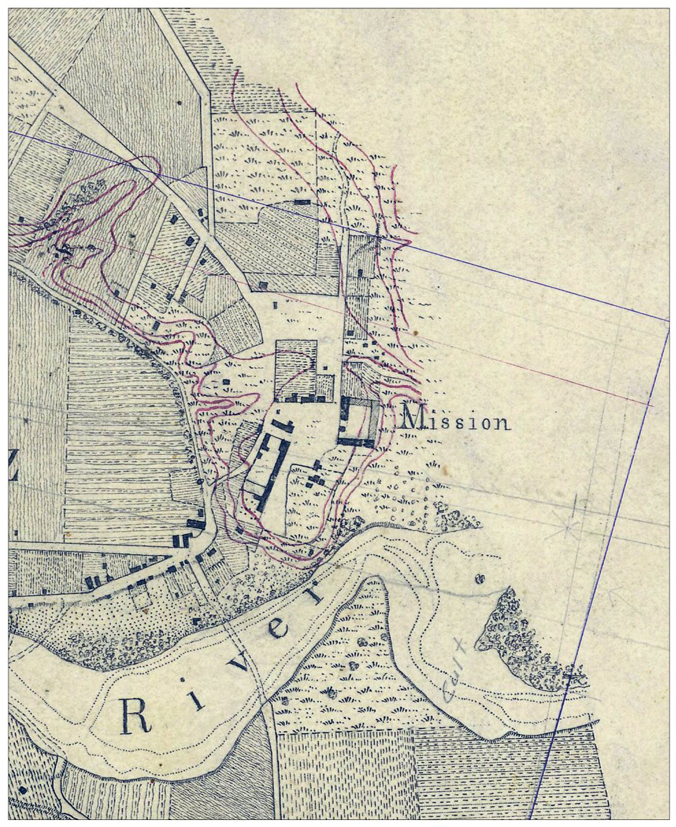
Plate 5 An 1853 coastal survey map that shows the remains of the Santa Cruz mission complex. U.S. Coastal Survey, “Map of Santa Cruz Harbor and Vicinity 1853”, National Oceanographic and Atmospheric Administration (henceforward, NOAA)’s Historical Map & Chart Collection. In the public domain.
Following the 1834-1835 secularization of the missions, some ex-neophytes continued to reside in the general area of the mission complexes, although the majority did not occupy former mission structures that were administered by civil administrators appointed by the California governor.30 An 1855 coastal survey map of ex-mission San Buenaventura (see plate 6) shows the former mission complex and emerging town. It also shows several indian ranchos or small settlements of ex-neophytes located in the bed of the nearby river. They most likely worked as agricultural laborers in the fields just outside of the town, and two of the indian ranchos are shown right next to developed agricultural land. The Franciscan missionaries and later the civil administrators ostensibly managed the mission estates on behalf of the neophytes, but the former mission residents were marginalized and lived on the edge of the communities they created through their labor.
The California mission urban plan documented in the 1854 plat maps and coastal survey maps defined demographic patterns on the California missions, but in ways different from the Guaraní missions. In both cases the missionaries congregated indigenous populations on new communities, but the California mission populations did not grow through natural reproduction as was the case on the Guaraní missions. As already noted, periodic epidemics that occurred once a generation or roughly every 20 years caused catastrophic mortality on the Guaraní missions. However, the mission populations “rebounded” or recovered and grew following the epidemics. The Guaraní mission populations evidenced a pattern of a balanced gender structure with females constituting the majority. Following epidemics there were an increased number of marriages and the formation of new families as evidenced in increased numbers of marriages, and high birth rates. Guaraní men did not face problems encountering marriage partners.
Demographic patterns on the California missions were very different. The missions were relatively geographically isolated. Few epidemics spread to the missions, and there was chronically high mortality and particularly among young children, women of infant mortality and mortality among girls and women. Syphilis contributed to the high mortality, and especially among newborn children infected by the mother through the placenta. The Franciscans treated syphilis with mercury pills, a poison. Another important factor was inadequate medical and prenatal medical attention, and poor hygiene. The Franciscans were obsessed with the sexuality of the indigenous peoples, and in a policy of social control incarcerated single women and older girls at night in conditions of poor sanitation in unhygienic dormitories. This practice contributed to high mortality. By the early nineteenth-century a gender imbalance developed in the mission populations, and had become worse by the time of secularization. Population figures give the appearance of periods of growth, but only expanded during periods of active recruitment and congregation of indigenous peoples from outside of the mission communities. The populations then dropped as the number of baptisms of converts declined. At the point of secularization, the populations of most of the missions had already begun to decline.31

Plate 6 An 1855 coastal survey map of ex-mission San Buenaventura that also documents several “Indian Ranchos” located in the bed of the nearby river. U.S. Coastal Survey, “Map of a Part of the Coast of California From San Buenaventura Southward to River Santa Clara 1855,” NOAA’S Historical Map & Chart Collection. In the public domain.
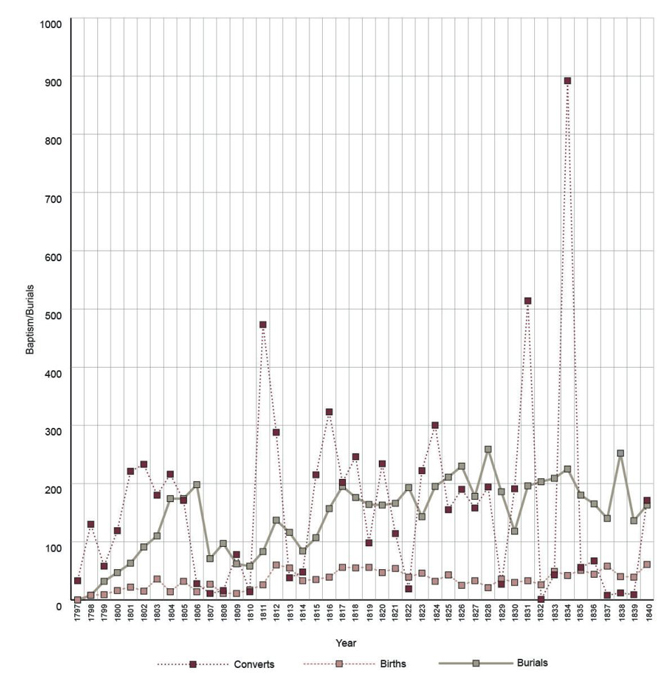
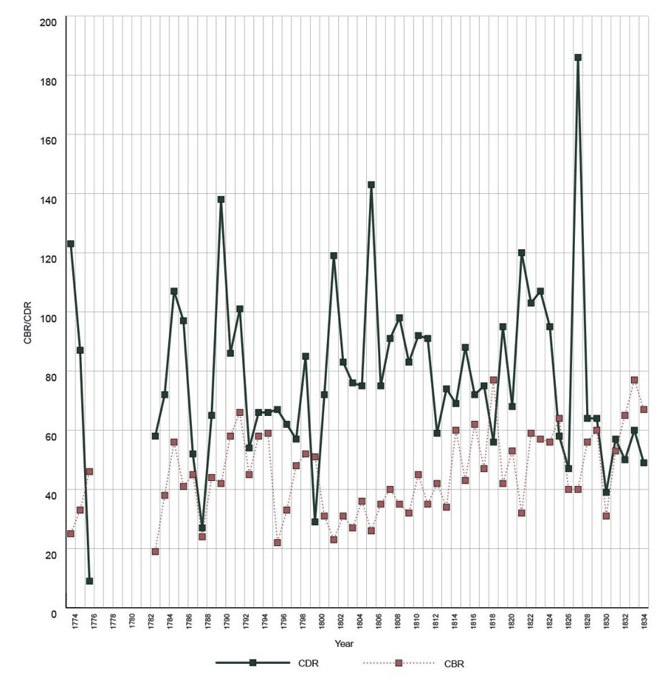
These patterns can be visualized in four case studies of baptisms and burials and crude birth and death rates on San Jose mission (established in 1797), Santa Cruz mission (established in 1791), San Carlos mission (established in 1770), and San Francisco mission (established in 1776) summarized in graphs5-12. All four cases show the ebb and flow of the congregation of non-Christians on the missions, and death rates higher than birth rates. It should also be noted that San Francisco mission, which was a major port, suffered catastrophic mortality in excess of 400 per thousand population during an 1806 epidemic, which was the highest death rate record on the California missions.32 The epidemic may have spread to the mission from a member(s) of the expedition of Nikolai Petrovich Rezanov, who came to California in search of food for the Russian-American Company settlements in Alaska, and particularly the settlement at Sitka. The Russians were in San Francisco from March to May of 1806.33

Graph 6 CRUDE BIRTH (CBR) AND DEATH (CDR) RATES PER THOUSAND POPULATION AT SAN JOSE MISSION, 1799-1835
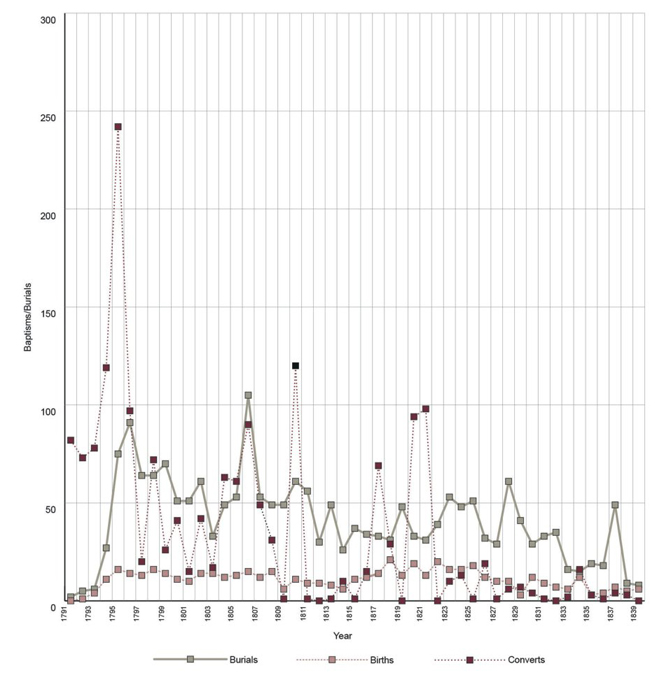

Graph 8 CRUDE BIRTH RATES (CBR) AND CRUDE DEATH RATES (CDR) PER THOUSAND POPULATION AT SANTA CRUZ MISSION

Graph 10 CRUDE BIRTH RATES (CBR) AND AND CRUDE DEATH RATES (CDR) PER THOUSAND POPULATION ON SAN CARLOS MISSION

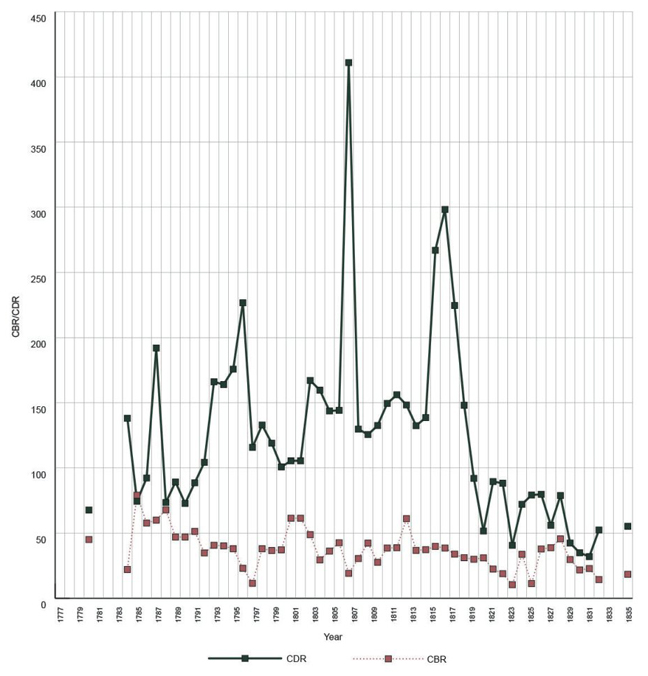
Graph 12 CRUDE BIRTH RATES (CBR) AND CRUDE DEATH RATES (CDR) PER THOUSAND POPULATION AT SAN FRANCISCO MISSION
One manifestation of demographic collapse on the missions was extreme gender and age imbalances as seen in the case of Santa Cruz mission. In the years 1791 to 1832, the Franciscans baptized 1 133 girls and women. In 1832, the female population was 87, or a mere 31 percent of the total (see table 2). Men could not easily find sexual partners, and a manifestation of this was the increasing number of widowers unable to find a sexual partner following the death of a spouse.34 The number of widows was between two and three percent of the population while the number of widowers, on the other hand, totaled 77 in 1828 which was 21 percent of the population.35
Table 2 FEMALE POPULATION AT SANTA CRUZ MISSION AS RELATED TO TOTAL POPULATION AND THE TOTAL NUMBER OF BAPTISMS OF FEMALES
| Year | Population | Female Population | Females % of Population | Total Baptisms to date |
|---|---|---|---|---|
| 1797 | 495 | 238 | 47 | 378 |
| 1813 | 398 | 139 | 35 | 789 |
| 1814 | 388 | 139 | 36 | 796 |
| 1820 | 461 | 175 | 38 | 950 |
| 1823 | 474 | 182 | 38 | 1 039 |
| 1824 | 461 | 184 | 40 | 1 060 |
| 1825 | 429 | 161 | 38 | 1 067 |
| 1826 | 428 | 167 | 39 | 1 087 |
| 1828 | 364 | 114 | 31 | 1 102 |
| 1832 | 284 | 87 | 31 | 1 133 |
The gender imbalance can also be visualized in the case study of the decline in the female population on five missions established among the indigenous communities collectively known today as the Chumash (see graph 13). The consequences of high infant mortality rates can be visualized as the number of children under the age of ten (párvulos) in relation to the total population at Santa Cruz mission (see graph 14). These patterns were different from those of San Lorenzo mission discussed above.

The demographic patterns of the non-indigenous soldier-settler population in California that lived on the four presidios -San Diego, Monterey, San Francisco, and Santa Barbara- and three pueblos -San Jose, Los Angeles, Branciforte- established in California were different from patterns on the missions.36 This can be visualized in the case of the population of Monterey Presidio -established in 1770-, where the number of births was consistently higher than that of deaths. In contrast to the missions, the presidio population experienced growth through natural reproduction (see graph 15), life expectancy was higher, and most children survived to adulthood, all different from demographic patterns on the California missions.37


Mission Urban Plan on Central Mexico Doctrinas
The two cases discussed above were examples of mission communities created from whole cloth. What occurred in cases where missionaries established missions on existing communities? This section examines the doctrinas or missions established among the sedentary indigenous populations in central Mexico in the decades following the Spanish conquest. In many instances, the missionaries established their doctrinas in existing communities, and at times on the sites of pre-Hispanic temples. In other cases, and particularly in the second half of the sixteenth century, indigenous leaders agreed to relocate community sites at the behest of the missionaries or royal officials. The case of the Dominican doctrina at Yucundáa (Oaxaca) provides an example of the early doctrina development, the organization of evangelization, and the subsequent relocation of the indigenous community to another site. The pre-Hispanic city was located on the top of a hill, as was the case of many settlements at the time of the conquest. Dominican missionaries arrived around 1538, and had a small primitive church and cloister built. Extensive archaeological excavations of the site uncovered the primitive doctrina complex, but also a mass grave dated to the time of a mid-1540s epidemic. In the early 1550s, the indigenous leaders and Dominican missionaries relocated much of the population from the hilltop site to a new community located in the valley at the base of the hill designated Teposcolula (see plate 7). This was an instance of the policy of congregación. Construction projects at the site included a new doctrina complex, a hospital for the indigenous population, and an aniñe or palace complex for the ruling lineage known today as the Casa de la Cacica (see plate 8).38
Some maps of relaciones geográficas prepared to accompany the reports drafted around 1580 documented the urban plan of the indigenous communities towards the end of the sixteenth century. Two examples are those of Texupa (Tejupan, Oaxaca) and Nochiztlán (Nochistlán, Oaxaca) (see plates 9 and 10). Both show communities organized on a grid plan, and, in the case of Nochiztlán, the Dominican doctrina is located on the main square of the community and perhaps on the site of an earlier pre-Hispanic temple. Large populations living in spatially compact communities facilitated the contagion, and in the sixteenth century a series of epidemics spread through central Mexico.
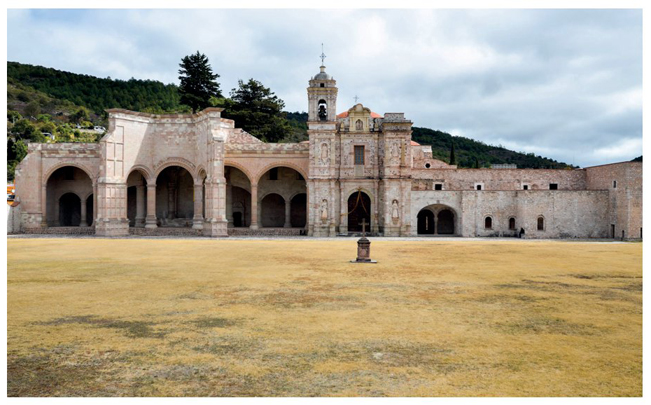
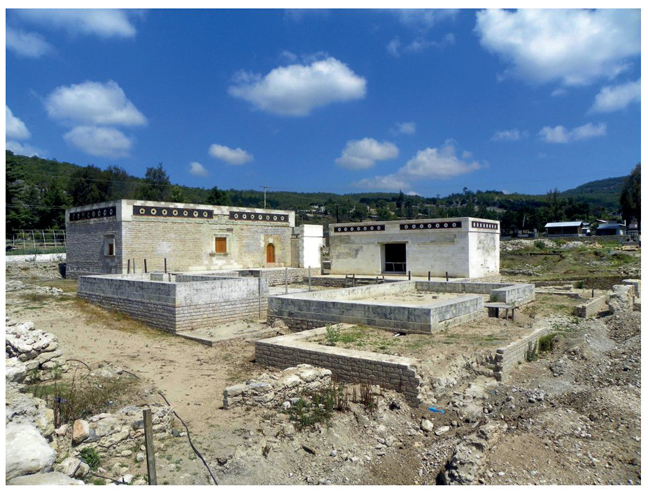

Plate 9 The map of relaciones geográficas of Texupa. Real Academia de Historia, Madrid. https://bibliotecadigital.rah.es/es/consulta/registro.do?id=15872. In the public domain.
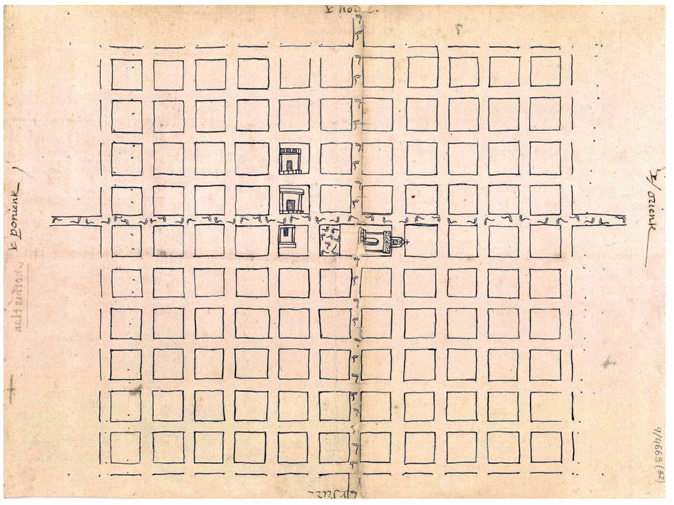
Plate 10 The map of relaciones geográficas of Nochiztlán. Real Academia de Historia, Madrid. https://bibliotecadigital.rah.es/es/consulta/registro.do?control=RAH20110000424. In the public domain.
The Augustinian administered community of Tlayacapan (Morelos) was typical. There were four calpulli or barrios located on an east-west and south-north axis in Tlayacapan at the time of the Spanish conquest, each of which had its own temple. The Augustinians had the main doctrina complex built on the site of the most important temple in the community, and barrio chapels on the site of the four calpulli temples. The urban plan of Tlayacapan was also a manifestation of the indigenous conceptualization of a sacred geography that incorporated alignments to sacred mountains marked by sightlines and astronomical events such as solar events that indicated, for example, the agricultural cycle.39 Mesoamerican communities also incorporated main streets with a south-north and east-west orientation, with the south-north being the more important. The two main streets usually crossed each other in the center of the community, as in the case of Tlayacapan. The chapel of La Exaltación, with a south-north orientation points to the southern end of the Mesoamerican south-north axis of the main street, and that of Santa Ana with a north-south orientation at the north. The chapel of Santiago with an east-west orientation marks the eastern end of the east-west axis, and that of El Rosario with a west-east orientation the west. During the Colonial period 26 barrio chapels were built in Tlayacapan, and 16 exist today. Each chapel is dedicated to the cult of a different saint, and a saint other than John the Baptist of the church of the main doctrina complex.40Barrio and visita chapels were local projects built on a smaller scale that required labor that in some cases was shifted to the construction of the main doctrina complex (see plate 11).
A second example is the neighboring community Atlatlahucan, which was also an Augustinian doctrina elevated to independent priory status around 1570.41 An analysis of the urban plan of Atlatlahucan also shows the Mesoamerican south-north axis of the main street similar to that of Tlayacapan, as well as the east-west street axis. The Augustinian doctrina complex dedicated to San Mateo was most likely built on the site of a pre-Hispanic temple at the center of the community (see plate 12). There are six capillas de barrio south of the doctrina complex on what was the main street that was on south-north axis, and today is Calle Guerrero (see plate 13). The same street continues to the north of the doctrina complex, and ends at the barrio chapel Los Reyes built on a north-south axis. The main street aligns with a mountain visible from the street, and that may have been a sacred mountain. The other barrio chapels have a Christian east-west orientation.
The south-north and east-west orientation and alignment was also related in the sacred geography to astronomical and particularly solar events that marked key dates in the Mesoamerican ritual calendar, and specifically in the agricultural cycle. One occurs in Acámbaro (Guanajuato) in mid-February, and marks the beginning of the Mesoamerican agricultural cycle. The Franciscan doctrina church has a south-north orientation, and not the traditional west-east Christian orientation. The solar event occurs with the first light of the morning as the sun rises from behind a hill and behind the chapel of the hospital de indios (see plate 14). The hospital chapel dates to the mid-sixteenth century on an east-west orientation, and was built on the site of a pre-Hispanic temple that most likely figured in the solar event. As the sun rises it illuminates the east-west oriented street, and what most likely was a sacred mountain located to the west. The chapel façade also incorporates pre-Hispanic iconography that depicts the sky, earth, and the underworld.42

Plate 11 The barrio chapel of San Andrés located to the south of the main doctrina complex. Photograph in the collection of the author.

Plate 12 The doctrina complex San Mateo Atlatlahucan showing the main street on a south-north axis that passed in front of the church and cloister. Photograph in the collection of the author.
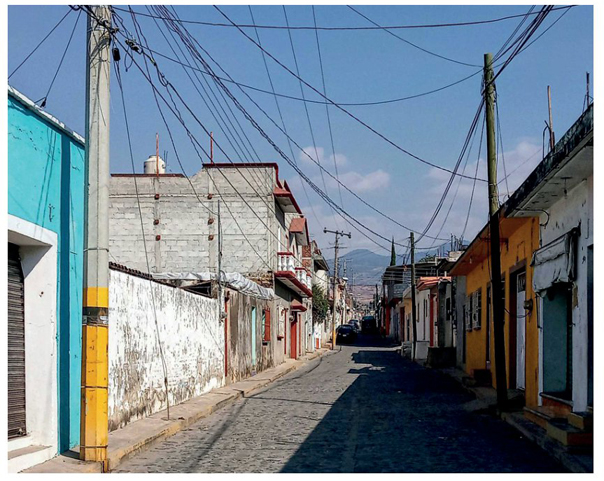
Plate 13 The main street Calle Guerrero in pre-Hispanic and colonial Atlatlahucan is located on a south-north axis. Photograph in the collection of the author.
A second example occurs in the Dominican doctrina church of San Juan Bautista Coixtlahuaca (Oaxaca), that was also built on the site of a pre-Hispanic temple. The last light of the day bathes the façade of the church, and sunlight enters the church from several sources and illuminates the statue of saint John the Baptist located on the main altar. This solar event occurs over a period of days, and is associated with the winter solstice. It would have been the intent of the architects who designed the pre-Hispanic temple to mark the winter solstice. It also occurs at Christmas, and the Dominicans would have used the solar event to mark this Christian date (see plate 15).

Conclusions
The contemporary mission diagrams offer a unique picture of what the fully-developed mission complexes looked like, and the sophistication of the mission urban plan that was an important element of the program of social engineering implemented on the missions. The new mission communities were to be developed on the grid plan and employ European architectural norms, and particularly as regarded housing for the indigenous peoples brought to live on them. Different architectural elements also reflected social policies implemented by the missionaries. One was the cotiguaçu where widows and orphans were housed. The missionaries were concerned about the sexuality of indigenous peoples, and promoted European ideals of sexuality and family formation. Widows who could not find a new husband were to be segregated from the general population to avoid the possibility of their having sexual relations outside of marriage. Similarly, the Franciscan missionaries in California were equally obsessed with indigenous sexuality, and had dormitories built for unmarried women and girls in an effort to limit sexual relations to couples joined by Christian marriage. The poor sanitation and unhygienic and crowded conditions in the dormitories contributed to a pattern of high mortality among women and girls, and a gender imbalance in the mission populations that became pronounced by the 1820s and 1830s.

Plate 15 The solar event in the Dominican doctrina church of San Juan Bautista Coixtlahuaca that marks the winter solstice and also occurs during Christmas. Photograph in the collection of the author.
The policy of congregating indigenous peoples on new communities and housing them in European-style accommodation in spatially compact villages had demographic consequences. Thousands of Guaraní lived in mission housing in an urban plan that facilitated the spread of contagion. Periodic epidemics reached catastrophic mortality levels, but the mission populations rebounded or recovered following outbreaks. Despite heavy epidemic mortality the mission populations did not evidence gender or age imbalances, and following outbreaks there was a pattern of the formation of new families as evidenced in increased numbers of marriages and high birth rates. On the California missions, on the other hand, the mission urban plan, housing arrangements, and the use of dormitories for unmarried women contributed to a pattern of chronic mortality and death rates that were generally higher than birth rates, and age and gender imbalances.
The first missionaries in central Mexico in the sixteenth century, on the other hand, established their missions in existing indigenous communities, although there were also instances where indigenous officials, royal officials, or the missionaries themselves relocated or combined existing communities in the policy known as congregación. The largely sedentary indigenous populations experienced demographic changes during the sixteenth century following the Spanish conquest. However, there are questions regarding estimates of the size of the population at contact, and sixteenth-century demographic patterns. Well documented case studies of demographic change, such as those discussed here, provide insights to better understand what occurred during the sixteenth century in central Mexico.

