


 nueva página del texto (beta)
 Inglés (pdf)
 Artículo en XML
 Referencias del artículo
 Enviar artículo por email
 Citado por SciELO
  Similares en
SciELO
Similares en
SciELO 
 Permalink
How does something like this ever start?1
1. INTRODUCTION
The collapse in lending, widespread dislocation in financial markets and sudden and long-term consequences for growth and unemployment brought about by the Global Financial Crisis (GFC, 2008-2009) led to significant regulatory changes in the financial system2. In the post-crisis period, changes in the way banks operated (banks in the United States -and especially global ones- substantially reduced their leverage and their holdings of derivatives, while increasing their capital and improving their quality) coupled with rising profitability fueled optimism about maintaining the stability of financial institutions and, in general, of the financial system3.
This illusion crumbled when the iconic institution serving technology startups and venture capital firms and 16th largest bank in the nation, the Silicon Valley Bank Financial Group (SVBFG) experienced what looked like a classic bank run and failed within less than 48 hours (8-10th March 2023). This represented the second-biggest bank failure on record since 1934. While SVBFG was a mid-sized bank (not a systemically global bank) its contagion effects were felt, nonetheless, throughout the United States and global financial systems4.
Two days after the failure of SVBFG the New York based Signature Bank (the 29th largest bank in the country) went also ‘under the tank’. Also capital injections by private banks and the Federal Reserve were required to keep the San Francisco-based First Republic Bank (the 14th largest bank in the United States) afloat. Between the second quarter of 2022 and the first quarter of 2023 credit lending by commercial banks in the United States experienced one of the biggest declines since the 1970s. At the international level, Credit Swiss also benefited by a large capital injection by the government following a collapse in share prices5.
The SVBFG episode provides a unique opportunity to revise the theory and practice of bank runs (the sudden demand for redemption of bank debt for cash affecting a single bank)6 which have been a recurrent event in the United States financial history since the Great Depression including during the 1980s the Savings and Loan (S&L) crisis, the GFC, and more recently in 2023. An analysis of these episodes shows that, with all their specificities, runs display a common pattern.
Runs are endogenous to situations of perceived insolvency (the liquidation value of assets exceeds the value of liabilities) of financial institutions. The perception of insolvency is generally provided by some reliable source (such as for example a well-established newspaper, a stock market/bank financial report, or by sophisticated investors)7.
The insolvency concerns result from the adoption of risky practices by financial institutions driven by the profit motive within a context of lose/inadequate regulation or deregulation. This is not only characteristic of boom conditions. It can also occur in the downward phase of the business cycle as financial units try to protect themselves from financial losses.
Risky practices enhance the mismatch between assets and liabilities while at the same time make financial institutions more vulnerable to changes in external conditions. This generally includes changes in interest rates but also changes in prices of underlying assets (real estate property prices and commodity prices). These changes in external conditions strain further the asset/liability mismatch.
Runs tend occur in institutions whose deposits are not insured or where the insurance fund is insufficient to cover all the deposits. Yet once a run starts the guarantee of deposits is insufficient, by itself, to stop de run. More importantly, the question remains as to whether depositors would want to keep their money in an institution that is perceived to be insolvent even if the deposits were fully guaranteed.
Three of the four approaches to bank runs in mainstream economics (the coordination failure, the asymmetric information, and the ‘fundamentals’ approach)8 fail to capture these common stylized facts and provide implausible stories about bank runs. This results mainly from the fact that these approaches are based on a characterization of an economy that resembles a cooperative economy where all resources are shared equally by all participants rather than an entrepreneur economy whose end-motive is profit making9. This context leads to a misrepresentation of the nature of banks and banking activity. It also leads to place excessive weight on deposit insurance as an antidote to runs.
The paper is divided into seven further sections. The second presents some stylized facts of emblematic bank runs that occurred during the 1980s, during the GFC and the more recent bank run of SVBFG. The third section explains the main tenets of the coordination failure, the asymmetric information, and the ‘fundamentals’ approaches to bank runs, underscoring their fundamental hypothesis. The fourth, fifth and sixth sections provide a critical analysis of these views. Section seven addresses the role played in runs by deposit insurance and lender-of-last resort interventions. Section eight concludes.
2. BANK RUNS AND BANK FAILURES: SOME STYLIZED FACTS
The occurrence of bank runs and bank failures and how to prevent them is a recurrent policy issue. Available evidence for the United States shows that the number of bank failures between 1921 and 1929 reached 5,715 (635 per year). During the Great Depression (1929-1933) the number of failed banks increased significantly numbering 9,00010. The establishment of the Federal Deposit Insurance Corporation (FDIC) in 1934 did not put an end to bank runs and failures but contributed to reduce their occurrence11.
The number of bank failures for the period 1934-2023 affected 4,106 institutions. The largest number of bank failures were registered in the periods 1979-1994 and 2008-2014 (Table 1).
Table 1 Indicators of bank failures in the United States (1934-2023)
| Total number | Average number per year | Minimum number (year) | Maximum number (year) | Total assets held by failed banks (US$ millions) | |
| 1934-1942 | 390 | 43 | 9 | 75 | 130 |
| 1943-1978 | 162 | 5 | 1 | 17 | 9,841 |
| 1979-1994 | 2,945 | 184 | 10 | 534 | 923,217 |
| 1995-2007 | 58 | 5 | 1 | 11 | 12,206 |
| 2008-2014 | 520 | 74 | 18 | 157 | 3,912,762 |
| 2015-2023 | 31 | 5 | 2 | 8 | 339,729 |
| Total | 4,106 | 5,197,884 |
Source: FDIC (2023a) and Desilver (2023).
2.1. Continental Illinois and the S&L crisis12
The period 1979-1994 registered 2,945 bank failures with US$ 923,217 million in total assets held by failing banks. Some of the failed institutions included commercial banks such as Penn Square Bank of Oklahoma (July 1982) which caused a contagion effect on other banks including Chase Manhattan Bank, Continental Illinois National Bank, Michigan National Bank, Northern Trust Company, and Seattle first National Bank leading them to experience losses. Continental Illinois National Bank (the 10th largest bank at the time), which experienced a run on its deposits (May 1984), was the most exposed as it had purchased $1 billion in participations from Penn Square. Continental Illinois was also affected by Mexico’s debt default in 1982 due to its loans to entities in developing countries.
The consequent decline in income which was published in the same year in its earnings release led to a downgrade of its credit and debt ratings by the major rating agencies. The loss in confidence in the domestic market prompted the bank to raise funds in the Eurodollar market. These represented up to 40% of its total deposits in the first quarter of 1984. By this time Continental Illinois was also highly dependent on market instruments (repos) and fed finance. Most important selected financial indicators (loan-to-assets, delinquencies as percent of loans, net income as percent of equity, loan loss provisions as percent of assets) show that Continental Illinois was riskier and more exposed to default than other major banks at the time (Table 2).
Table 2 Continental Illinois in comparison to other large banks: Selected risk indicators. First quarter 1984
| Financial indicator | Continental Illinois | Median | 25th percentile | 75th percentile |
|---|---|---|---|---|
| Delinquencies as percentage of loans | 9.16 | 3.62 | 2.5 | 5.26 |
| Loan loss provision as percentage of assets | 0.46 | 0.12 | 0.09 | 0.19 |
| Net income as percentage of equity | 1.46 | 2.83 | 2.19 | 3.36 |
| Foreign deposits as percentage of liabilities | 48.67 | 33.59 | 22.41 | 43.01 |
| Fed funds and repo as percentage of liabilities | 13.36 | 8.51 | 6.16 | 12 |
| Loans as percentage of assets | 73.12 | 63.81 | 56.96 | 67.19 |
Note: Median, 25th and 75th percentile refer to other 19 largest banks.
Source: Carlson and Rose (2016).
The run-on Continental Illinois began with rumors of insolvency coupled with a denial (“Totally preposterous”) on the part of the bank. However, prior to the run Continental publicized its increase in non-performing loans and, also, the insolvency rumors appeared in the Dow Jones Capital Markets Reports giving credence to this possibility. The run materialized when foreign depositors (i.e., foreign banks) withdrew their multimillion deposits from Continental Illinois. The bank’s financial troubles were eventually resolved through massive liquidity support by the Federal Reserve and other banks and eventually by an FDIC capital infusion (1$ billion dollars) and the purchase of a part ($5.1 billion dollars) of its poor-quality loans (FDIC, 1997b).
During the 1979-1984 period most failures involved Savings and Loans Associations. This is the reason why this period is referred to as the Savings & Loan (S&L) Crisis (half of the savings and loans institutions went bankrupt). The most important causes of the S&L crisis include the sharp rise in short-term interest rates in the 1970s and especially in the 1980s, financial deregulation, and the deterioration of the quality of their assets.
The rise in the short-run rate of interests in the 1970s and the 1980s reduced the spread between long-term loans at fixed rates (the traditional form of the mortgage contract in the United States and which prevailed until the early 1980s) and short-term rates of interest which reduced the profitability of S&L institutions. The difference between the average 30-year fixed rate mortgage and the effective federal funds rate witnessed a pronounced decline at the beginning of the 1980s (turning negative between September 1979 and April 1980 and between November 1980 and August 1981).
Between 1981 and 1982, S&L institutions saw a decline of 25% of their net worth and the worst financial operating result since the establishment of deposit insurance. Since the costs of restructuring failing institutions (US$25-$100 billion) largely surpassed the financial resources of the Federal Savings and Loan Insurance Corporation (FSLIC) [US$ 6 billion] the authorities opted to relax regulatory requirements (regulatory forbearance). This included the removal of all rate ceilings (The Monetary Controls Act of 1980), the authorization of money market deposit accounts, the provision for the purchase of net worth certificates by the FDIC from troubled institutions that would be counted as capital (Garn-St Germain Act of 1982) thus inflating their net worth and, also, the expansion of business lines of S&L institutions13.
Deregulation was an important factor (jointly with the increase in the number of newly chartered banks, the conversion of savings banks for mutual to stock ownership, and the ‘loss of a sizable portion of the commercial and industrial lending business to the commercial paper market’) in increased competition among banks which led banks to turn to the real estate market (because it generated immediate income in the form of up-front fees) and adopt riskier lending practices.
A third cause of the S&L crisis is the deterioration in the assets of these institutions. According to Brewer (1989) between 1980-1988, 488 S&L institutions closed or merged, of which 30% occurred between 1980 and 1985 as a result of the spike in short-term interest rates.
The failures that occurred thereafter are traced to a deterioration in asset quality. This in turn is explained, in part, by the decline in oil prices and most importantly by the boom-and-bust cycle in the commercial real estate industry. During the 1980s, investment in commercial real estate increased by 57% with respect to the 1970s. Between 1975-1979 and 1980-1990, the annual average value of new non-residential construction rose from $71 to 108 billion.
Also, the completion of new office space increased from 33.6 square feet in the period 1975-1979 to 100.7 square feet in the period 1985-1989. Concomitantly real estate lending and commercial real estate lending rose from $269 and $64 billion in 1980 to $830 and $238 billion in 1990, respectively. This resulted in a rise in the share of real estate loans as a percentage of total assets (17.8% and 27.1% for the same years).
This was accompanied by a deterioration of the quality of banking loans. Non-performing loans as a percentage of total loans increased from 3.1% in 1984 to 5.2% in 1991. This situation left those financial institutions that participated actively in real estate market (and those already weakened by the rise in interest rates) vulnerable to a change to a downturn in property prices. The available evidence shows that failed institutions saw their share of commercial real estate loans increased from 6% in 1980 to 30% in 1993.
Not only did the S&L crisis register the highest number of bank failures but also the most widespread run on depository institutions since the Great Depression (March 1985). The run was triggered by the publicized losses (amounting to $150 million dollars) of Ohio’s largest privately insured savings and loan institution, the Home State Savings Bank of Cincinnati (Home State)14. The losses were a consequence of the heavy exposure of Home State (roughly 50% of its loans) to the failed securities dealer ESM Government Securities. The potential contagion effects of the run on Home State threatened 4.3 billion dollars in deposits of half a million depositors at 71 thrift institutions, most of which were in poor financial conditions.
The run was contained through a wide set of interventions including: “… discount window borrowing to satisfy deposit withdrawal (The 71 endangered thrifts were not federally regulated or insured. They were insured by the Ohio Deposit Guarantee Fund whose assets amounted only to $130 million dollars), intensive information gathering to monitor the run, carefully managed communications with the public, the declaration of a bank holiday for the thrifts, emergency stat legislation, and an intensive effort to bring the Guarantee Fund-insured thrifts under federal deposit insurance.”15
2.2. The global financial crisis
The second largest wave of bank failures (2008-2014) occurred as a result of the GFC. The crisis mainly concentrated on the large bank holding companies and investment banks (considered systemic banking institutions) such as Lehman Brothers, Merrill Lynch, Morgan Stanley, Goldman Sachs and Bear Sterns16.
Between the first quarter of 2006 and the second quarter of 2009 large bank holding companies accounted for 76% and 73% of all commercial bank assets and loans respectively. The non-systemic banking institutions (489) that failed during the GFC held assets estimated at $768 billion dollars17. Five non-systemic failed banks [IndiMac, FSB (IndyMac), Washington Mutual Bank, Downey Savings and Loan] accounted for more than half of the non-systemic failed bank assets ($416 billion). The single-family residential loan portfolio (SFRP) represented on average 66.2% of their total assets leaving these banks highly exposed to changes in the financial conditions in residential mortgages.
Off balance sheet funding practices provided the basis for the gestation of the crisis and for the bank runs that occurred during this period. The purpose of off-balance sheet practices is ‘asset deconstructing’ through the creation of a financial asset structure, ‘bankrupt remote’, that is, legally independent of the risk, quality or continued existence of the originator of the assets in question.
In this way off balance sheet practices were able to seemingly separate the risk of investing in an asset or asset backed security (financial risk) from the risk associated with the originator of the asset or security and even with the risk of the asset or security themselves (real risk)18. This practice allowed the transformation of risky assets (such as subprime mortgages) into ‘safe and high credit rated securities.’ At the same time, the deconstruction of a financial institution into an on-balance (the institution itself) and an off-balance institution (the special purpose vehicle, SPV) allowed the former (through the transfer of income receipts from the off-balance institution) to have access to an untapped access to finance and liquidity, without showing at the same time, the corresponding debt on their balances.
The effects of these practices on balance sheet size and aggregate liquidity were amplified by high leverage and pro-cyclical leverage management. Relying on leverage entails greater risks (greater indebtedness) but at the same time they also create significant profit opportunities since the higher is the leverage ratio the higher is the rate of return over equity19. Pro-cyclical leverage management entails the propagation of contagion through cumulative asset price inflation and deflation20.
Investment banks that tended to rely on leverage increased their leverage levels upwards (21 to 30 on average) prior to the GFC (November 2001-November 2007) increasing the proportion of assets financed by debt from 95% to 98%. Thereafter, they reduced their deleveraged (30 to 34 between November 2007 and April 2008). This was accompanied by a contraction in the value of assets of 20% on average for investment banks21.
In the same way that high leverage ratios can yield high profits in the upward phase of the cycle, the shift to lower leverage ratios in the downward phase of the cycle can entail significant losses as financial institutions struggle to pay down their debts by selling assets becoming systemic if it is a widely adopted practice. Asset price deflation can have significant effects on liquidity as the reductions in equity and contractions in balance sheets undermine the capacity of banks to lend. Hence, the stage is set for a ‘credit crunch.’
This modus operandi of the financial system explains why the effects of the subprime crisis as property prices fell (30% between 2006 and 2008) far outstripped the initial losses which amounted to only roughly US$ 400 billion22. The subprime mortgage sector is a small component of the residential sector, mostly of lower incomes (roughly 20% of all mortgage loans and 4% of all United States assets in 2007). The cumulative declines of United States real estate wealth and the stock market capitalization values that followed the subprime crisis reached roughly US$ 1 and 7 trillion dollars respectively.
These working mechanisms of the financial sector within a context of deregulation set the stage for some of the most emblematic runs that occurred during the GFC, including Bear Sterns (systemic financial institution), IndyMac (non-systemic financial institution) in the United States and Northern Rock outside the United States.
Bear Sterns had a large portfolio of real-estate related assets and IndyMac was a mortgage lender. With the significant decline in home values that began in November 2007 IndyMac was not able to generate sufficient income to service its debt. In May 2008, the possibility of Indy Mac’s bankruptcy was made public. The combination of poor assets quality and high debt led to a run on Bear Sterns. The run on Northern Rock was triggered by the liquidity crisis in short-term funding. It was only after the Bank of England announced that it would provide emergency liquidity support to Northern Rock that the run materialized.
2.3. The SVBFG23
The most recent bank runs of 2023 involved Silicon Valley Bank Financial Group (SVBFG), Signature Bank and First Republic. SVBFG “provided financial services to both emerging growth and mature companies in the high technology and life sciences sectors with a focus on attracting early-stage or start-up companies as clients and retaining those companies as clients as they grow through the various stages of their cycles.”24 Nearly one-half of venture-backed technology and life sciences companies in the US was dependent on SVBFG for finance.
The SVBFG bank run (March 2023) shares many similarities with past episodes. Deregulation (the weakening of the Dodd Franck Act) act paved the way for the bank run. SVBFG experienced a significant growth in assets prior to the run (718 and 212 billion dollars in 2019 and 2022). More than half of its assets were held in securities and most of those securities were long-dated held-to-maturity (HTM), government or agency-issued mortgage-backed securities which made SVBFG’s finances highly dependent of variations in long-term interest rates.
The increase in short-term interest rates (the federal funds rate increased from 0.08% to 4.57% between the 7th of March 2002 and the 6th of February 2023) coupled with quantitative tightening led to an increase in long-term rates of interest and consequent declines in long-term assets. During this period long-term (10-20 year and 20+ year) treasury bonds lost between 25% and 30% of their market value. The fact that most of the securities were classified as HTM meant that they could be carried at amortized historical cost rather than at their fluctuating mark-to-market value severely limited the ability of the SVBFG to adjust its portfolio in the face of changing financial conditions. And in fact, the classification of securities as HTM hid losses when rates of interest increased. One last characteristic of SVBFG is that the bulk of its deposits (94%) were uninsured as they exceeded the $250,000 FDIC threshold. However, as explained in a subsequent section, the run occurred mainly because the SVBFG became insolvent (the liquidation value of its assets was below that of its deposits) and the depositors were sophisticated enough to understand the situation.
In a nutshell, the events unfolded as follows. SVBFG experienced a decline in deposits in the fourth quarter of 2022 and in January-February 2023. To respond to the deposit withdrawal SVBFG decided, at the beginning of March (8th of March), to increase its capital base. At the same time the financial institution decided to sell around 21 billion dollars in long-dated securities which resulted in an accounting loss of 1.8 billion dollars. This implied that these assets could no longer be considered HTM and as a result the ‘hidden losses’ crystalized. On the same day. Moody downgraded SVBFG. This prompted venture capitalists and prominent start-up investors to urge their portfolio companies to withdraw their funds. This materialized in the attempt to withdraw 42 million on March the 9th. The following day SVBFG was shut and the institution was assigned to FDIC as the receiver. On the 12th of March the US government announced that all SVBFG deposits were insured.
3. MAINSTREAM MODELS OF BANK RUNS25
Mainstream economics have attempted to explain the bank run and capture its dynamics through four different approaches: The coordination failures, asymmetric information, the fundamentals, and the leverage approaches. The bank run stories told by the coordination failures, asymmetric information, and the ‘fundamentals’ rarely fit the pattern observed in real world bank runs26.
3.1. The coordination failure approach
This approach is best exemplified by the Diamond and Dybvig (1983) [DD] model. According to this model runs and panics are triggered by random withdrawals by self-fulfilling beliefs27. The model has the following features:
The model has three (0, 1 and 2) periods, one single homogeneous good and two types of consumers.
Consumers at period 0 are identical and at the beginning of period 1 they learn whether they only care about consumption in period 1 or in period 2. Each consumer gets an endowment of 1 unit of the homogeneous good in period 0. The consumers that only care about consumption in period 1 and withdraw their deposits get a fix claim per unit deposited. The consumers that only care about consuming in period 2 receive a rate of return above that of the fixed claim per unit deposited.
Agents have a random need for liquidity derived out of their random need at date 1 or 2 as the result of the realization of a preference shock (each consumer has private information about its own needs for liquidity).
Banks have an explicit role to perform: The transformation of illiquid assets into liquid liabilities such that consumption occurs is in line with the realization of agent’s preferences. That is, they are consumption smoothers.
At the same time that the transformation service provides the rationale for the existence of banks, it makes them vulnerable to runs because long-term investments are costly to liquidate.
There is no stock market or markets in bank liabilities.
The model posits the existence of a sequential service constraint which implies that the depositors withdraw their funds one after the other until the bank runs out of cash. As explained by Calomiris (2000, p. 108): “If agents think that other agents think there will be many withdrawals, then agents at the end of the sequential-service line will suffer losses. Thus, all agents, seeking to avoid losses associated with being at the end of the line, may suddenly decide to redeem their claims, causing the very event (bank run/panic) they imagined.”
3.2. The asymmetric information approach
A second type of interpretations focuses on asymmetric information. This refers to the advantage in the set of information of one group of agents over another. In an imperfect world the better-informed group will exploit its information advantage for its own benefit. The existence of asymmetric information occurs between depositors and banks concerning the latter’s financial performance and the financial state of their portfolios.
The story of a bank run and potential panic is as follows. Somehow, depositors obtain or observe financial information that leads them to revise their perception about banks performance. Their inability to distinguish between financially sound and unsound banks leads depositors to withdraw deposits from all banks. The run forces banks to reveal their financial situation thus making it possible to differentiate between banks that are solvent from those that are insolvent.
According to the asymmetric information interpretation, the run is an efficient mechanism to monitor the performance of the banks, an efficient way to solve the asymmetry of information through collective action. The efficiency of this mechanism derives from the low monitoring costs that banks possess relative to high costs incurred by some depositors to evaluate the solvency/insolvency of banks.
3.3. The fundamental approach
A third type of interpretation attributes bank runs to “… a natural outgrowth of weak fundamentals arising in the course of the business cycle.” (Allen and Gale, 2007, p. 83). Bank runs do not occur due to random events or as a way to force banks to reveal their financial information. They are a rational response of economic agents to deteriorating financial conditions that tend to occur during the downward phase of the economic cycle. In a recession/contraction the quality and value of assets tend to deteriorate and as a result banks may not meet their financial commitments. When depositors anticipate an economic downturn, these will fear that the banking system will experience difficulties and thus will try to withdraw their funds.
This view makes three important assumptions: 1) depositors must get a perfectly informative signal about the state of the economy; 2) banks serve their depositors according to the equal service constraint (during a run all resources are shared equally among all depositors); 3) banks are exogenously constrained to offer an incomplete deposit contract (that is, the amount of the deposit and of consumption is independent of the state of the economy).
4. MAINSTREAM MODELS OF BANK RUNS: THE ANOMALIES BETWEEN PRACTICE AND THEORY28
None of these approaches are able to explain the occurrence of bank runs as observed in practice nor their recurrent character. As illustrated in section 2 bank runs are generally due to insolvency concerns rather than to random signals (i.e., sunspots) as in the coordination failure view which the approach cannot explain.
But insolvency concerns and runs are not a way to force banks to reveal their financial statements as in the asymmetric information interpretation. In fact, as argued in the case of Continental Illinois, the Ohio Home State or in the case of the SVBFG, it is the revelation of actual or potential losses by financial institutions which causes the run. The same is true of some of the emblematic bank runs during the Global Financial Crisis. As put by Shin (2009, p. 102) in the case of the Northern Rock: “The Northern Rock depositor run, although dramatic on television, was an event in the aftermath of the liquidity crisis at Northern Rock, rather than the event that triggered its liquidity crisis.”

Note: ROE is an average for all FDIC banks. Source: FRED (2023) and FDIC (2023b).
Figure 1 Evolution of the S&P/Case-Shiller U.S. National Home Price Index, Gross Domestic Product (GDP) growth and Return on Equity (ROE) of FDIC for the United States (January 2001-June 2010). Quarterly data
Also, rather than being related to the real business cycle as claimed by the fundamental view, they are correlated with the financial cycle and the financial cycle need not reflect fundamentals. Both the run on Bear Sterns in April 2008 and the run on IndyMac in July 2008 are related to the decline in home prices which started long before the decline in output caused by the Global Financial Crisis.
According to the S&P/Case-Shiller U.S. National Home Price Index, home prices began to contract in September 2005 reaching a trough in March 2009 (-12.7% with respect to the previous year). Both banks had a large portfolio of real estate-related assets and thus were highly vulnerable and experienced significant reductions in the value of their assets with the consequence balance sheet mismatch. As shown in Figure 1, the decline in real estate prices (and thus the deterioration of banks’ balance sheets) as well as the concomitant reduction in bank profitability (ROE) preceded the downturn in real economic activity.
Northern Rock’s financial position was significantly affected by the global credit crisis triggered in the summer of 2007 as it relied significantly on short-term borrowing on the international capital markets. According to Shin (2009), in the summer 2007 only 23 of its liabilities were retail deposits.
The SVBFG was also vulnerable to changes in financial conditions in particular to variations in interest rates without their being a downturn in economic activity. In the fourth quarter of 2022 securities represented 55% of total assets and held-to-maturity securities accounted for 78% of total securities. These percentages were much higher than those of large banking organizations (25% and 42% respectively) [Table 3].
Table 3 Selected financial indicators for SVBFG and large banking organizations. Fourth quarter 2022
| Metric | SVBFG | Large banking organizations |
|---|---|---|
| Loans as a percentage of total assets | 35 | 58 |
| Securities as a percentage of total assets | 55 | 25 |
| Held-to-maturity securities as a percentage of total securities | 78 | 42 |
| Total deposits as a percentage of total liabilities | 89 | 82 |
| Uninsured deposits as a percentage of total deposits | 94 | 41 |
| Common equity tier 1 capital as a percentage of total risk-weighted assets | 12 | 10 |
Note: The values for large banking organizations are weighted averages of all U.S bank holding companies and savings and loan holding companies with total assets above $100 billion.
Source: Board of Governors of the Federal Reserve System (2023, p. 23).
5. AN ENTREPRENEUR VERSUS A COOPERATIVE ECONOMY
A major reason why the mainstream approaches provide accounts that have little to do with bank runs in practice is their failure to include the major motivation of economic activity (including in banking and finance), that is, the profit motive. Instead in these approaches consumption is the driver of economic activity, and their analysis is grounded in a ‘cooperative economy’ world. As explained by Keynes (1973, p. 77) a cooperative economy is one in which: “… the factors of production are rewarded by dividing up in agreed proportions the actual output of their co-operative efforts.” One major implication is the identification of depositors with consumers.
This can be exemplified by the canonical coordination failure model (Diamond-Dybvig, 1986). The DD model has a good and a bad equilibrium. In the good equilibrium, banks satisfy the demand for liquidity at time 1 and 2 provided not all consumers withdraw funds at time 1. This equilibrium is an optimal allocation as the supply of liquidity responds to match exactly consumers consumption preferences at time 1 and 2. That is everyone gets what they deserve. The bank maximizes its objective, the welfare of the depositor and consumers time their withdrawal to maximize their consumption. As explained by Haltom and Sultanom (2018, p. 2) using a more extreme case:
You put $100 into a bank account that earns an expected return of 10 percent at the end of one year. You also know that if the other depositor withdraws early, the bank’s resources will be depleted such that your payout is only $90. The other depositor faces the same conditions. However, the probability that the other depositor will need the resources early is low, so as long as both depositors withdraw only when they truly need liquidity, the expected return of keeping the money in the bank is close to 10 percent. One possible outcome is exactly this: You both keep your money invested and earn $110 at the end of the year when the investment project is complete and pays out.
The second equilibrium (that of the bank run) is costly as it reduces social welfare by terminating productive investment and interrupting production. It destroys optimal risk sharing and thus the very foundation of a cooperative economy. This is the reason why the bank run equilibrium is a bad equilibrium. Deposit insurance can forestall a bank run and thus ensure that a cooperative equilibrium (i.e., the good equilibrium) is the result of the workings of a market economy.
In an entrepreneur economy the objective of economic activity is to ‘part with money in order to obtain more money. An entrepreneur is interested not in the amount of product, but in the amount of money that will fall to his share’ (Keynes, 1979, pp. 81-82). The same rule of behavior applies to banks and bankers which take on more risk in exchange for higher returns. The search for profits, rather than the desire to maximize depositors’ welfare, explains the reason why banks become over time exposed to speculative and Ponzi liability structures.
The profitability of a financial institution, the rate of return on equity (ROE), depends on the combination of leverage or equity multiplier (L) and the rate of return on assets (ROA):
In turn ROA is a function of net interest income (NIM), non-interest income (NII), non-interest expenditure (NIE), security gains (SG), provisions for loan losses (PLL) and taxes paid (T) all expressed in terms of assets (A):
As explained in the subsection on the GFC, leverage or the equity multiplier is the key variable to increasing profits29. This at the same means that the growth in profits is dependent on the capacity to increase indebtedness and to service those debts. Thus, higher levels of vulnerability are the other side of the coin to increasing profits.
Only the profit motive can explain why within a short time span (2019-2021) SVBFG tripled in size as its assets increased from $57 to $211 billion dollars (which led to a 56% surge in net income) and changed the composition of its assets from cash to held-to-maturity securities becoming increasingly vulnerable to changes in financial conditions. The same applies to the Continental Illinois story.
From a longer-term perspective, the same logic explains the thrust to relax regulation and eventual deregulation which allowed financial institutions to transit toward riskier practices. In the case of the United States the expansion of financial intermediaries’ possibilities to extend loans and to borrow was extended through several means. These include the relaxation of geographical and activity limitations on bank holding companies and new regulatory interpretations of existing law. They also comprised the expansion of activities of depository institutions to allow them to act like commercial banks, the repeal of the separation of commercial and investment banking imposed in the Banking Act of 1933, and the creation of new entities within the financial sector such as private equity firms and hedge funds.
The Gramm-Leach-Bliley Act (GLBA, 1999) repealed the Glass-Steagall Act which removed restrictions conglomeration and facilitated banking concentration30. The Commodity Futures Modernization Act (2000) which preceded the 2007 crisis. The Act established a series of provisions affecting the regulatory and supervisory roles of the Commodity Futures Trading Commission and the Securities and Exchange Commission. At a practical level however, the act shielded the market for derivatives from federal regulation and thus inevitably led to riskier financial practices.
The profit motive also ultimately explains the tendency towards concentration over time within the financial industry since the mid-1980s due to failures and to consolidation through mergers and acquisitions. The number of commercial banks in the United States which stood at 14,434 at the beginning of the 1980s declined to 8,315 in 2000 and to 4,136 in 2022. At the same time the concentration of assets has steadily increased. Between 1996 and 2023, the share of total assets of FDIC banks held by those banks whose assets are greater than $250 billion dollars increased from 5% to 56% (Figure 2).
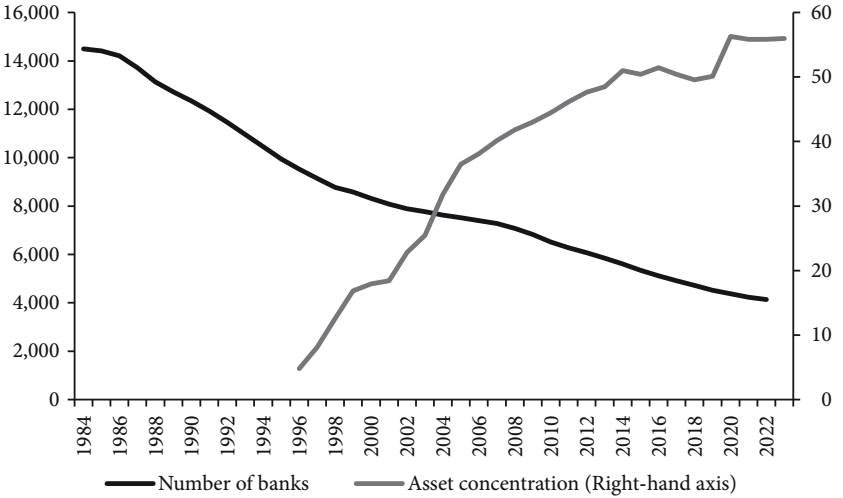
Note: Asset concentration refers to the percentage of total FDIC bank assets held by banks with assets above $250 billion. Source: On the basis of FDIC (2023b).
Figure 2 Evolution of asset concentration and number of banks for FDIC U.S. banks 1984-2022
In addition, the increasing asset concentration coincides with the years of high profitability (1990-2006, the fat years) and with the rise of profitability following the Global Financial Crisis (2010-2023). The positive association between number of banks, assets concentration and profitability is not necessarily cyclical (Figures 3 and 4).

Note: Asset concentration refers to the percentage of total FDIC bank assets held by banks with assets above $250 billion. ROE for largest banks refers to the average for banks with assets above $250 billion dollars. Source: On the basis of FDIC (2023b).
Figure 3 Asset concentration and ROE for largest banks and average of all FDIC banks of the U.S.

Source: On the basis of FDIC (2023b).
Figure 4 Evolution of ROE and GDP growth for the U.S. 1984q1-2022q4
6. THE MISREPRESENTATION OF THE NATURE OF BANKS AND OF BANKING ACTIVITY
The lack of distinction between a cooperative and an entrepreneur economy has led to a misrepresentation of the nature of banks and of banking activity. As mentioned above the mainstream views the central general objective of banks is to maximize depositors’ welfare providing liquidity according to their preferences and utility maximization functions. At a more granular level banks provide services on the asset and liability sides that other financial markets cannot supply.
On the asset side, banks monitor borrowers and provide information about credit risks. This requires that bank loans which are created by the bank be non-marketable or illiquid. As explained by Calomiris (2000, p. 116): “If the loan could subsequently be sold, then the originating bank would not face an incentive to monitor or produce information. This argument depends on the banks’ activity being unobservable (there is information asymmetry), so that the only way of ensuring that banks undertake the activities they promise is by forcing them to maintain ownership of the loans they create (the illiquidity of assets makes them costly to liquidate). This need for incentive compatibility makes loans nonmarketable.”
On the liability side, the main function of banks is to provide liquidity. Contrary to the case of assets there is no common agreement on the meaning of liquidity. Demand deposits are the vehicle for turning illiquid (i.e., loans) into liquid assets. Banks can also offer liabilities “with a different, smoother pattern of returns over time than the illiquid asset offer.” (Diamond and Dybvig, 1983, p. 403). In this sense banks have the function to provide insurance allowing agents to consume when they most need to. But banks are vulnerable to bank runs since deposits are uninsured. Hence the need for deposit insurance. For the asymmetric view, liquidity is a matter of degree. It refers to the ease with which a security is valued and traded in the market.
A crucial question is whether this characterization of banks and of the nature of banking has some correspondence to the stylized features of the real-world financial institutions that experience banks runs. In the real world, banks do not come into existence or operate as isolated units as in the case of the coordination, asymmetric information or ‘fundamental’ approaches. Banks are imbedded in a complex and evolving financial structure because their main function is to accept debt instruments, or which is the same thing guarantee the creditworthiness of a given agent. And this in turn, makes them dependent on the proper functioning of other financial institutions. As explained by Minsky (1986, p. 229):
When a banker vouches for creditworthiness or authorizes the drawing of checks, he need not have uncommitted funds on hand. He would be a poor banker if he had idle funds on hand for any substantial time… Banks make commitments because they can operate in financial markets to acquire funds as needed; so to operate they hold assets that are negotiable in markets and have credit lines at other banks. The normal functioning of our enterprise system depends upon a large array of commitments to finance… and money markets that provide connections among financial institutions that allow these commitments to be undertaken…31
For this interconnected system to function smoothly stable financial institutions must be in a solid financial position. Banks in the DD model are, by construct of the model, insolvent. If consumers at time 1 decide to withdraw their deposits the bank must pay them a rate of interest but there is no correspondent increase in the value of the assets of the banks (the value of deposits exceeds that of assets). Achieving a solid financial position requires actively managing financial institutions assets and liabilities to maximize profits. This means that liabilities cannot be determined by the preferences of consumers and assets cannot be illiquid.
As explained by equations 1 to 3, the maximization of profit requires increasing earning per unit of assets and or increasing leverage. The specific ways in which banks manage assets and liabilities and maximize profits do not occur in a vacuum. It is a historically and institutionally contingent issue. The soundness of the financial system by the margins of safety. The margins of safety are provided by liquidity (cash receipts and liquid assets) and allow for ‘error and variance’ (Minsky, 1975, p. 162). As explained by Minsky (1986, pp. 79-80):
The margins of safety can be identified by the payment commitments on liabilities relative to cash receipts, the net worth or equity relative to indebtedness…, and the ratio of liabilities to cash and liquid assets, that is the ratio of payment commitments to assets that are superfluous to operations. The size of the margins of safety determines whether a financial structure is fragile or robust and in turn reflects the ability of units to absorb shortfalls of cash receipts without triggering a debt deflation.
The size and strength of the margins of safety are ‘safest’ when economic agents can repay their debt (interest and principal) commitments with future cash flows. The size and strength of the margins of safety are the least safe when economic agents rely on the expectation of an appreciation of the underlying asset(s) which sustains their debt or of a favourable change in the underlying economic conditions (say an appreciation of the exchange rate when debt is denominated in foreign currency) to cover their liabilities (interest and principal). In between both extremes, is the case where economic agents expect future cash flows to cover interest payments but not the principal32.
It is these characteristics of the banking system that can set the stage for a run, contagion, and panic. The dependency of banks on financial markets makes them vulnerable to external changes in financing conditions, especially to changes in the pattern of interest rates as occurred in the 1980s, prior to the GFC and in 2023. This vulnerability is enhanced when the main vehicle for increasing profits is leverage.
When banks face financial trouble because these can’t comply with their commitments, they seek ways to refinance their debts, issue new debt and/or pledge or sell assets. Runs occur when the opportunities to refinance or issue new debt dry up so that the bank is forced to sell part of its assets, generally at heavily discounted prices (fire sales). This reflects how liquid assets become illiquid as a result of the financial situation of the financial institution in question. In turn, fire sales decrease the value of the bank’s assets and increase the probability of insolvency, that is, that the liquidation value of assets falls below the value of liabilities.
In the coordination failure and asymmetric information views depositor and in general claim holders have no information about the financial situation of banks. Random signals in the coordination failure approach have nothing to do with the financial state of the bank. As stated by Diamond and Dybvig (1983, p. 410): “This could be a bad earnings report, a commonly observed run at some other bank, a negative government forecast, or even sunspots. It need not be anything fundamental about the bank’s condition. The problem is that once they have deposited, anything that causes them to anticipate a run will lead to a run.”
From the point of view of the coordination failure approach the ultimate reason for the existence of a bank run is the existence of a stock of deposits that cannot be increased by the financial institution. In other words, the exogeneity of money is key to the argument. Obviously, as explained by the Bank of England and Bundesbank (Deutsche Bundesbank, 2017; Mcleay, Radia, and Thomas, 2014), money is not created exogenously but endogenously.
In the case of asymmetric information, claim holders have a suspicion that one or more banks may be in financial trouble, but they are not certain and cannot distinguish between solvent and insolvent banks on the basis of the existing information. A bank run is the mechanism through which economic agents gather knowledge to evaluate the state of financial institutions. The fundamental view requires that agents be given ‘true’ signals about the state of the economy on the basis of which these can infer the financial situation of banks. If this were the case bank runs, panics and even financial crises would be predictable which, given the past empirical evidence, is highly unlikely.
However, the empirical evidence indicates that the client base of financial institutions is not composed of individual consumers but of sophisticated and well-established institutional investors. As of the end of December 2022, the three largest investors in SVBFG included the well-known exchange traded funds, Vanguard, State Street Global Advisors and BlackRock (21.6% of the shares of SVBFG).
All three exchange traded funds totaled $20 trillion in managed assets is the equivalent of more than half of the combined value of all shares of companies in the S&P 500 (about $38 trillion). These three companies, collectively, have become the largest shareholder of 40% of all publicly traded companies in the United States. Other investors included there were also pension funds. One of them is the world’s largest sovereign wealth fund, the Norwegian oil fund, which had a 1% stake in SVBFG’s capital. Another was Alecta Pension Insurance Mutual, which manages the pension plans of 2.4 million Swedes. It is inconceivable that these institutional investors had no recurrent accurate information services regarding the financial situation of SVBFG.
7. THE EXCESSIVE WEIGHT PLACED ON DEPOSIT INSURANCE AS A DETERRENT TO BANK RUNS
A final issue that needs to be addressed is the relationship between deposit insurance and bank runs. Deposit insurance has been lauded by economists of different persuasions as a fundamental way to ‘rule out runs’ (Diamond and Dybvig, 1983, p. 404) (as depositors have immediate access to their funds even if the bank fails), avoid panics and maintain the stability of the financial system, including Galbraith (1997 [1954], pp. 191-192): “Rarely so much been accomplished by a single law.”); Friedman and Schwartz (1971 [1963], p. 434): “Federal insurance of bank deposits was the most important structural change in the banking system to result from the 1933 panic and, indeed in our view, the structural change most conducive to monetary stability since state banknote issues were taxed out of existence immediately after the Civil War.”); and Bernanke (2009: “The historically most familiar type of panic, which involves runs on banks by retail depositors, has been made largely obsolete by deposit insurance or guarantees and the associated government supervision of banks.”).
The empirical evidence shows that deposit insurance has not ruled out the existence of bank runs thus contradicting some of the above statements and also a main conclusion of the DD model. One argument is that in most bank runs the amount of deposit was insufficient either because of regulation (Continental Illinois and SVBFG) or simply because the insurance deposit fund is too small (Home State Bank). Honing on the case of SVBFG the bulk of deposits were above the $250,000 FDIC insurance threshold. In comparison to a sample of 4,844 banks in the US the distinguishing fact of Silicon Valley Bank was the volume of deposits that were uninsured. Silicon Valley Bank financed 78% of its assets with uninsured deposits in the highest percentile. This implied that the leverage with uninsured deposits was of the order of 92%33.
An alternative explanation maintains that deposit insurance (and also lender of last resort interventions) validates the bad practices of financial institutions, and this is the reason why runs and panics and also financial crises tend to recur. At the same time, the non-existence of deposit insurance does not mean that the occurrence of runs is inevitable. In fact, in the case of some countries, the absence of deposit insurance has been accompanied by an absence of bank runs for prolonged periods of time (see Selgin, 2020). However, this may reflect the fact that during these periods the financial institutions of these countries remained solvent, and the regulatory environment was more rigorous.
Indeed, solvency rather than deposit insurance is the key to explaining bank runs. After all, who would keep their money in a bank knowingly that it is insolvent even if its deposits were insured? Certainly, in the case of large, sophisticated creditors “deposit insurance is not an important factor, and they are likely to be well informed. Instead, their incentives to withdraw are likely to be affected by their business models, including their tolerance for liquidity and credit risk, and the extent to which they could be affected by contagion.”34
8. CONCLUSION
Bank runs are a recurrent phenomenon like panics and financial crises. Although historically contingent, bank runs exhibit a definite pattern. They occur within the context of an entrepreneur economy. Mismanagement, mishandling of funds and corruption are part of the building-up to a bank run. But they are not essential elements for the occurrence of a run. Runs are a manifestation of the workings of the profit motive and the making of exchange value as the main drivers of economic activity.
Trying to explain bank runs through the lens of a cooperative economy requires stringent, and in fact, implausible assumptions about the characteristics and workings of a capitalist economy and its ‘economic agents.’ Bank depositors are identified with consumers when, in fact, the evidence shows that often they are sophisticated investors. Runs do not begin due to a random shock or as a way to monitor banks. Depositors do not get ex ante definite signals about the state of the economy and the business cycle. But the evidence shows that they get signals about the financial conditions of their bank.
Investors need not have perfect knowledge but in Keynes words have a degree of belief which it is rational to entertain in given conditions. This degree of belief is derived by valid argument from their direct knowledge35. And direct knowledge about the financial institution is acquired through different means. The degree of belief in the potential insolvency of a financial institution on the basis of financial information is the reason why runs happen. Runs are endogenous to the financial conditions of a financial institution.
In the cooperative view banks have a fixed pool of resources so that the withdrawal of funds by any group of depositors reduces their availability for the rest. In this story the notions of endogenous creation of liquidity by banks that characterize banking systems are completely absent. Moreover, banks operate as unit banks rather than forming part of a complex network of financial institutions. As a result, the cooperative view cannot capture the essential nature of banking, that is, guaranteeing debts, nor consider the interconnectedness of financial institutions, both of which are central to explain bank runs.
Building on the stylized facts of bank runs in the United States since the 1980s to the present day and the approach and insights of Minsky36 this paper has attempted to disentangle and present the main building blocks for an alternative bank run theory.

