


 nueva página del texto (beta)
 Inglés (pdf)
 Artículo en XML
 Referencias del artículo
 Enviar artículo por email
 Citado por SciELO
  Similares en
SciELO
Similares en
SciELO 
 Permalink
1. INTRODUCTION
Looking at the export basket provides an acceptable notion of what is happening in a country and indicates an indirect measure of competitiveness. In this sense, Lall, Weiss, and Zhang (2006) inferred export sophistication by looking at the export basket and income levels, understanding export sophistication as a result of exporting both high-technology and diversified products. Using similar ideas, Hidalgo (2009), Hidalgo and Hausmann (2009) and Hausmann et al. (2014) introduced the Economic Complexity Index (ECI), a measure of export sophistication, which may reflect a nation’s economic structure. Their concept considers the levels of diversity and ubiquity of exports and the share in the international market of each product and country.
A comprehensive literature highlights the correlation between a diversified economy and high levels of per capita income, e.g.Nelson and Pack (1999), Peneder (2003), Cimoli (2005) and Felipe et al. (2012). Moreover, a few studies argued there is a causal relationship between exported products and per capita output (Rodrik, 2006; Hausmann, Hwang, and Rodrik, 2007). In line with those investigations, Hausmann et al. (2014) found that a country’s export basket is a good predictor of future economic growth path. So, countries with a high level of export sophistication but a low level of per capita income tend to grow faster in order to have a level of per capita income that corresponds to their level of export sophistication. The pattern of productive specialization matters also to explain intra-country income differentials. Jarreau and Poncet (2012) investigated the relation between sophisticated product exports and the economic growth of 33 Chinese regions, finding that regions with a highly sophisticated export basket grow faster. However, gains in income growth came only when exports were composed of ordinary products and undertaken by domestic firms, indicating those firms are where major gains take place.
Given the relation between complexity and growth, a second step could be to investigate the determinants of increasing complexity. Thus, we aim to understand better how economic structure is determined at a country level. We depart from two potential candidates of variables to explain complexity. First, the quantity and quality of human capital. In this regard, Hidalgo (2009) affirmed that differences in economic structure led to differences in products. After that, Hausmann et al. (2014) stated that the products a nation makes have a particular relation to its inhabitants’ knowledge and the possibilities an economy holds. Second, some studies have underlined the interaction between technological progress and economic growth (Solow, 1957; Romer, 1990; Lichtenberg, 1992). Grossman and Helpman (1994), for example, affirmed that gains from trading with other economies might take place where technological advantages exist and the learning process is dynamic. They also suggested investment in technology presents increasing returns to scale. Considering that technology seems to play an important role in economic growth as well.
Even though associating human capital and investment in technology with economic structure is not new (Ciccone and Papaioannou, 2009; Bravo-Ortega and de Gregorio, 2011; Teixeira and Queirós, 2016), we have contributed a little towards the understanding of this matter. First, we use a new measure of the economic structure, the ECI, which presents progress in objectivity and comparability. Although Hausmann et al. (2014) explained the process of how complexity and growth are correlated, no indication is given of which variables are associated with the increase in economic complexity. Hence, our second contribution is the investigation of the determinants of economic complexity. Taking both together, our contribution is of practical importance: While policy attempts to make structural changes are very popular, the literature is relatively silent on the most efficient ways to promote them. Thus, we give first clues for screening policies addressed to structural change.
Results indicated that human capital and investment in technology explain economic structure. The quantitative measure of human capital showed a positive and significant effect on complexity as well as investment in technology. However, when PISA scores, the qualitative measure of human capital, are included the quantitative measure showed less relevance or, in most cases, none. PISA 75th percentile score exhibited the largest and significant effect on economic complexity.
The remainder of this study proceeds as follows. The Framework presents the ECI. Methodology displays the empirical model, data source, and summary statistics. After that, Results and Discussion exposes the outcomes. Finally, Conclusion presents the study limitations and suggestions for further research.
2. FRAMEWORK
2.1. The concept of economic complexity
Hidalgo et al. (2007), Hidalgo (2009) and Hidalgo and Hausmann (2009) introduced the concept of economic complexity based on the amount of productive knowledge an economy holds. According to that approach, the amount of knowledge is embedded in the products a nation exports, and it is revealed in an analysis of the export basket. The more diversified and less ubiquitous the products in an export basket are, the more complex an economy is.
A ubiquitous product is found everywhere, reflecting how easy its manufacturing is. This ubiquity seems to be a better and more objective measure for economic complexity than technology intensity. While ubiquity is a data-driven definition, the technology intensity needs a previous definition of the technology-intensive sectors. In addition, using data on exports is preferred over data on domestic consumption because exportation is related to having mastered the necessary capabilities to produce a good (Hausmann et al., 2014). They also stated that data on exports are more available and comparable than other national-specific economic measures. The connectedness level between products is also considered.
At the product level, a product exported by many countries may be easier to be produced, while a product that is exported by a few may be harder to be made. The products that only certain economies export tend to present more connections to other products and need more capabilities to be manufactured. Thus, there is a relation between ubiquity, the level of connection and the required capabilities to produce a product.
In this context, if a product is not ubiquitous but low connected to other products, it indicates little knowledge required for producing it, e.g. precious metals. If a ubiquitous product is highly connected to other products, it suggests this product requires much knowledge, but the kind of knowledge that is somehow explicit, e.g. paper products. The less ubiquitous and more connected a product is, the higher its complexity, e.g. optical instruments. In sum, a country is more complex as more knowledge is required to make its products. This amount of knowledge is indirectly measured by producing and exporting a great number of non-ubiquitous goods.
The interplay between nations and products leads us to calculate each country’s diversity level and the ubiquity level of each exported product. Furthermore, the matrix Mcp presents the levels of diversity and ubiquity, in which 1 means the economy c produces the good p with revealed comparative advantage (RCA)1, and 0 otherwise:
Equation [1] shows the number of products an economy produces with RCA, while Equation [2] displays the number of countries producing each product with RCA. Relating these two abilities, the ECI is constructed.
Using the country’s export basket and the products in which it has advantages, the product space can be constructed to visualize the economic structure. The product space is a net relating products according to the capabilities required to make each product. The proximity of products in this net results from the co-exportation probability. It means a specific capability is linked to both products. For instance, a nation with a comparative advantage in cocoa butter has a high probability of exporting cocoa paste with advantage. In the product space, these two products are close to each other, and there is a line connecting them.
The ECI is a comparative index, i.e., an increase in ECI indicates an improvement in the capability ranking so that the economy is learning new capabilities faster than the average. Moreover, Hidalgo et al. (2007) expect the higher the level of economic complexity is, the more sophisticated exports are, then, larger per capita income is expected as well. Hence, we relate the min-max normalized data of both per capita output and ECI in order to check for the relation between the two variables.
In Figure 1, each point represents normalized per capita output (on the vertical axis) and normalized economic complexity (on the horizontal axis) for nations in the years at the top of each subfigure. Economic complexity and income per capita are significantly correlated with each other (r = 0.6248, p-value < 0.01). The relation holds for each of the chosen years between 1964 and 2014.
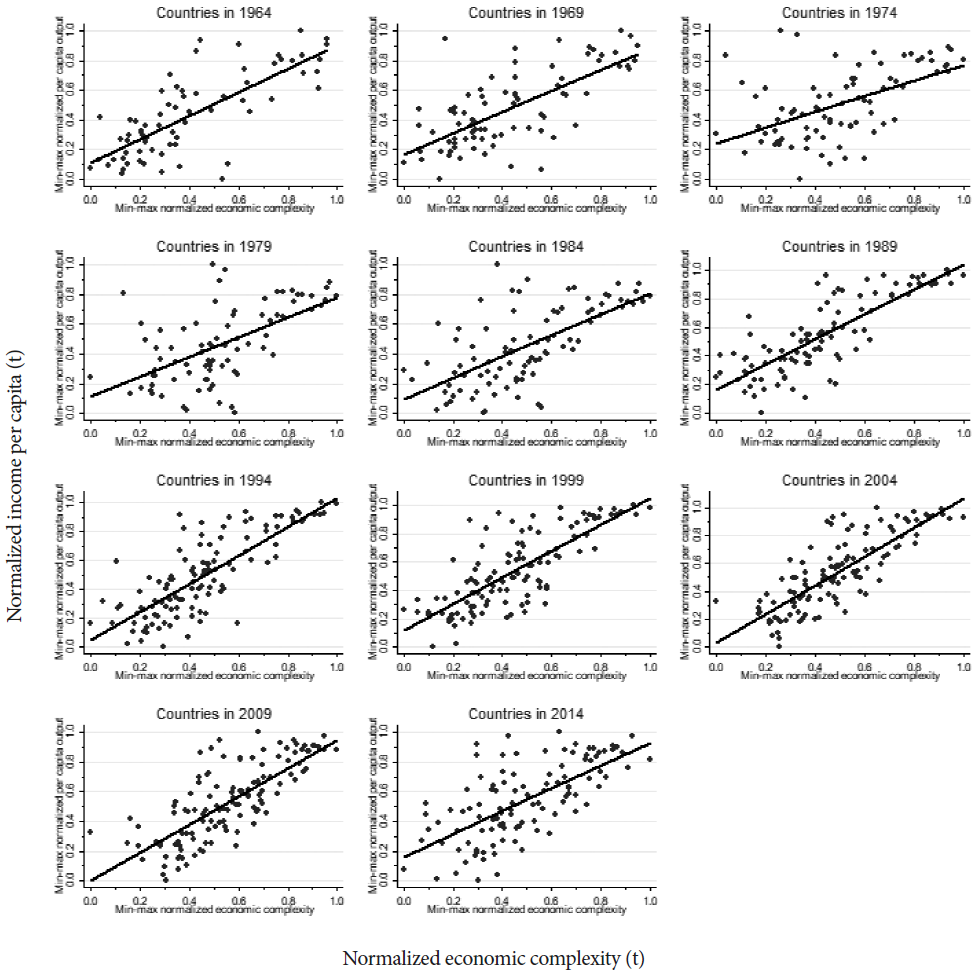
Note: The min-max normalization process was used. Income per capita is based on purchasing power parity in constant 2017 international dollars.
Source: Elaborated by authors.
Figure 1 Normalized per capita output and normalized economic complexity
As exposed above, nations with high economic complexity levels but still low levels of per capita income tend to present an accelerated growth. Hidalgo and Hausmann (2009) expect that relation especially when nations presenting similar per capita income levels are compared. On the other hand, countries with a high per capita income level but a comparatively low complexity level tend to present diminishing growth.
Lall (2000) and Cimoli (2005) stated that labor-intensive and natural resource-intensive economies tend to present diminishing rates of income growth over time. In the beginning, producing resource-abundant goods yields comparative advantages; however, it turns toward a loss of competitiveness in the international market over time. Beyond the low-income elasticity that resource-abundant products present, the capacity to adapt and to recognize new opportunities is the central point to understand the difference between the dependence of an abundant resource and the growth generated by knowledge and technology.
Besides, the causal relationship between economic structure and growth could be tackled by the product space. The product space is the visualization of the economic structure and it is organized in groups of products. The groups of products are classified according to the sections of the harmonized system, which makes 21 groups of products: Animal products; paper goods; textiles; footwear and headwear; stones and glass; precious metals; metals; machines; transportation; instruments; weapons; vegetable products; miscellaneous; arts and antiques; animal and vegetable bi-products; foodstuffs; mineral products; chemical products; plastic and rubbers; animal hides; and wood products.
In this context, the relation between economic structure and income growth could be depicted analyzing two nations with similar levels of income but different economic structures. Afterwards, the subsequent income growth of both nations should be compared. In 1995, Bolivia’s ECI was -0.7848, and its per capita income was $5,050, while Ukraine’s ECI was 0.0623, and its per capita income was $5,059. Although the two nations had similar per capita income, Ukraine had an ECI more than 0.8 standard deviation larger than Bolivia so that their economic structures were different.
According to Simoes and Hidalgo (2011), Bolivia (2022) and Ukraine (2022), in 1995 the Bolivian economic structure was related to four groups of products: Mineral products, metals, precious metals, and wood products. And, in the same, the Ukrainian economic structure was linked to four groups of products: The mineral products, metals, chemical products, and textiles. Given that mineral products, precious metals and wood products are less connected and more ubiquitous than chemical products and textiles, it shows a lower level of economic complexity in Bolivia and indicates smaller income growth when compared to Ukraine.
Figure 2 exhibits per capita income of Bolivia and Ukraine from 1995 until 2005. The accumulated growth in the decade after 1995 was 13.85% in Bolivia and 43.86% in Ukraine. The average annual growth rate between 1995 and 2005 was 1.32% in Bolivia and 3.91% in Ukraine.
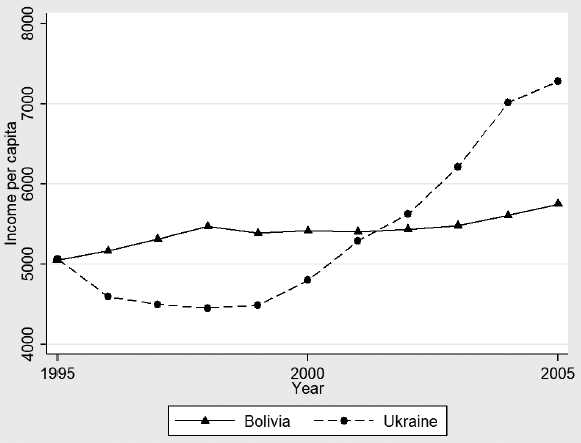
Note: Income per capita is based on purchasing power parity in constant 2017 international dollars.
Source: Elaborated by authors.
Figure 2 Income per capita growth in Bolivia and Ukraine, 1995-2005
On the other hand, one would say that the relation between economic complexity and income growth only holds for low-income countries, so we compare two high-income countries as well. In 1995, Oman’s ECI was -0.6775 and its per capita income was $29,496, while New Zealand’s ECI was 0.4412 and its per capita income was $28,969. Though the two countries presented similar per capita income, New Zealand had an ECI more than one standard deviation larger than Oman so that their economic structures are quite different.
According to Simoes and Hidalgo (2011), Oman (2022) and New Zealand (2022), in 1995 the Omani economic structure was related to two groups of products: Mineral products; and textiles. While in the same year the New Zealander economic structure was concentrated on six groups of products: Animal products; wood products; vegetable products; machines; chemical products; and textiles. In addition, since New Zealand’s exports are more diversified and refer to less ubiquitous and more connected goods, such as machines and chemical products, its income growth is expected to be larger than Oman’s economy.
Figure 3 presents Oman’s and New Zealand’s per capita income from 1995 until 2005. The accumulated growth in the following decade was 8.2% in Oman and 25.11% in New Zealand. The average annual growth rate between 1995 and 2005 was 0.84% in Oman and 2.27% in New Zealand.
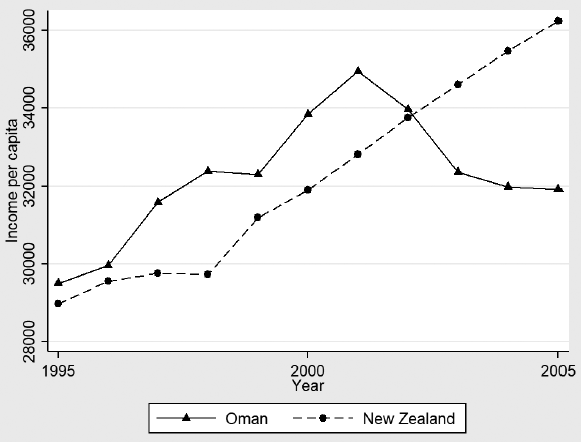
Note: Income per capita is based on purchasing power parity in constant 2017 international dollars.
Source: Elaborated by authors.
Figure 3 Income per capita growth in Oman and New Zealand, 1995-2005
In 1995, Bolivia and Ukraine presented similar per capita income, which also occurred between Oman and New Zealand. Although their similarity in per capita income, the difference in the related groups of products and economic complexity, economic structure measures, may have played a major role in shaping their income growth in the following decade.
2.2. Human capital and investment in technology
Diversifying the set of products and exporting products that only certain economies export are tasks that require education and technology. Thus, human capital and investment in technology seem to play an important role in economic complexity determination. Furthermore, Nelson and Pack (1999) and Cimoli (2005) stated that investments in human capital are the key to increase the learning capacity that predicts a change in economic structure. Technological knowledge cannot be accessed only by having machines, equipment, and blueprints. The learning capacity and the entrance into new sectors depend upon the set of capabilities available.
If an economy presents entrepreneurship, innovation, and learning capacity, the more productive sectors will progressively raise their share of output, capital, and labor. After such changes, the level of national productivity increases as a result of investment in human capital and the expansion of the more productive sectors (Nelson and Pack, 1999).
Moreover, Romer (1990) introduced the notion that human capital also influences technology growth by being a factor of technical progress that may boost the innovative capacity. He suggested that some skilled people work for expanding technology rather than producing final-output products. Those people’s outcomes may be related to cognitive skills instead of the quantity of education.
Although Nelson and Pack (1999), Cimoli (2005), and Romer (1990) agreed human capital is relevant and presents positive effects on income growth, they diverge in the size of the effects. They also consider technology. Given that, a high-skilled worker may follow, understand and cause technical progress.
Hanushek and Kimko (2000) observed the most important limitation left from the studies between labor-force quality and economic growth was to take only schooling attainment as human capital proxies. They affirmed the educational quality presents a consistent and stable positive relation to growth rates. Therefore, in the following section, we attempt to separate these two components of human capital, the quantity and the quality of education, to analyze their effects on economic structure.
According to Gould and Ruffin (1995) and Chen and Feng (2000), international trade leads to economic growth. Rodrik and Subramanian (2005) and Hausmann, Hwang, and Rodrik (2007) indicated government policy is relevant in shaping economic structure. Yanikkaya (2003) affirmed the previous level of income might also be assumed as the stock of capital in the lagged period.
In addition, there is no widely accepted framework for economic growth determinants (Levine and Renelt, 1992; Sala-i Martin, 1997; Barro, 2003). Hence, we follow Gould and Ruffin (1995), Chen and Feng (2000), Rodrik and Subramanian (2005), Hausmann, Hwang, and Rodrik (2007), and Yanikkaya (2003) and introduce trade openness, government expenditure and initial income into our conceptual model:
Where ECI is economic complexity; GDP initial is initial income; HC is human capital; RD is investment in technology; TRA is trade openness and GOV is government expenditure.
3. METHODOLOGY
3.1. Empirical model
The empirical model estimates the relationship between economic complexity and human capital, previous income level, investment in technology, trade openness, and government expenditure. We have used one proxy for each variable, except for human capital, which we have analyzed by taking two measures. First, we used a quantitative measure of education and then a qualitative one.
Data are for 97 countries from 1996 to 2015, averaged over five-year periods. Furthermore, data availability restricted the number of nations and the period analyzed. Five-year intervals and period dummies are used to remove a correlation that comes from business cycle effects (Fölster and Henrekson, 2001). We also attempted to reduce the influence of government changes or economic crises by doing that.
We used a two-way fixed-effects panel because it allowed us to control the non-observable fixed part of the countries’ heterogeneity. The dependent variable is the ECI over four periods: 1996-2000, 2001-2005, 2006-2010, and 2011-2015. The specified regression is according to the following two-way fixed-effects panel:
Where i means the country and t the period. ECI is the Economic Complexity Index; GDP is initial per capita output; HC is human capital; RD is investment in technology; TRA is trade openness; GOV is government expenditure; v is the intercept of each country; γ is the intercept of each period; and ω is the error term.
Lagged per capita output is used as a control variable for the past economic growth2. In the first estimate, a quantitative measure of education is used as a proxy for human capital. The second estimate included a qualitative measure of human capital. The proxy for investment in technology is the share of output spent on research and development (R&D).
A measure is constructed to access the trade openness level of an economy. It is based on the sum of imports and exports as output share, country’s area and population. The sum of imports and exports as output share is regressed on the country’s area, and population and the error term are separated. The estimate’s residual is about all the other variables related to trade openness, except the country’s area and population. Afterward, the residual of the mentioned estimate is multiplied by a measure of trade terms, which is a ratio of an export price index to an import price index. Thus, the trade openness variable is controlled for differences in international prices, population, and country’s area3.
The proxy for government expenditure is the share of output spent on general government final consumption. This measure includes all current government expenditures for purchases of products and services. It also contains most expenditures on national defense and security. However, it drops government military spending, which is part of the government’s capital formation.
We expect lagged per capita output, human capital, and technology investment show positive effects on economic complexity. Our expectation for the relation between trade openness and complexity is a positive relation since the ECI is based on exports sophistication, and a more open nation may access better inputs and bigger markets.
We have no expectation related to the effect of government expenditure on economic complexity regressions. That is because, on one hand, public spending may be used to favor the production and export of highly complex products and promote opportunities to increase capabilities. However, on the other hand, the government may complicate some issues and bring a worse economic environment to business.
3.2. Data source
The value of the ECI is a time-varying measure, which has 0 average, 1 as standard deviation and lies between -∞ and ∞. All product data used to elaborate the ECI come from the Standard International Trade Classification (SITC) or Harmonized System (HS). Data on complexity goes from 1964 to 2018 and is available on The Observatory of Economic Complexity (Simoes and Hidalgo, 2011). Per capita output based on purchasing power parity is in constant 2017 international dollars and comes from the World Development Indicators.
The quantitative proxy for human capital is the human capital index in the Penn World Table 9.1 (Feenstra, Inklaar, and Timmer, 2015). This index considers data on average years of schooling from Cohen and Soto (2007), Barro and Lee (2013) and Cohen and Leker (2014) and the rates of return to education for each level of schooling estimated by Psacharopoulos (1994). The human capital index is used because it combines different databases on education attainment and has more observations than any other human capital measure.
The qualitative measure4 for human capital comes from the national scores in the Programme for International Student Assessment (PISA) executed by the Organisation for Economic Cooperation and Development (OECD)5. PISA is an international survey that collects data on students’ performances in the 30 members of the OECD and some partner countries. Surveys take place every three years and assess the 15-year-old students’ knowledge in reading, mathematics, and science. PISA also provides detailed information on students’ backgrounds and school factors.
Results of the surveys were transformed to a scale that had 500 as mean and 100 as standard deviation. PISA database presented important issues, such as testing students on three subjects while the other international tests do not have a broad result of the education process; and outcomes are internationally comparable (Fuchs and Wößmann, 2007).
International surveys, such as PISA, aim to assess the knowledge or skills of a population. However, it is not easy to evaluate the population’s performance by testing a sample of it. A statistical technique for doing this is to use plausible values. According to Wu (2005), plausible values represent the range of abilities that a student might have, and they perform well in estimating population parameters. Plausible values were used to estimate the populational mean score and the populational scores of the percentiles 75th, 90th, and 95th of PISA surveys in 2000, 2003, 2009 and 20126.
R&D is compounded by current and capital spending from public and private sectors in activities that systematically increase knowledge of humanities, culture, and society. That spending covers basic and applied research as well as experimental development. R&D are from United Nation Educational, Scientific and Cultural Organization (UNESCO). Data on R&D are available from 1996 until 2016.
Data on import, export, and government expenditure come from the OECD. Data on population and land area come from United Nations (UN). The World Bank made all data available7, excepting economic complexity and human capital. Table 1 shows the summary statistics of data.
Table 1 Summary statistics between 1996 and 2015 (five-year intervals)
| Obser- vation |
Mean | Standard deviation |
Minimum | Maximum | |
|---|---|---|---|---|---|
| Economic Complexity Index |
482 | -0.01907 | 0.9942 | -2.4411 | 2.5391 |
| Income per capita |
470 | 19,536.6 | 19,229.3 | 582.61 | 101,304.7 |
| Human capital | 442 | 2.5185 | 0.6621 | 1.1232 | 3.7226 |
| PISA mean Score | 184 | 472.20 | 49.007 | 327.08 | 546.47 |
| PISA 75th Score | 184 | 538.00 | 50.413 | 392.28 | 613.75 |
| PISA 90th Score | 184 | 588.82 | 49.135 | 452.18 | 667.90 |
| PISA 95th Score | 184 | 617.76 | 48.259 | 485.44 | 698.30 |
| Research and development |
357 | 0.9023 | 0.9222 | 0.009205 | 4.1977 |
| Trade openness | 465 | -3,404.2 | 5,304.8 | -29,966.6 | 28,798.0 |
| Government expenditure |
463 | 15.362 | 5.0763 | 1.3413 | 27.934 |
Note: Income per capita based on purchasing power parity is in constant 2017 international dollars; Research and development and Government expenditure are percentages of output.
Source: World Bank; OECD; Penn World Table 9.1; Simoes and Hidalgo (2011).
For the regression, we use the natural logarithm of both per capita output and human capital index, the square root of R&D, and the other variables were not transformed. All variables were standardized8, except ECI data. The ECI comes already in a standardized form.
4. RESULTS AND DISCUSSION
4.1. Core outcomes
Table 2 displays the results of the specification presented in Equation [4].
Table 2 Economic complexity between 1996 and 2015 (five-year intervals)
| Economic Complexity Index | |
|---|---|
| Income per capita | 0.40377*** |
| (0.136) | |
| Human capital | 0.49641*** |
| (0.640) | |
| Research and development | 0.13083* |
| (0.151) | |
| Trade openness | 0.13690*** |
| (0.00000813) | |
| Government expenditure | 0.00050 |
| (0.00846) | |
| Observation | 318 |
| Adjusted-R² | 0.2629 |
Note: Standardized beta coefficients; standard errors in parentheses; all standard errors clustered at the country level; * p < 0.1, ** p < 0.05, *** p < 0.01. Income per capita based on purchasing power parity is in constant 2017 international dollars; Research and development and Government expenditure are percentages of output. Income per capita is in period t-1, all other regressors are in period t.
Source: Elaborated by authors.
Hereafter, we consider the significance level at 0.10. According to Table 2, initial per capita output, human capital, investment in technology, and trade openness presented significant effects on economic complexity. The possibility of diminishing returns of R&D to human capital was tested, but it exhibited insignificant effects. Moreover, government expenditure showed no significance at all. We believe cross-country differences in public spending explain the absence of an effect on complexity.
The coefficients are in standard deviation terms. A one-standard-deviation increase in lagged per capita output is associated with a 0.4038 standard-deviation increase in the ECI. A one-standard-deviation increase in the human capital index is associated with a 0.4964 standard-deviation increase in the ECI. While for R&D and Trade openness, a one-standard-deviation increase is associated with a 0.1308 and 0.1369 standard-deviation increase in the ECI, respectively. To depict what a one-standard-deviation increase means, certain examples are given. From 1990 to 2014, a one-standard-deviation in the human capital index occurred in Singapore, Brazil, and Qatar. It took seven years in Singapore and 13 years in the other two countries.
From 1996 to 2016, a one-standard-deviation increase in R&D took place in Estonia, Iceland, Slovenia, South Korea, and Denmark. It happened in periods of 3, 4, 4, 5, and 10 years, respectively. Furthermore, most observations showed an R&D level smaller than the full sample’s standard deviation. It makes a one-standard-deviation increase even more difficult for those countries.
From 1980 to 2016, a one-standard-deviation increase in trade openness occurred in Liberia, Iraq, Panama, Qatar, Angola, and other 15 nations. It took a period of a year to happen. It suggests a one-standard-deviation increase in trade openness is somehow less difficult to happen. From 1964 to 2016, and considering at most 20-year periods, a one-standard-deviation increase in the ECI took place in 35 countries. The average time for such change was 6.25 years.
Attempting to test the validity of the results, different samples of countries were used. Countries were separated into seven groups according to their geographical region. The geographical regions were: East Asia and Pacific; Europe and Central Asia; Latin America and the Caribbean; Middle East and North Africa; North America; South Asia; and Sub-Saharan Africa. Equation [4] was run on seven different samples; for each estimate, one region was left out. We used this strategy to prevent losing more degrees of freedom.
Comparing the estimates of the seven different samples to the results presented in Table 2, trade openness and government expenditure showed similar outcomes. When East Asia and Pacific countries were left out, lagged per capita output displayed no significance. Moreover, human capital and investment in technology showed no significance when East Asian and Pacific countries or Europe and Central Asia were left out.
Focusing on the coefficients’ size and their significance among the estimates of the seven different samples and the full sample estimate, we believe human capital has smaller effects on economic complexity in Latin America and the Caribbean countries. We suppose that because human capital displayed the largest coefficient when Latin America and the Caribbean countries were left out. Furthermore, investment in technology presents smaller effects on complexity in the Middle East and North African countries as well as in countries of Sub-Saharan Africa. We assume that since R&D showed the two largest coefficients when countries of these two regions were left out.
In this context, human capital and investment in technology had larger effects on economic complexity in countries of two regions: East Asia and Pacific; and Europe and Central Asia. We presume that because human capital and R&D exhibited the two smallest coefficients when countries of these two regions were left out9.
4.2. Focus on human capital
Alternative proxies for human capital were used to test the robustness of the relationship between human capital and economic complexity. Gross and net enrollment rate in primary, secondary, and tertiary education10 served as human capital proxies. Running the Equation [4] on these alternative proxies yielded that only gross and net enrollment rates in secondary showed significance. We believe these results happened because the human capital index partly uses average schooling years, which generally follows enrollment rate trends. These alternative proxies for human capital presented either a smaller number of observation or insignificant coefficients.
Holsinger and Cowell (2000) affirmed that there are three sorts of secondary school: The general or academic secondary; the vocational or technical secondary; and the diversified or comprehensive secondary. Although no data on these differences are available at the country level, secondary education plays an essential role in a nation’s economic structure. Other alternative proxies for human capital were considered: The share of the population aged 25 or over with completed primary, secondary or tertiary education, the average years of total schooling (Barro and Lee, 2013), and another human capital index (Cohen and Soto, 2007). Running Equation [4] on these alternative proxies resulted that only the share of the population with completed primary education presented significance, while trade openness showed no significance and R&D exhibited a smaller and significant coefficient. We suppose completing primary education is the threshold for human capital that Azariadis and Drazen (1990) explained. All these alternative proxies displayed a loss in degrees of freedom.
Barro (2003) presented different returns of education to economic growth according to gender. Given that, a sample with only female students and a sample with only male students were considered. Gross and net enrollment rate on the three levels of education, the share of the population with completed primary, secondary and tertiary, and the average years of total schooling were used with different gender samples. Running Equation [4] on these different gender samples yielded outcomes similar to the results without gender differentiation, though each gender samples presented a smaller number of observations.
To improve the analysis, a qualitative measure of human capital was included in the estimate. PISA data was used as the quality of human capital. PISA surveys were limited to a set of countries smaller than our core estimate. Thus, we believe a loss in the degrees of freedom exists as well as a selection bias11. It biased the results toward an underestimate of the relation proposed here. Although including the quality of education makes the sample smaller, the coefficients performed well to this new specification.
Data on PISA 2000, 2003, 2009, and 2012 surveys were used12. The performance in reading13 was used for the PISA sur|veys mentioned. We used PISA mean score and PISA scores of the percentiles 75th, 90th, and 95th in the estimates. These scores were chosen arbitrarily.
Equation [4] was run again, but now the quality of human capital was included. Hence, human capital presents two components, the human capital index, and PISA scores. Results of this specification are displayed in Table 3.
Table 3 Economic complexity and education quality between 1996 and 2015 (five-year intervals)
| (1) | (2) | (3) | (4) | (5) | |
|---|---|---|---|---|---|
| Income per capita |
0.39630*** | 0.38493*** | 0.38310*** | 0.39164*** | 0.39583*** |
| (0.172) | (0.173) | (0.175) | (0.178) | (0.177) | |
| Human capital | 0.50284* | 0.43326 | 0.42214 | 0.43879 | 0.45903* |
| -1.356 | -1.343 | -1.333 | -1.339 | -1.352 | |
| Research and development |
0.43378*** | 0.43221*** | 0.44433*** | 0.45306*** | 0.45522*** |
| (0.196) | (0.194) | (0.186) | (0.182) | (0.182) | |
| Trade openness |
0.23615*** | 0.22397*** | 0.20691*** | 0.20064*** | 0.20449*** |
| (0.000009) | (0.000008) | (0.000008) | (0.000008) | (0.000008) | |
| Government expenditure |
0.04020 | 0.08685 | 0.07715 | 0.06259 | 0.05546 |
| (0.0161) | (0.0171) | (0.0163) | (0.0160) | (0.0161) | |
| PISA Mean Score |
0.18144** | ||||
| (0.00139) | |||||
| PISA 75th Score |
0.19989** | ||||
| (0.00145) | |||||
| PISA 90th Score |
0.16034* | ||||
| (0.00132) | |||||
| PISA 95th Score |
0.11600 | ||||
| (0.00118) | |||||
| Observation | 175 | 175 | 175 | 175 | 175 |
| Adjusted-R2 | 0.5090 | 0.5321 | 0.5336 | 0.5274 | 0.5193 |
Note: Standardized beta coefficients; standard errors in parentheses; all standard errors clustered at the country level; * p < 0.1, ** p < 0.05, *** p < 0.01. Income per capita based on purchasing power parity is in constant 2017 international dollars; Research and development and Government expenditure are percentages of output. Income per capita is in period t-1, all other regressors are in period t.
Source: Elaborated by authors.
According to Table 3, initial per capita income, the quantity or the quality of human capital, investment in technology, and trade openness presented significant effects in all five estimates. At the same time, the government size showed no effect at all. Including PISA scores alters only the relevance of the quantity of human capital, all other coefficients stood slightly the same.
Among PISA scores, PISA 75th score presented the largest significant coefficient. This outcome suggests that the upper-average quality of education plays a major role in economic complexity. Moreover, adding PISA scores to the estimate makes the quantity of human capital lose its significance except when PISA 95th score is included. It indicates the effect of human capital relies on the quality of education.
Hanushek and Kimko (2000) stated that educational quality improves the power to explain economic growth. Thus, considering a qualitative measure of education causes the quantitative measure to lose its relevance a bit. Outcomes showed that achieving higher PISA scores is associated with presenting higher levels of economic complexity, reflecting an improvement in the nation’s economic structure.
5. CONCLUSION
This investigation contributes to the debate on the importance of human capital and investment in technology on a country’s economic structure. Once export sophistication reflects the economic structure, this study focused on finding export sophistication determinants and related them to economic structure, per capita output, and income growth.
The ECI was used as a measure of export sophistication. This index is based on the levels of ubiquity and diversity of exports, the share of international trade, and connections between products. Our estimate is from 1996 to 2015 with a sample of 97 countries.
According to results, data, and methodology, human capital, investment in technology, lagged per capita income, and trade openness are important factors in explaining economic structure. The four factors showed positive effects on economic complexity. On the other hand, government expenditure is not a key element in determining a country’s economic structure. We checked for differences in female and male education affecting economic complexity, but none was found.
We also included a qualitative measure of human capital in our main estimate and it presented promising outcomes. PISA mean score and PISA scores of 75th, 90th, and 95th percentiles were used as the quality of human capital. Three of the four PISA scores showed a positive relationship with economic structure, they were PISA mean score and PISA scores of 75th and 90th percentiles. Furthermore, the score of 75th percentile presented the largest significant coefficient.
Our findings suggest expansions in human capital are conducive to enhancements in a country’s economic structure. Hence, investments in increasing both the average years of schooling and the quality of education should be promoted. In addition, given that the quantity of human capital matters only when its quality is not taken into account, countries should invest more in the quality of education. Moreover, the efforts to raise the human capital stock, besides aiming to increase economic complexity, are direct factors of income growth.
In addition, we put forward another two suggestions. The first suggestion is that rises in R&D should be encouraged due to the learning and innovative capacities leading to improvements in economic structure and both come from investing in technology. The second suggestion is that investments in opening international trade should receive certain incentives since trade openness promotes upgrades in economic structure. On the other hand, our findings cannot offer any particular recommendation on government expenditures because they showed no effect on the economic structure.
The study’s main limitation is the data availability, particularly on human capital and R&D. Furthermore, a suggestion for further research is to analyze R&D according to its resource, given that public and private investments cause different effects on the economic structure. Another suggestion is to analyze R&D according to its objectives due to basic and applied research may present distinct effects on the economic structure.

