


 nueva página del texto (beta)
 Inglés (pdf)
 Artículo en XML
 Referencias del artículo
 Enviar artículo por email
 Citado por SciELO
  Similares en
SciELO
Similares en
SciELO 
 Permalink
1. Introduction
This article presents an empirical analysis of the manufacturing (disaggregated into subsectors by research and development (R&D) intensity) influence on the level of economic complexity (ECI). For this purpose, the sample was divided into 20 developed countries and 8 emerging economies. This analysis was based on two methods, a parametrical, using Panel Dynamic Ordinary Least Squares (PDOLS) and the non-parametric, applying Data Envelopment Analysis (DEA) and Malmquist Decomposition.
The importance of manufacturing for economic growth is evident from classical development economics, such as Rosenstein-Rodan, Nurkse, Prebisch, Hirschman, Leibenstein, Myrdal, among others1. According to Ros (2013) the classical literature of development economics has generated a view of development as a process in which increasing returns to scale -mainly in industry- and elastic labor supplies play key roles.
More recently, Rodrik (2013a) presents a model in which the economy is divided between the natural resources sector, the services sector, and the manufacturing sector. Among the three sectors, manufacturing would be the only one that would have characteristics consistent with the so-called unconditional convergence. As the sector produces tradable goods, these can be quickly integrated into the global production network, which would facilitate the transfer and absorption of technology. Therefore, the quickest way to carry out the catching up process would be through the implementation of policies aimed at building modern manufacturing industries, which employ an increasing share of the economy’s workforce (Rodrik, 2013a).
Rodrik (2013b) argues that unlike economies (as a whole), manufacturing industries exhibit strong unconditional convergence in labor productivity. His results are highly robust to changes in the sample and specification. The coefficient of unconditional convergence is estimated in almost 3% per year in the author´s baseline specification, covering 118 countries. Notwithstanding, despite this strong convergence within manufacturing verified by Rodrik (2013b), aggregate convergence fails due to the small share of manufacturing employment and value added in low-income countries as well as the slow pace of industrialization.
Besides Rodrik’s (2013b) results, the literature also points to a positive relationship among per capita income and economic complexity (Hausman et al., 2011)2. Moreover, the latter is interconnected to manufacturing industries. Gabriel and Missio (2018), for example, highlight that manufacturing has a relevant influence on the level of economic complexity, given the possibility of the sector to incorporate new technologies and increase the use of companies’ capacity through learning by doing. Accordingly, this sector has greater capacity to boost economic growth in emerging economies.
Thus, a fundamental question arises concerning which sectors within manufacturing would better fuel economic growth as well as ECI in heterogenous countries. Therefore, an intra-industrial analysis is needed, that is, given the finding that manufacturing industry positively influences the income convergence process through economic complexity, which subsectors would be more efficient to affect ECI? Thus, there is an empirical gap as far as it is necessary to verify which sectors within manufacturing are more efficient in order to increase the level of economic complexity and reduce the per capita income gap between developing and developed economies.
Therefore, the fact that the manufacturing sector plays a key role in a country’s economic development, according to the above-mentioned literature, makes researchers examine how the structure of manufacturing is associated with different levels of income per capita and economic complexity. Sustained economic growth entails structural change also at disaggregated levels within the manufacturing sector through technical efficiency and technological change which reflects in productivity gains and, eventually, specialization in subsector levels at a later development (Imbs and Wacziarg, 2003; Haraguchi, 2016).
According to McMillan, Rodrik, and Verduzco-Gallo (2014, pp. 26-27) the great difference between Asian and both Latin American and African productivity performance is accounted for by differences in the pattern of structural change. Since 1990, structural change in Latin America, in particular, has been growth-reducing, with the labor force transferring to less productive activities, notably in services and the informal sector. The Brazilian economy, the most important in Latin America (in terms of Gross Domestic Product, GDP), passed through a stark process of deindustrialization, in which manufacturing in 2020 was just 11.3% of its GDP, in contrast in the 1980s when manufacturing reached 34% of Brazil’s GDP 3.
Nassif, Feijó and Araújo (2014) argue that Brazil has embarked on a trajectory of falling behind relative to the world economy and the international economic frontier. Therefore, special attention is given to the Brazilian case.
In this context, the present research has the objective of analyzing how manufacturing industry, disaggregated into subsectors according to the level of R&D4, influences the level of economic complexity and, consequently, a country's income. In order to achieve this goal, two methods were used: 1) the parametric, using long panel data models, and 2) the non-parametric, using the DEA and the Malmquist decomposition method. From the non-parametric methodology, efficiency boundaries were determined for disaggregated sectors according to R&D level, relating them to the economic complexity in a heterogenous sample of countries.
Thus, the novelties of this work lie in three main points: a) a heterogenous sample of countries in the period between 1963 and 2012 is empirically appraised to verify if and how the allocation of employment in the different manufactured sub-sectors influences economic complexity; b) the paper measures efficiency by DEA for the four levels of R&D defined, relating the results to the level of economic complexity of the sample; and, c) it expands the analysis for the specific Brazilian case, comparing its manufacturing subsectors in terms of technical efficiency change and technological change as well as total factor productivity (TFP), according to a non-parametric method (Malmquist decomposition). To the best of our knowledge this kind of method was not applied to United Nations Industrial Development Organization (UNIDO) database and the countries sample used in this work (INDSTAT 2 2015, ISIC Revision 3 from UNIDO). Moreover, no work was found describing the sub-sectoral heterogeneity and pattern within manufacturing in terms of efficiency measures based on DEA and economic complexity.
This article is divided into six sections, in addition to this introduction. Section 2 presents the estimations for the long panel data (parametric approach). Section 3 presents the estimations related to DEA analysis and section 4 presents the Malmquist decomposition for the Brazilian case. Lastly, in section 5, the concluding remarks are made5.
2. Long panel data estimations
Comparative analysis across countries over a wide period of time is difficult due to the availability and consistency of data. In these cases, the tradeoff between the number of countries analyzed and the number of years observed is not uncommon. In the present work, we sought to analyze the longest period possible.
Then given the availability and consistency of the data in the INDSTAT 2 2015, ISIC Revision 3 from UNIDO, twenty advanced countries were considered: Australia (AUS), Austria (AUT), Belgium (BEL), Canada (CAN), Denmark (DNK), Spain (ESP), Finland (FIN), France (FRA), United Kingdom (GBR), Greece (GRC), Israel (ISR), Italy (ITA), Japan (JPN), South Korea (KOR), Netherlands (NLD), Norway (NOR), Portugal (PRT), Singapore (SGP), Sweden (SWE) and the United States (USA). And eight emerging countries: Brazil (BRA), Chile (CHL), Colombia (COL), Ecuador (ECU), India (IND), Iran (IRN), Malawi (MWI) and Turkey (TUR). UNIDO’s country coverage is incomplete for other countries or presents large gaps, which makes statistical analysis unfeasible. Therefore, the dataset for the sub-sectoral analysis spans the period 1963 to 2012 for the above-mentioned countries. Moreover, the classification of countries was based on the International Monetary Fund (IMF) World Economic Outlook Database, made available in October 2019.
Table 1 presents the variables used in the empirical models, a brief description, and its sources.
Table 1 Description of the variables for the parametric and non-parametric methods
| Variable | Brief description | Source |
|---|---|---|
| ECI | Economic Complexity Index - normalized | Atlas of Economic Complexity |
| Highemp | Employment share in high R&D % * | UNIDO |
| Lowemp | Employment share in low R&D % * | UNIDO |
| Mediumhigh | Employment share in medium high R&D % * | UNIDO |
| Mediumlow | Employment share in medium low R&D % * | UNIDO |
| GDP gap | Ratio of each country per capita income in relation to USA per capita income - in real terms | WDI |
| Pop | Country population | PWT (9.1) |
| Govexp | Government spending (% of GDP) | WDI |
| Human capital | Human capital index - Barro and Lee (2013) | PWT (9.1) |
| Inv | Gross fixed capital formation as a proportion of annual GDP % | WDI |
*Notes: Within manufacturing. WDI (World Development Indicators) - World Bank; PWT (Penn World Table 9.1), and INDSTAT 2 2015, ISIC Revision 3 - UNIDO.
Source: Authors’ own.
The manufacturing sub-sectors were divided according to R&D level, the division was carried out based on the OECD (2011) classification. The choice for this classification is due to the importance of the technology to determine productivity growth and international competitiveness. Furthermore, the taxonomy in OECD (2011) was based on the ISIC Rev.3, the same classification adopted in the database used in this work. Greater technological opportunities are caused by a greater share of intensive activities in R&D, fostering innovation, which, consequently, increases the demand for new products, including in international trade, decreasing the balance of payment constraint to growth.
The sample is divided in 20 developed countries and 8 emerging economies6, so there are two groups of countries for long panel data analysis, covering a 50-year period. For this reason, tests by Levin, Lin and Chu (2002), Im, Pesaran and Shin (2003) and Fisher, proposed by Maddala and Wu (1999) and Choi (1999), for unit root were performed. In both tests, the series related to the percentage of workers allocated by each level of R&D are not stationary, the results pointed out by these series are I(1). Notwithstanding, the Pedroni (1999) and Kao (1999) cointegration tests revealed that panels are co-integrated, for both developed and emerging countries, that is, they do not have a spurious relationship, at 1% significance.
After performing the cointegration tests, it is possible to estimate the cointegration vector and, therefore, the long-term relationship between the dependent and independent variables using the PDOLS.
Table 2 presents this in the two samples, all allocations of workers at different levels of R&D were shown to be statistically significant in the long run, when related to the level of economic complexity. However, with different impacts and magnitudes7.
Table 2 PDOLS estimations, 1963-2012 - Robust
| ECI | Developed countries | Emerging countries |
|---|---|---|
| high R&D | 6.839 *** | 7.117 *** |
| (27.12) | (6.229) | |
| medium low R&D | 1.706 *** | -0.001487 *** |
| (3.389) | (-21.45) | |
| medium high R&D | -0.1582 *** | 0.5443 *** |
| (-19.05) | (53.47) | |
| low R&D | -1.32 *** | 0.3014 *** |
| (-41.84) | (4.128) | |
| GDP gap | -0.8436 *** | -4.049 *** |
| (-18.89) | (10.24) | |
| Inv | 0.01462 *** | 0.02902 *** |
| (24.24) | (-34.85) | |
| Govexp | 0.05519 *** | 0.02704 *** |
| (22.81) | (-50.21) | |
| N | 20 | 8 |
| N | 947 | 357 |
Note: t statistics in parentheses. Statistical significance at: *10%, **5%, ***1%.
According to the results in Table 2, in the long run the percentage of employment in subsectors with high R&D is positively related to the ECI, both in advanced and emerging countries, but this subsector stronger impacts emerging economies in terms of economic complexity.
Source: Authors’ own.
The allocation of employment in medium-low R&D subsectors had a negative relationship, but it was remarkably close to zero for emerging economies. However, in advanced economies, the effect was positive. The allocation of employment in medium-high R&D subsectors has a negative effect on the ECI variable in advanced countries, but a positive one in emerging countries.
Lastly, the allocation of workers in low R&D is negatively related in advanced countries and positively related to ECI in emerging countries, in the long run. Such results corroborate the idea that structural change presents certain patterns that can vary between different nations according to the level of development (Haraguchi, 2016; Weiss and Jalilian, 2016). Moreover, the structural change in the share of economic sectors, linked to the countries’ income level, also occurs within the branches of activity belonging to manufacturing, as the results show in terms of their impacts on economic complexity.
In general, in the first stage of development, corresponding to low-income countries, labor-intensive industries dominate the manufacturing sector, and gradually greater share moves to capital-intensive industries in the second stage. In the third stage, industries such as the processing of basic metals resources (classified in the present research as low R&D), become dominant in terms of relative share. Lastly, in the fourth stage, there is an increase in the share of technology and knowledge intensive industries, such as those classified as medium high R&D and high R&D (Haraguchi, 2016).
In addition, as countries develop the composition of demand within countries changes. The income effect means that, at low levels of per capita income, household consumption is destined for essential goods, in the case of labor-intensive industries, while at higher levels families tend to consume more elastic goods, as in the case of capital-intensive industries (Morceiro, 2018).
Table 2 also shows that the magnitude of the impact of manufacturing employment allocation at the ECI level is greater in the case of emerging economies (for the positive parameters, in aggregate terms). One of the explanations for this result lies in the fact that the share in industry in the GDP can vary according to the level of per capita income of the economy so that the relationship between the two occurs in an inverted U format.
A greater allocation of employment in manufacturing tends to increase the level of economic complexity in the country and, consequently, its per capita income over time. The results of this section expand this analysis by empirically demonstrating that the level of R&D of the manufacturing sub-sectors, in terms of employment, has different impacts on a country’s economic complexity, and such impacts are distinguished from particular characteristics of each group of economies.
3. Non-parametric approach: data envelopment analysis results
The particularities of each country, or group of countries, differentiate the way in which the structural change between the manufacturing sub-sectors has an impact on economic complexity. It is correct to infer that the efficiency in generating jobs varies between different economies. In this subsection, the results obtained by the DEA are presented, observing the relationship between the efficiency in generating jobs and the level of economic complexity. The data envelopment analysis was calculated by an output-oriented model, considering one output vector and two input vectors. The output vector is the ratio between the value added for each type of R&D and the GDP per capita at constant prices. The input vectors are: (i) capital stock and (ii) human capital (human capital index multiplied by the workers number in each country).
Table 3 presents the position of countries in a ranking that considers their efficiency in producing for each level of R&D among the sub-sectors. In this sense, it allows to assess a ranking of efficiency for different countries considering three different periods and considering the real value added for each R&D level as output and the capital stock and a measure of human capital (considering the number of workers for each segment) as input, i.e., a measure of productivity in a multi sectorial way.
Table 3 Efficiency ranking disaggregated in terms of R&D - 1997; 2003-2008
| Country | High R&D | Medium high R&D | Medium low R&D | Low R&D |
|---|---|---|---|---|
| Singapore | 1° | 3° | 4° | 24° |
| South Korea | 2° | 1° | 1° | 3° |
| Israel | 3° | 20° | 14° | 22° |
| USA | 4° | 11° | 15° | 17° |
| Japan | 5° | 7° | 6° | 16° |
| United Kingdom | 6° | 16° | 20° | 13° |
| India | 7° | 1° | 1° | 1° |
| France | 8° | 13° | 19° | 18° |
| Sweden | 9° | 9° | 11° | 14° |
| Finland | 10° | 15° | 8° | 8° |
| Brazil | 11° | 4° | 7° | 5° |
| Canada | 12° | 17° | 22° | 19° |
| Colombia | 13° | 14° | 9° | 4° |
| Italy | 14° | 10° | 10° | 11° |
| Netherlands | 15° | 21° | 23° | 23° |
| Denmark | 16° | 22° | 25° | 21° |
| Austria | 17° | 18° | 17° | 15° |
| Spain | 18° | 12° | 13° | 10° |
| Chile | 19° | 6° | 18° | 1° |
| Iran | 20° | 2° | 2° | 7° |
| Australia | 21° | 23° | 21° | 20° |
| Belgium | 22° | 8° | 5° | 12° |
| Norway | 23° | 22° | 25° | 21° |
| Turkey | 24° | 5° | 3° | 2° |
| Portugal | 25° | 19° | 16° | 6° |
| Greece | 26° | 25° | 24° | 25° |
| Ecuador | 27° | 26° | 12° | 9° |
Source: Authors’ on based on DEA results on efficiency.
According to Table 3 Singapore leads the efficiency ranking in the high-level R&D sub-sectors. South Korea and India lead the efficiency ranking in medium-high R&D and medium-low R&D. Moreover, India and Chile lead the efficiency ranking in low R&D. Regarding the medium high R&D, Singapore moves to the third position, Brazil occupies the fourth position, and the ranking is led by South Korea and India.
Brazil occupies the 11°, 4°, 7° and 5° in the high R&D, medium high R&D, medium low R&D and low R&D, respectively. It is worth remembering that, as the non-parametric method applied is product-oriented, the ranking presents the notion of increasing the quantity produced without increasing the quantity of inputs used. In this sense, in relative terms, Brazil, specially, is worse in high R&D and medium low R&D.
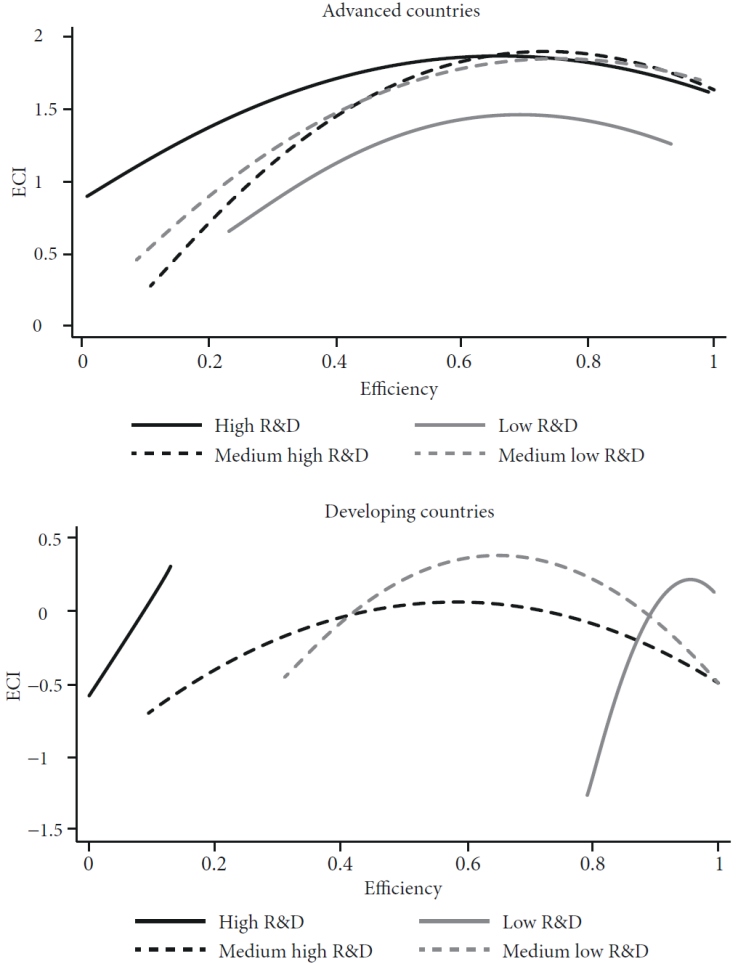
Figure 1 presents the relationship between the efficiency indexes (between the years 1997, 2003, 2004, 2005, 2006, 2007 and 2008) and the level of economic complexity by group of countries (each group divided by R&D level). Figure 1 shows different relationships between the efficiency found by the DEA method and the ECI for advanced and emerging economies8.
Source: Authors’ elaboration based on DEA’s results on efficiency.
Figure 1 Relationship between efficiency and economic complexity
In a broad perspective, Figure 1 shows that lower income countries (emerging countries) are more efficient in labor-intensive or resource-intensive activities (i.e., low R&D and medium low R&D), and higher income countries (advanced countries) are relatively more efficient in capital-intensive or technology-intensive industries (i.e., high R&D and medium high R&D). Moreover, the concavity of the curves varies more sharply among different levels of R&D in emerging countries.
For emerging countries there is a remarkably linear and monotonic relationship between ECI and efficiency regarding high levels of R&D. This means that the increase in efficiency is related to a greater growth in economic complexity index in this subsector, although in a lower level of efficiency when compared to advanced countries. The other levels of R&D operate in an inverted U shape.
For advanced economies, the relationship between efficiencies for each level of R&D and the complexity index has an inverted U format. The greatest relative gain in terms of complexity occurs with the advance of efficiency in countries farthest from the technological frontier, after reaching an average efficiency, the gain in complexity tends to be reduced. As expected, the gain from increasing efficiency in low R&D is lower. However, it is worth mentioning that for high R&D level the curve does not turn down dramatically, i.e., the concavity is not so sharp as it is for the other R&D levels.
Furthermore, the increasing shape of the high R&D curve in emerging economies is an indication that the effect of these sub-sectors on the level of complexity is relatively greater in lower income countries, compared to advanced economies. Moreover, the result of this curve for high R&D agrees with the impacts estimated in section 4 (Table 3).
It is worth mentioning that Brazil (in particular) has undergone an intense process of premature deindustrialization, measured at constant and current prices (Morceiro, 2018). This process occurred mainly in relation to the industrial sectors with the highest technological content. The loss of dynamism in this sector has negatively influenced the rates of economic growth in recent decades, that is, manufacturing has ceased to function as an “engine of growth”.
Based on these considerations, the next section attempts to analyze the variation in productivity between the manufacturing sectors, focusing on the Brazilian case.
3.1. Nonparametric approach: Malmquist decomposition, the Brazilian case
In this section our contribution is to shed light on the sub-sectoral heterogeneity of the Brazilian manufacturing in terms of technical efficiency and technological change. As shown in Table 3, Brazil achieved median levels of efficiency in all cases analyzed. In order to better understand the evolution of the Brazilian case, a second efficiency model was estimated. Due to the availability and consistency of UNIDO’s data, the period of time analyzed corresponded to the years 1996 to 2011, grouped in two intervals, 1996 to 2002 and 2003 to 2011, given the period of increase in commodity prices and favorable conditions for external financing, which boosted growth in Latin America from 2003 to 2008.
Twenty sub-sectors of the sample were considered, listed in Table 6 and 7, as DMUS. Table 4 shows the average annual result of the Malmquist index, which represents the variation in the total factor productivity.
Table 4 Average Malmquist index
| 1996-2002 | |||
|---|---|---|---|
| Year | Technical efficiency Δ | Technological Δ | TFP Δ |
| 1997 | 1.057 | 2.225 | 2.351 |
| 1998 | 0.945 | 1.557 | 1.472 |
| 1999 | 0.846 | 0.555 | 0.470 |
| 2000 | 0.964 | 1.703 | 1.641 |
| 2001 | 1.086 | 0.552 | 0.599 |
| 2002 | 0.988 | 0.747 | 0.738 |
| Average | 0.978 | 1.051 | 1.028 |
| 2003-2011 | |||
| Year | Technical efficiency Δ | Technological Δ | TFP Δ |
| 2004 | 1.029 | 2.022 | 2.081 |
| 2005 | 0.837 | 1.498 | 1.254 |
| 2006 | 1.009 | 1.284 | 1.296 |
| 2007 | 1.105 | 1.177 | 1.301 |
| 2008 | 1.028 | 0.862 | 0.886 |
| 2009 | 1.058 | 0.973 | 1.029 |
| 2010 | 0.995 | 1.131 | 1.126 |
| 2011 | 0.963 | 1.157 | 1.114 |
| Average | 1.000 | 1.224 | 1.224 |
Source: Authors’ elaboration based on DEA results.
Table 4 indicates that 1999, 2001, 2002 and 2008 were the years in which the total factor productivity, i.e., the weighted average between the variation in technical efficiency and the technological variation, decreased in relation to the respective previous year, given that the amount reached was less than 1.
The results obtained corroborate those estimated by Veloso, Matos and Peruchetti (2020), who calculated the TFP in relation to labor productivity and the efficiency of capital used. The results reported by the authors present a decrease in Brazilian TFP in the years 1999, 2000, 2001, as well as an improvement in the performance of TFP between 2004 and 2013. It is noteworthy that those authors’ analysis is quarterly, while the one shown in the Table 4 is annual.
In Morceiro (2018) we can see that in the 1990s there was a process of absolute and relative deindustrialization of employment in Brazil. There was a mini cycle industrialization between 1985 and 1997, in which more technological equipment was replaced (reducing costs of production and workforce demand), which may explain the increase in TFP in 1997 and 1998.
In January 1999 there was an abrupt change in the exchange rate regime amid an international crisis. The floating exchange rate regime was introduced in Brazil, amid currency overshooting. This forced the Central Bank of Brazil to increase the basic interest rate to ease the flight of international capital and the inflationary pass through over the year (Barbosa Filho, 2008). In this scenario, the exchange rate change caused a direct increase in the costs of activities that import inputs and also indirectly increased them, due to the intermediate consumption structure of the sectors, that is, the domestic supplier also demanded imported products. Additionally, the economy was in a recessive environment, due to the Russian crisis and its contagion effect in the second half of 1998. In addition, in 1999 inflationary targets were implemented, and a new fiscal regime was launched, which aimed to stabilize the ratio between public debt and GDP by maintaining a high primary surplus. All these factors contextualized a year in which gross physical capital formation suffered a negative impact, justifying the low results obtained in terms of efficiency.
Oliveira and Turolla (2003) also indicated that there was a negative impact on the series of gross physical capital formation in the years 2001 and 2002, a damage caused by the crisis of the so-called “electrical blackout” and the pre- and post-election tension, respectively. In 2001, a crisis in Argentina also contributed to the outflow of capital and the depreciation of Brazilian exchange rates. This increased the prices of imported goods, the effects of the inflationary increase in 2002 and this continued in 2003 (Barbosa Filho, 2008). Moreover, in 2003 there was a reduction in the proportion of government spending as a share of GDP in order to avoid an increase in the country’s net public debt (Barbosa Filho, 2008).
Regarding the year 2008, Morceiro (2018) highlights that the international crisis fomented by the breakdown of the Lehman Brothers caused a decrease in the global demand which had repercussions in the international trade of manufacturing. The author also explains that from 2009 to 2015 there was a reduction in both the share of manufacturing in GDP and in the share of employment. Table 4, however, shows that as of 2009, the total factor productivity increased slightly, even though there was a decrease in technological variation. The period of continuous growth in the variation of the total factor productivity in Brazil was between 2004 to 2007, which coincides with the period of growth of knowledge-intensive industries. According to Abeles and Rivas (2011) the increase in these industries in Brazil, between 2003 and 2007 was 8.7%. Table 5 presents the estimations and decomposition of the Malmquist index between the years 1996 to 2002 for Brazil.
Table 5 Average Malmquist index for manufacturing, 1996-2002
| R&D | DMUS | Technical efficiency Δ | Technological Δ | TFP Δ |
|---|---|---|---|---|
| High | Manufacture of office, accounting, and computing machinery | 0.912 | 1.156 | 1.054 |
| Medium high | Manufacture of chemicals and chemical products | 1.000 | 1.011 | 1.011 |
| Medium high | Manufacture of machinery and equipment n.e.c. | 0.990 | 1.010 | 1.000 |
| Medium high | Manufacture of electrical machinery and apparatus n.e.c. | 0.924 | 1.071 | 0.989 |
| Medium high | Manufacture of motor vehicles, trailers, and semi-trailers | 1.000 | 1.016 | 1.016 |
| Medium high | Manufacture of other transport equipment | 1.038 | 1.149 | 1.193 |
| Medium low | Manufacture of coke, refined petroleum products and nuclear fuel | 1.000 | 1.162 | 1.162 |
| Medium low | Manufacture of rubber and plastics products | 0.966 | 1.018 | 0.984 |
| Medium low | Manufacture of other non-metallic mineral products | 1.026 | 1.013 | 1.039 |
| Medium low | Manufacture of basic metals | 1.020 | 1.059 | 1.080 |
| Medium low | Manufacture of fabricated metal products, except machinery and equipment | 0.987 | 1.011 | 0.998 |
| Low | Manufacture of food products and beverages | 1.000 | 1.005 | 1.005 |
| Low | Manufacture of tobacco products | 0.896 | 1.152 | 1.032 |
| Low | Manufacture of textiles | 0.970 | 1.019 | 0.988 |
| Low | Manufacture of wearing apparel; dressing and dyeing of fur | 0.947 | 1.010 | 0.956 |
| Low | Leather, leather products and footwear | 0.999 | 1.017 | 1.015 |
| Low | Manufacture of wood and of products of wood and cork | 1.014 | 1.042 | 1.057 |
| Low | Manufacture of paper and paper products | 0.993 | 1.076 | 1.068 |
| Low | Publishing, printing, and reproduction of recorded media | 0.920 | 1.044 | 0.960 |
| Low | Manufacture of furniture; manufacturing n.e.c. | 0.973 | 1.016 | 0.988 |
| Average | 0.978 | 1.051 | 1.028 |
Source: Authors’ own based on DEA results.
The average results show that in the period from 1996 to 2002, there was a small improvement in the total productivity of factors, although the technical efficient variation shows a worsening in the catch-up effect. In the period, the change in technical efficiency showed averages below 1. The gain in TFP was greater in the activities of manufacture of other transport equipment (medium high R&D) and manufacture of coke, refined petroleum products and nuclear fuel (medium low R&D).
As shown in Table 6, among the 20 activities analyzed 10 showed positive changes in the catch-up effect. In comparison with the rest of the evaluated manufacturing activity, the activities related to the production of paper, basic metals and wood products were the ones that advanced the most towards the efficiency frontier of Brazilian manufacturing.
Table 6 Average Malmquist index for manufacturing, 2003-2011
| R&D | DMUS | Technical efficiency Δ | Technological Δ | TFP Δ |
|---|---|---|---|---|
| High | Manufacture of office, accounting, and computing machinery | 1.143 | 1.209 | 1.382 |
| Medium high | Manufacture of chemicals and chemical products | 0.981 | 1.232 | 1.208 |
| Medium high | Manufacture of machinery and equipment n.e.c. | 1.009 | 1.230 | 1.241 |
| Medium high | Manufacture of electrical machinery and apparatus n.e.c. | 1.036 | 1.231 | 1.275 |
| Medium high | Manufacture of motor vehicles, trailers, and semi-trailers | 1.036 | 1.231 | 1.275 |
| Medium high | Manufacture of other transport equipment | 0.989 | 1.230 | 1.216 |
| Medium low | Manufacture of coke, refined petroleum products and nuclear fuel | 1.000 | 1.195 | 1.195 |
| Medium low | Manufacture of rubber and plastics products | 0.991 | 1.229 | 1.218 |
| Medium low | Manufacture of other non-metallic mineral products | 0.998 | 1.230 | 1.227 |
| Medium low | Manufacture of basic metals | 0.953 | 1.230 | 1.172 |
| Medium low | Manufacture of fabricated metal products, except machinery and equipment | 1.025 | 1.230 | 1.261 |
| Low | Manufacture of food products and beverages | 1.000 | 1.237 | 1.237 |
| Low | Manufacture of tobacco products | 1.032 | 1.159 | 1.197 |
| Low | Manufacture of textiles | 0.973 | 1.228 | 1.195 |
| Low | Manufacture of wearing apparel; dressing and dyeing of fur | 1.068 | 1.230 | 1.314 |
| Low | Leather, leather products and footwear | 0.971 | 1.227 | 1.192 |
| Low | Manufacture of wood and of products of wood and cork | 0.947 | 1.228 | 1.163 |
| Low | Manufacture of paper and paper products | 0.959 | 1.230 | 1.180 |
| Low | Publishing, printing, and reproduction of recorded media | 0.882 | 1.227 | 1.082 |
| Low | Manufacture of furniture; manufacturing n.e.c. | 1.040 | 1.230 | 1.279 |
| Average | 1.000 | 1.224 | 1.224 |
Source: Authors’ own based on DEA results.
Table 6 presents the results of the Malmquist index for the years 2003 to 2011.
The results in Table 6 show that between the period 2003-2011 there was an increase in the total productivity of factors, however, the catch-up effect, represented by the change in technical efficiency, remained average without changes. From this, it can be inferred that the increase in average manufacturing productivity in this period was mainly due to the effect of shifting the frontier (technological change) -resulting from the production of a superior product through less use of inputs, a potential result of the use of new technologies. Among the listed industries, the one that obtained the greatest increase in productivity was that of office, accounting, and computing machinery, which uses a high level of R&D.
The lines of activities related to high R&D and medium high R&D showed a relatively high increase in the total factor productivity change. In these groups, only chemical products and other transportation equipment sector received less than 1 in the change index in technical efficiency. In this regard, Abeles and Rivas (2011) point out that Brazilian industrial growth between 2003 and 2007 was driven by capital-intensive activities9 in accordance with the results here presented. Despite the increase in productivity when compared to national manufacture, Brazil still has a strong external dependence on the supply of intermediate inputs in intensive R&D, given that the country is far from the technological frontier.
When comparing the sectors of Brazilian manufacturing, even though there was an increase in the total productivity of factors as, for example, in the sectors with the highest levels of R&D, in the most recent period of the sample, it can be seen that the catch-up effect did not predominate. This can be justified by the fact that these sectors, in Brazil, have little capacity to radiate dynamism in the economy since some high-tech activities do not follow a trajectory of robust industrialization and have a low share of GDP.
4. Final remarks
Using subsectoral information from the United Nations Industrial Development Organization data from a sample of 28 countries were analyzed between the years 1963 to 2012, and 23 subsectors divided into four classifications: high R&D, medium high R&D, medium low R&D and low R&D. Additionally, the efficiency of these countries in each classification was verified in order to relate the results with the level of complexity.
The results of the present work point out the relevance of the relative share of the workforce in the manufacturing activities of high R&D in the level of economic complexity and, consequently, in the income for both advanced and emerging countries, mainly. The econometric results indicated that the importance of the manufacturing sector, in terms of its subsectors, is greater for emerging countries than for advanced ones. These results corroborate the literature that points out the relative importance of manufacturing industry for per capita income in the shape of an inverted U, which implies that for emerging countries manufacturing sectorial composition matters for economic growth because it affects economic complexity.
The results obtained from the DEA allowed us to verify that this relationship also remains with regard to efficiency. It can be noted that the most efficient countries in manufacturing activities with a higher level of R&D also present a significant increase in the level of economic complexity, such as Singapore, South Korea, and Israel, among others. Furthermore, it was observed that the efficiency in the generation of value added and the economic complexity also behaves in an inverted U shape. However, in high R&D activities for emerging countries, the trajectory remained upward, which is consistent with econometric analyses.
Brazil held an intermediate position with regard to the DEA analysis, with an emphasis on Medium High R&D, which occupied 4th place for the years evaluated. The calculation of the Malmquist index allowed us to verify that the increase in the total factor productivity in the country occurred especially between the years 2003 to 2011, being mainly driven by technological change, and not by an increase in technical efficiency (catch up effect). However, manufacturing in Brazil has a small (and decreasing) share in the country's productive structure, low investment in research and development -compared to other developed countries- which contributes to its dependence on external technological inputs importation.
It is worth mentioning that Brazil is a middle-income country in terms of per capita income that, among several other Latin American countries, is on a falling behind trajectory. This paper presented new evidence that better explain this issue by shedding light on its manufacturing subsectors, which the manufacturing catching up effect (i.e., the result of improvement in the production process or products) was underperformed in explaining total factor productivity in the analyzed period.

