


 nova página do texto(beta)
 Inglês (pdf)
 Artigo em XML
 Referências do artigo
 Enviar este artigo por email
 Citado por SciELO
  Similares em
SciELO
Similares em
SciELO 
 Permalink
1. Introduction
Structural change toward manufacturing is the central element in promoting the long-run growth within Kaldorian-structuralism economics. In Kaldorian terms, the long-run growth is associated with the pace of manufacturing growth. Development is not an automatic process, or a market-led process as claimed by laissez-faire growth theories (Chang, 2002). The catching-up results from deliberated industrialization policies (Chang, 2002).
The recent experiences of Asian and Latin American countries illustrate the importance of the state-led industrialization and technological catching-up policy. The different models of development followed can explain the faster growth of Asian economies compared to Latin American ones. The first group of countries adopted a nationalist model of development over the 1980s, while the second one implemented a dependent model of development, grounded on the prescriptions of the Washington Consensus (Kohli, 2012). Until the 1980s, both groups of countries had similar economic features, and the differences pertain to the real exchange rate (RER) and trade policies (Sachs, 1985). Asian economies adopted a competitive RER to develop an export-led manufacturing (outward-looking), meanwhile Latin America embraced import-substitution policies (inward-looking) [Sachs, 1985].
There is a body of empirical literature that documented the influence of RER on long-run growth. The bulk of this literature has shown that RER influences growth. The influence on productive structure is one of the mechanisms suggested by the literature to explain the reasons why the RER affects growth. The RER changes the profitability of tradable and non-tradable sectors (Rodrik, 2008). A competitive RER, by lowering prices of export goods, potentially benefits the sectors exposed to international competition (Sachs, 1985).
Manufacturing is the sector with the greater ability to generate innovative activities, increasing returns to scale and the backward/forward linkages (Tregenna, 2008, Szirmai, 2012). Enhancing the importance of modern sectors within productive structure is the engine of productivity growth (Kaldor, 1966). Manufacturing sectors play a special role in promoting the long-run growth; in particular for the developing countries, as its productivity growth depends on the access to the technology from developed countries, and the promotion of structural change towards modern sectors (Ocampo and Vos, 2008). In terms of Thirlwall’s law, the RER, by influencing the sectoral composition of the economy, changes the ratio of income-elasticities for exports and imports and then the growth rate of the economy consistent with balance of payments constraint.
The objective of this article is twofold. Firstly, the manner through which RER influences economic growth is discussed within the Kaldorian theory. The second goal is testing empirically the relationship between RER and structural change at aggregated and sectoral levels. The manufacturing share of Gross Domestic Product (GDP) and employment, likewise the economic complexity index, represent the structural change in an aggregated perspective. The sectoral performance is represented by the employment growth. Sectoral database covers 19 manufacturing sectors from 41 countries classified in accordance with International Standard Industrial Classification 4.0. Special attention was given to sectoral estimates for developing countries.
This article consists of eight parts. Section 2 discusses the relation between structural change and growth and the operative channels through which RER influences structural change. Section 3 analyzes the balance of payments model linking it with RER policy for development. Section 4 presents the empirical strategy and database employed in estimates, while Section 5 reports the results. Section 6 tests the association between RER and economic complexity. Section 7 presents the regressions performed to assess the influence of RER on sectoral performance. Section 8 is the conclusion.
2. Structural change, RER and economic growth
Economic growth is a process with a continuing transformation of the productive structures based upon creative destruction in the Schumpeterian sense (Ocampo, 2005). That explains why the manufacturing sectors have a prominent role in long-term growth. These sectors are more capable of inducing domestic integration through backward and forward links with other sectors. The growth of manufacturing has a pulling effect on the economy (Tregenna, 2008). This sector requires greater capital accumulation than other sectors, it is more dynamic in terms of innovative activities (embodied and disembodied technological progress) and has increasing returns to scale (Szirmai, 2012). In addition, it is associated with better jobs, higher savings rates and stronger contributions of human capital and institutions to the economic growth of middle-income economies (Su and Yao, 2016).
The cross-country differences of long-run performance are explained by the industrialization degree. The faster is the growth rate of manufacturing, the faster will be the growth rate of the economy (Kaldor, 1966). The ability to promote the structural change to manufacturing is associated with success or failure concerning the long-run growth. Developed countries are those that promoted industrialization of productive structure, whereas developing countries are those trapped within primary sectors.
Ros (2015) offers a theoretical model where structural change acts in promoting productivity growth. Ros (2015) assumes that the growth of aggregated labor productivity p is a weighted sum of industrial productivity growth p ind and non-industrial productivity growth p nind :
The manufacturing productivity growth is defined abide by the second law of Kaldor, according to which the productivity of manufacturing depends positively on industrial demand growth q ind :
The constant α0 is the autonomous rate of capital accumulation per worker. The parameter v is the Verdoorn’s coefficient and indicates how productivity is influenced by demand growth. As industrial labor productivity grows, the difference between the output growth rate qind and industrial employees eind, Equation [2] becomes:
The magnitude of Verdoorn’s coefficient is supposed to range between zero and one to show the positive relation between industrial employment growth (demand) and industrial productivity growth, in other words, the increasing returns to scale (Ros, 2015).
In turn, the non-industrial sectors are unable to generate increasing returns to scale. Therefore, the non-industrial productivity growth pnind is determined residually as the difference between output growth qnind and employment growth enind . The link between non-industrial and industrial sectors is such that the output growth rate of the first sector relies on the second:
Ros (2015) defines the non-industrial employment growth as the difference between the labor supply growth n and industrial employment growth eind:
Representing the employment growth e as the following identity:
where Ψind and Ψnind are respectively the share of industrial and the non-industrial employment in the overall employment. If n equals e, and introducing [6] into [5], obtains:
Ros (2015)'s formalization leads to the following determination of productivity growth of non-industrial sectors:
Introducing [3] and [7] into [1], gets:
Equation [1.1] represents the third Kaldor’s law and states that the productivity growth depends on manufacturing activities (Ros, 2015). The first term represents the second law of Kaldor, while the second term is the non-industrial output growth. The third term stands for the classical’s development mechanism of reallocation of employment from non-industrial to industrial sectors (Ros, 2015). In short, Equation [1.1] shows that the long-run performance depends positively (negatively) on industrial production (via output and employment) and on structural change towards manufacturing/modern activities (Ros, 2015).
A body of empirical literature in economics suggest that RER influences growth (e.g., Gala, 2008; Rodrik, 2008). One of the transmission channels is the effect on productive structure via firms’ profitability. The RER may influence the profitability of some sectors, promoting a structural change towards these sectors. A possible channel for this effect is the reduced labor costs due to a weak national currency, as Blecker (1989) has pointed out. The rationale is that devaluating the RER increases the markup rate of national firms as they increase its prices in relation to the prices charged by foreign firms. As a result, the wage share of income reduces, making capital accumulation based on internal funds possible. Put differently, a devalued RER enlarges the firms’ profit-rate by transferring income from workers (whose propensity to save is lower in relation to the capitalists) to firms (Bhalla, 2012; Bahmani-Oskooe and Hajilee, 2010; Glüzmann, Levy-Yeyati, and Sturzenegger, 2012).
There are two contrasting effects of pursuing a competitive RER. Firstly, it increases export revenues. By making domestic goods cheaper in the international market, a competitive RER increases profitability of tradable sectors (Nucci and Pozzolo, 2001). Considering the lower real wages induced by a weak national currency, such growth-strategy favors the tradable (primary and manufacturing) sectors at detriment of non-tradable (services) activities. Secondly, the imports of inputs become more expensive, leading to possible harmful effects of pursuing a competitive RER (Nucci and Pozzolo, 2001). Thus, the influence of a weak national currency on productive structure depends on which effect prevails, although it must be emphasized that the outward orientation and the degree of imported inputs in the productive process change inasmuch as the RER devaluations influence the productive structure via the expansion of exports in relation of GDP and the industrialization that replaces imports with national inputs.
In other words, the RER affects firms’ profitability, which induces its decision of production, employment, and investment (Frenkel and Ros, 2006). The RER policy expands, or reduces, the importance of tradable sectors within the productive structure (Rodrik, 2008). As tradable sectors encompass manufacturing, the RER may promote a structural change towards sectors with increasing returns to scale, namely manufacturing activities (Ros and Skott, 1998). In this sense, Rodrik (2008) states that a competitive RER boosts the profitability of tradable sectors, increasing its importance in productive structure. The author offers two explanations for the link between a devalued RER, tradable sectors’ profitability, and growth. The first explanation is based on the idea that faulty institutions of low-income countries act as a higher tax on tradable sectors, resulting in misallocation of resources in terms of investment. By increasing profitability, RER devaluations increase investment and efficiency (Rodrik, 2008). The second explanation states that a competitive RER acts as a substitute for industrial policy to remedy the market failures of tradable sectors. Consequently, a competitive RER induces the production of new products, boosting the complexity and long-run growth (Rodrik, 2008). Moreover, the expansion of tradable activities generates different forms of positive externalities (learning by doing, learning by investing and technological spillovers) to the rest of the economy (see Rapetti, 2020).
3. The growth-effects of RER in the balance of payments constrained growth models
The long-run growth in the Kaldorian tradition is demand-led. Including elements of the structuralist approach, these models show that asymmetric productive structures produce uneven growth, affecting the output growth rate consistent with balance-of-payments equilibrium (Thirlwall, 1979). The canonical version of the balance of payments constrained growth model (BPCG) states that the output growth rate (y bp) is given by the ratio of income-elasticities of demand for exports (ε) to imports (η) multiplied by the economic growth rate of the rest of the world, zt:
The greater (smaller) the income-elasticities of demand for exports (imports) is, the greater will be the growth of the economy consistent with balance-of-payments equilibrium. Income-elasticities have a dual nature. On the one hand, they are determinants of aggregate demand of the domestic economy; it is the maximum that the economy can grow without external crises. On the other hand, the income-elasticities result from a myriad of factors in the supply side.
Differences in the income-elasticities explain the divergent growth path between rich and poor societies. Industrialized economies export high-technological goods with higher income-elasticity of exports and low income-elasticity of imports. A structural change towards more technology-intensive/manufacturing sectors drives the economy to faster growth rates. The opposite is valid for impoverished economies.
Araujo and Lima (2007) expressed the canonical BPCG model in terms of the sectorial composition of the economy. They argue that the growth rate of output is associated with the sectoral composition of the economy, in terms of sectoral income-elasticities. In this approach, the elasticities are weighted by the sectoral share of the total exports and imports. Even that sectoral elasticities and world income growth are constant, the domestic economy grows faster by increasing the sectoral share of exports, whose income-elasticities are greater, or by reducing the sectoral share of imports, whose income-elasticities are higher (Araujo and Lima, 2007). Thus, structural change becomes a prominent strategy to boost growth.
It turns out that the RER does not influence growth in the canonical version of Thirlwall’s law or in its multisectoral version. This follows because of the assumption of the validity of the law of one price. However, many authors have argued that the income-elasticities are endogenous in relation to RER (e.g., Missio and Jayme Jr, 2012; Bresser-Pereira, Oreiro, and Marconi, 2015; Marconi et al., 2021). Such endogeneity is justified by the effects of rer on the productive structure and then on the composition of elasticities1. There are three effects of RER on productive structure in this literature:
i) Composition effect: The RER changes the relative prices between tradable and non-tradable goods; hence a competitive RER induces a structural change towards more technology-intensive tradable sectors (Ferrari, Freitas and Barbosa-Filho, 2013). The expanded exports stimulate the production of these sectors whose income-elasticities of exports are greater. As a result, it changes the composition of productive structure in favor of these sectors (such as the composition of elasticities).
ii) Diversification effect: This is the effects of a competitive RER on the number of goods exported and imported (Cimoli, Fleitas, and Porcile, 2013; Gabriel, Jayme Jr, and Oreiro, 2016). A more competitive RER induces changes in productive structure in direction of outward oriented activities. The argument is that the expanded profit-rate induces capital accumulation in a way that new sectors/products are created.
iii) Sophistication effect: This is the effect of a competitive RER on the complexity of the economy. The argument is that a competitive RER increases the retained profits required to finance new investments in R&D, leading to more sophisticated/productive manufacturing techniques. The new technologies, combined with new productive activities, lead to production of new products, reinforcing the diversifying effects of a competitive RER on productive structure (Barbosa-Filho, 2006; Missio and Jayme Jr, 2012; Missio, Araujo, and Jayme, 2017).
It is possible to illustrate the effects of RER on the income-elasticity of exports in the multisectoral version of Thirlwall’s law in formal terms. Assuming that the aggregated income-elasticity of exports is a weighted average of the k sectoral elasticities:
Equation [9] means that the mix of exports is composed of k goods, each one with a specific income-elasticity of demand for exports εi weighted by its share in the total exports ωxi . As each exported good has a specific income-elasticity, it implies that the income-elasticity of the economy depends on the composition of total exports (productive structure). Equation [9] is re-written to express the three effects in what follows:
i) Composition effect: A competitive RER increases the share of export sectors of goods with great income-elasticity within the productive structure:
iii) Sophistication effect: A competitive RER increases the income-elasticities of goods produced in the domestic economy:
The argument pursued in this article that a competitive RER affects the long-run growth of economies by promoting structural change is summarized as follows:
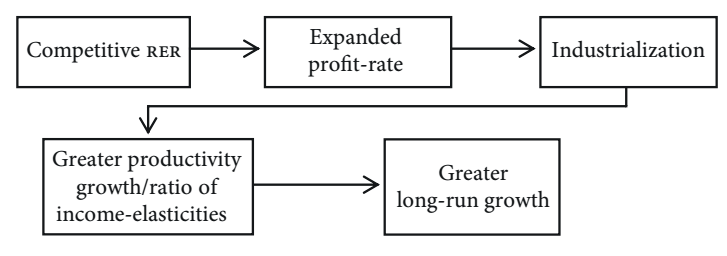
In a nutshell, structural change toward manufacturing sectors is the essential element to explain long-run growth within the Kaldorian-structuralist perspective. Industrialization increases labor productivity/long-run performance. As a result, the modernization of productive structure fosters the growth in accordance with BPCG models by changing the ratio of income-elasticities for exports and imports. Therefore, the key to achieve a greater long-run growth is the adoption of policies that promote structural changes toward manufacturing. It is in this direction that a competitive RER promotes long-run growth, by influencing the composition of the productive structure.
The empirical studies point out the existence of a statistically significant effect of RER on economic growth (e.g., Gala, 2008; Rodrik, 2008; Boggio and Barbieri, 2017, among others). This literature confirms that RER undervaluation has positive effects on economic growth, and such effects are strongest in emerging and developing economies. This extensive literature has recently been surveyed by Rapetti (2020) and Demir and Razmi (2021).
However, few empirical studies tested the effects of RER on the productive structure (e.g., Rodrik, 2008; Gabriel and Missio, 2018; Gabriel and Ribeiro, 2019; Marconi et al., 2021, among others). Much of this literature consists of aggregate studies without a clear identification of the relevant channels (Demir and Razmi, 2021). In order to contribute to this literature, this study performed a series of econometric equations to evaluate the relationship between rer and the structural change at aggregated and sectoral levels. The goal is to measure the RER influence on productive structure, considering it as a possible transmission channel of the competitive RER to the long-run growth (represented by Equation [1.1] -developed by Ros (2015), and by Equation [8]- the corollary of Thirlwall’s law).
4. Empirical strategy and database
The empirical strategy of this study consists of performing regressions to explain structural changes in 148 countries2 over the period 1991-2018. The estimated equation is:
where i and t represent, respectively, country and time (5-year) indexes. Estimates were performed with time and country fixed effects, f t and f i respectively. Three dependent variables are employed: (i) manufacturing as a percentage of GDP; (ii) the employment in manufacturing as a percentage of total employment (World Bank database); and (iii) the economic complexity index (Observatory of Economic Complexity).
Estimates use three measures of exchange rate: (i) the real exchange rate provided by the World Bank; (ii) a measure of exchange rate misalignment discounting the Balassa-Samuelson effect from RER using the per capita GDP as fundamental of the exchange rate (the Balassa-Samuelson effect is valid and an increase of 1% in per capita income appreciates the exchange rate by 0.19%); and (iii) a measure of exchange rate misalignment calculated employing terms of trade, the net foreign asset, and the wage-share of GDP as fundamental (only the variable wage-share in GDP is statistically significant; an increase of 1% in wage-share makes the national currency more appreciated by 0.24%)3. The exchange rate misalignment was calculated following the procedure of Rodrik (2008), which produces the mis 1 (Balassa-Samuelson) and mis 2 (terms of trade, net foreign assets and wage-share). When the exchange rate misalignments are greater than zero, the national currency is appreciated. Nonetheless, when it is lower than zero, the national currency depreciated. Hence, a negative signal of β1 in Equation [13] means that a competitive RER is positively associated with structural change.
Other variables are controlled in regressions such as terms of trade, government consumption, wage-share (labor costs) and income level per capita (structural change induced by increases in income level). The variables terms of trade and income level per capita come from the World Bank database. Wage-share and government consumption come from the Penn World database. All variables are employed in logarithm form.
Two different specifications are performed. The difference is that one controls government consumption, in addition to other variables, excluding the wage-share (model 1); while the other specification controls the wage-share, in addition to other variables, excluding government consumption (model 2). This is adopted to avoid collinearity between government consumption and wage-share, since both variables are represented as percentual share of GDP. The estimates are performed using dynamic panel data models in a system of equations using the levels and differences of independent variables as instruments. This methodology addresses the issue of endogeneity as estimates are performed by Generalized Method of Moments4.
5. Baseline estimates
The results of the baseline model have fitted well. The test for autocorrelation of order 2 in errors and Sargan/Hansen test for validity of the instruments did not reject the null hypothesis5. Table 1 presents the estimates using the manufacturing share in GDP as dependent variable. The output suggests that all estimated coefficients for the measures of exchange rate misalignment are statistically significant (at least at 10% of critical values) and negative. The results are robust and follow the same direction (even though the parameters differ according to the fundamentals of exchange rate and the specification).
Table 1 RER and structural change (manufacturing share in GDP)
| Variable | (1) | (2) | (3) | (4) | (5) | (6) |
|---|---|---|---|---|---|---|
| lag of dependent variable | 0.89*** (0.01) | 0.84*** (0.01) | 0.88*** (0.01) | 0.84*** (0.01) | 0.73*** (0.04) | 0.80*** (0.01) |
| LRER | -0.11*** (0.02) | -0.06*** (0.01) | ||||
| mis1 | -0.13*** (0.02) | -0.09*** (0.01) | ||||
| mis2 | -0.29*** (0.06) | -0.04* (0.02) | ||||
| income level | 0.05*** (0.01) | 0.03*** (0.008) | 0.03*** (0.008) | 0.02*** (0.006) | 0.17*** (0.03) | 0.02*** (0.01) |
| terms of trade | -0.07 (0.05) | 0.29*** (0.06) | -0.15*** (0.05) | 0.23*** (0.06) | 0.67*** (0.19) | 0.39*** (0.09) |
| government consumption | -0.01 (0.02) | 0.008 (0.01) | -0.11 (0.09) | |||
| wage-share | -0.04*** (0.008) | -0.03** (0.01) | -0.002 (0.01) | |||
| AR (2) | 0.52 | 0.84 | 0.47 | 0.80 | 0.16 | 0.11 |
| Sargan | 0.95 | 0.70 | 0.94 | 0.69 | 0.83 | 0.89 |
| Hansen | 0.64 | 0.50 | 0.68 | 0.73 | 0.16 | 0.27 |
| Hansen-Diff | 0.93 | 0.67 | 0.95 | 0.97 | 0.30 | 0.51 |
| Groups | 136 | 111 | 136 | 111 | 106 | 106 |
| Instruments | 78 | 76 | 78 | 76 | 41 | 75 |
Notes: 1/ estimates using two-step System GMM with Time Dummies; 2/ a denotes that regression was performed using the robust matrix of variance-covariance robust for heteroskedasticity; 3/ *, ** and *** indicate significance at 10%, 5% and 1%, respectively; 4/ standard errors between parentheses.
The evidence suggests that a more depreciated RER rate promotes a structural change toward manufacturing sectors in terms of GDP and employment. Making the national currency 10% more depreciated increases the manufacturing share in GDP share by 1.1% (model 1) and 0.6% (model 2) for LRER; by 1.3% (model 1) and 0.9% (model 2) for mis 1; by 2.9% (model 1) and 0.4% (model 2) for mis 2 over a five-year period. These results are in line with the findings by Gabriel and Missio (2018) according to which an undervalued RER positively affects manufacturing sectors, especially in developing economies. Regressions also point that share of manufacturing in GDP is positively associated with income level (high-income countries have elevated manufacturing share in GDP) and terms of trade. However, it does not provide robust evidence that government consumption influences it.
Estimates of columns 2 and 4 indicate that an increase of 10% in wage-share reduces manufacturing share in GDP by 3% and 4%, respectively. These findings are suggestive that pursuing a competitive RER expands the manufacturing share in GDP directly and indirectly (assuming that a weak national currency reduces the values of this variable). The direct effect, represented by the introduction of the independent variables RER, mis 1 and mis 2 into the econometric regressions, states that pursuing a competitive RER expands the manufacturing activities in relation to primary and services sectors. The indirect effect, in turn, means that, as a competitive RER reduces the wage-share -as indicated by Blecker (1989), it may promote industrialization by reducing labor costs. Interestingly, the effects of RER are reduced when the wage-share is controlled, which reinforces the evidence that the positive influence of a competitive RER on manufacturing may occur via smaller labor costs, once these variables tend to be associated, leading to a possible collinearity.
Table 2 presents the estimates using the manufacturing share in employment as dependent variable.
Table 2 RER and structural change (manufacturing share in employment)
| Variable | (1) | (2) | (3) | (4) | (5) | (6) |
|---|---|---|---|---|---|---|
| lag of dependent variable | 0.98*** (0.05) | 0.73*** (0.07) | 0.97*** (0.05) | 0.72*** (0.17) | 0.80*** (0.16) | 0.89*** (0.10) |
| LRER | -0.12*** (0.04) | 0.17* (0.10) | ||||
| mis1 | -0.11*** (0.04) | 0.31 (0.29) | ||||
| mis2 | 0.13 (0.12) | 0.02 (0.08) | ||||
| income level | 0.009 (0.02) | -0.08 (0.05) | -0.01 (0.02) | -0.21 (0.13) | -0.05 (0.08) | -0.57* (0.29) |
| terms of trade | -0.16 (0.20) | 0.33 | -0.17 (0.20) | 1.30* (0.75) | 0.19 (0.71) | 0.91 (0.56) |
| government consumption | -0.05 (0.03) | -0.05 (0.03) | -0.21 (0.14) | |||
| wage-share | -0.76*** (0.23) | -0.40 (0.33) | -0.57** (0.29) | |||
| AR (2) | 0.15 | 0.18 | 0.16 | 0.24 | 0.11 | 0.15 |
| Sargan | 0.05 | 0.00 | 0.00 | 0.06 | 0.00 | 0.00 |
| Hansen | 0.12 | 0.37 | 0.14 | 0.34 | 0.30 | 0.33 |
| Hansen-Diff | 0.23 | 0.71 | 0.27 | 0.29 | 0.059 | 0.12 |
| Groups | 138 | 114 | 138 | 114 | 109 | 109 |
| Instruments | 41 | 56 | 41 | 20 | 28 | 27 |
Notes: 1/ estimates using two-step System GMM with Time Dummies; 2/ a denotes that regression was performed using the robust matrix of variance-covariance robust for heteroskedasticity; 3/ *, ** and *** indicate significance at 10%, 5% and 1%, respectively; 4/ standard errors between parentheses.
A devaluation of 10% in RER increases the manufacturing share in employment by 1.2% for LRER and 1.1% for mis 1 (all for model 1). Regressions do not provide evidence that the manufacturing share in employment may be associated with income level, terms of trade, or government consumption. Notwithstanding, specifications presented in columns 2 and 6 suggest that the wage-share is negatively associated with transfers of workers from non-manufacturing activities to manufacturing activities. An increase of 10% in the wage-share reduces by 7.6% and 5.7% the share of workers in the manufacturing activities, respectively. Once again, estimates suggest that a competitive rer may foster the manufacturing activities within the productive structure by means of a reduced wage-share (labor costs)/expanded international competitiveness6.
6. RER and economic complexity
Structural change is a broader process than the growth of industry and modern services, it is about the ability to create new activities and to integrate the domestic sectors (Ocampo and Vos, 2008). It concerns the diversification of productive structure, or the expansion of productive capability beyond the traditional activities (Hidalgo et al., 2011). The advances of economic complexity literature improved the understanding of structural change in a broader perspective (Hartmann et al., 2017). Structural change encompasses the multiplicity of useful knowledge embedded in productive structure (Hidalgo et al., 2011). More complex economies produce a diverse mix of more knowledge-intensive goods, while simpler economies produce few products with less knowledge-intensive (Hidalgo et al., 2011).
Structural change is a process of acquired knowledge on how to produce more complex goods (Hidalgo et al., 2011). Hidalgo et al. (2011) created the Economic Complexity Index (ECI) to measure the knowledge embedded in productive structure. Their argument is that the amount of knowledge is expressed in the diversity and the ubiquity of goods produced. Economies that have knowledge to produce an elevated variety of goods are more diversified and then more complex. Whilst the production of more complex goods is possible only in countries that have such knowledge, therefore those products are less ubiquitous. Economies with this “rare” knowledge embedded in productive structure are more complex (Hidalgo et al., 2011).
The economic complexity offers a measure of the diversity of accumulated knowledge and know how incorporated in the productive structure associated with the ability of firms and individuals to link collectively in a network (Hidalgo, 2015). Hartmann et al. (2017) claim that the degree of complexity of productive structure also captures information about institutions. Hartmann et al. (2017) argue that post-colonial societies, with a productive structure poorly diversified, additionally specialized in agriculture products, have flawed institutions (i.e., unequal distribution of knowledge, political power, and income). Meanwhile, societies with a productive structure more diversified and capable of producing sophisticated products have reliable and inclusive institutions (Hartmann et al., 2017).
A series of regressions was performed to test the association between economic complexity and RER. The same empirical strategy of earlier estimates was adopted7. Table 3 reports the estimates.
Table 3 RER and economic complexity
| Variable | (1) | (2) | (3) | (4)a | (5) | (6) |
|---|---|---|---|---|---|---|
| lag of dependent variable | 0.80*** (0.03) | 0.73*** (0.09) | 0.81*** (0.03) | 0.77*** (0.09) | 0.91*** (0.01) | 0.80*** (0.02) |
| LRER | -0.001** (0.0007) | -0.0003 (0.001) | ||||
| mis1 | -0.001** (0.0006) | -0.0007 (0.001) | ||||
| mis 2 | -0.001*** (0.0004) | -0.00001 (0.0004) | ||||
| income level | 0.001*** (0.0003) | 0.0007 (0.0005) | 0.001*** (0.003) | 0.001 (0.0007) | -0.000002 (0.0001) | 0.0006** (0.0002) |
| terms of trade | 0.01*** (0.002) | 0.01** (0.003) | 0.009*** (0.001) | 0.007*** (0.002) | 0.002*** (0.0008) | 0.004*** (0.001) |
| government consumption | -0.0005 (0.0004) | -0.0002 (0.0003) | -0.0004 (0.0002) | |||
| wage-share | 0.001 (0.001) | 0.001 (0.002) | 0.002*** (0.0006) | |||
| AR (2) | 0.41 | 0.46 | 0.40 | 0.41 | 0.96 | 0.91 |
| Sargan | 0.42 | 0.12 | 0.56 | 0.03 | 0.38 | 0.23 |
| Hansen | 0.28 | 0.20 | 0.33 | 0.39 | 0.38 | 0.11 |
| Hansen-Diff | 0.12 | 0.41 | 0.22 | 0.77 | 0.17 | 0.18 |
| Groups | 116 | 99 | 116 | 99 | 88 | 88 |
| Instruments | 56 | 52 | 54 | 54 | 68 | 62 |
Notes: 1/ estimates using two-step System GMM with Time Dummies; 2/ a denotes that regression was performed using the robust matrix of variance-covariance robust for heteroskedasticity; 3/ *, ** and *** indicate significance at 10%, 5% and 1%, respectively; 4/ standard errors between parentheses.
The regressions provide evidence that a competitive RER is associated with greater economic complexity. The estimated parameters of LRER, mis 1 and mis 2 are significant at 5% and around -0.0001. Interestingly, this parameter is statistically significant only in the specification that controls government spending instead of the wage-share. Estimates, however, do not provide evidence in favor of government spending influencing economic complexity. Whilst the parameter of the wage-share is significant at 1% and around 0.002 in the specification of column 6, which suggests that societies with more equalitarian functional income distribution have a productive structure more complex. Furthermore, the output indicates that the degree of economic complexity is positively associated with income per capita and terms of trade.
7. RER and employment growth in manufacturing sectors
This section assesses the influence of RER on economic structural change at the sectoral level. The empirical strategy consists of performing regressions to explain growth of employment of 19 manufacturing sectors in 41 countries over the period 2000-20148. The basic estimating equation is:
where i, s and t denote country, sector, and time index, respectively. Estimates were performed with time and country-sectors fixed effects, ft and fs respectively. The dependent variable is the growth rate (first difference in logarithm) of manufacturing employment and comes from the World Input-Output Database (WIOD) provided by Timmer et al. (2015). The sectors are classified according to the International Standard Industrial Classification of All Economic Activities (ISIC) 4.09. The measure of exchange rate employed in regressions is the index of Couharde et al. (2017), which is represented by miscepii.
Four specifications are performed considering the variable of interest (miscepii) and interacted variables between miscepii with the sectoral share of imported inputs (mt,i) with the share of sectoral income that comes from exports (xt,i), and net exports (nxt,i)10:
The variables import, export and net export are calculated using the WIOD 2016 release. Equations [15]-[18] aim at capturing the heterogeneous effect of exchange rate movements associated with the share of inputs coming from abroad (import) and the share of sectoral income coming from exports (export). Equation [18] captures the heterogeneous effect of exchange rate movements associated with the difference between revenue (export) and cost (import).
The estimates were performed using the method of Ordinary Least Square. Following Vaz and Baer (2014), it is argued that it is unlikely that one of the manufacturing sectors determines the RER, mainly because each sector represents a small portion of the productive structure. Moreover, the use of the index of misalignment of Couharde et al. (2017) mitigates the effects of productivity growth, terms of trade, and net foreign assets on the exchange rate. Therefore, the possibility that the non-controlled variables produce vies in sectoral estimates is eschewed. The estimates are reported in Table 4.
Table 4 RER and manufacturing sectors (employment growth)
| Variable | (1) | (2) | (3) | (4) | (5) |
|---|---|---|---|---|---|
| miscepii | -0.12*** | -0.14*** | -0.17*** | -0.12*** | -0.17*** |
| miscepii×export | 0.05 | -0.01 | |||
| miscepii×import | 0.13 | 0.14 | |||
| miscepii×liquid export | -0.02 | ||||
| Constant | -0.02*** | -0.02*** | -0.02*** | -0.02*** | -0.02*** |
| Hausmann p-value/ (FE(RE) | 0.08/ FE | 0.00/ FE | 0.01/ FE | 0.03/ FE | 0.01/ FE |
| Observations | 10,670 | 10,670 | 10,670 | 10,670 | 10,670 |
Notes: 1/ standard errors adjusted for clusters of countries; 2/ year fixed effects was employed in all estimates.
Regressions indicate that a competitive RER increases the growth rate of employment in manufacturing sectors. The estimated parameter of mis cepii ranges from 0.12 until 0.17. Thus, a 1% devalued exchange rate expands manufacturing employment by 0.15% on average. The regressions did not provide evidence that the interacted variables are significant.
The empirical evidence indicate that the RER is important for structural change at the aggregate and sectoral levels. Yet, the literature indicates that this effect is not straightforward, since it is associated with sectoral characteristics. Sectoral estimates are performed to assess the sectoral heterogeneity of the effects of a competitive RER. Adhering to the empirical strategy of Vaz and Baer (2014), the following equation is estimated:
where i, s and t denote country, sector, and time index. Estimates are performed with time and country-sectors fixed effects, ft and fs. The rationale of the Equation [19] is that movements of the real exchange rate affect differently the performance of each manufacturing sector (Vaz and Baer, 2014). Equation [19] captures this effect by estimating a slope to each country (mist,i (country) and to each sector within a country (mist,i (country(SEC), where country and SEC are dummy variables, respectively, for developing countries (Brazil, Indonesia, India, Korea, and Mexico) and their manufacturing sectors.
Table 5 reports the effects of an exchange rate devaluation of 1% on sectoral performance in terms of employment growth provided by the estimates of Equation [19].
Table 5 Sectoral heterogeneity: Effects of a 1% devaluation
| Sectors | Brazil | Indonesia | India | Mexico | Korea |
|---|---|---|---|---|---|
| 10-12 Food products, beverages and tobacco | 0.22 | 0.57 | 0.24 | -0.02 | 0.38 |
| 13-15 Textiles, wearing apparel and leather | 0.12 | 0.35 | -0.04 | 0.15 | 0.37 |
| 16 Wood and of products of wood and cork | 0.36 | 0.82 | -0.54 | 0.23 | 0.6 |
| 17 Paper and paper products | 0.26 | 0.08 | 0.25 | 0.09 | 0.2 |
| 18 Printing | 0.08 | 0.08 | 0.22 | -0.03 | 0.44 |
| 19 Coke and refined petroleum products | 1.06 | 0.48 | 1.26 | -0.18 | 0.12 |
| 20 Chemicals and chemical products | 0.9 | 0.24 | -0.23 | 0.16 | 0.03 |
| 21 Basic pharmaceutical products | 0.61 | 0.24 | -0.28 | 0.06 | 0.22 |
| 22 Rubber and plastic products | 0.24 | -0.01 | -1.28 | -0.04 | 0.49 |
| 23 Other non-metallic mineral products | 0.25 | 0.71 | -0.29 | -0.13 | 0.17 |
| 24 Basic metals | 0.01 | 0.58 | -0.07 | 0.13 | 0.15 |
| 25 Fabricated metal products | 0.39 | 0.58 | -0.17 | 0.18 | -0.04 |
| 26 Computer, electronic and optical products | 0.14 | 0.25 | -0.37 | 0.22 | 0.08 |
| 27 Electrical equipment | 0.03 | 0.25 | -0.41 | 0.42 | 0.16 |
| 28 Machinery and equipment | 0.25 | 1.1 | 0.18 | 0.33 | 0.23 |
| 29 Motor vehicles, trailers and semi-trailers | 0.41 | 0.94 | 0.82 | 0.08 | 0.13 |
| 30 Other transport equipment | 0.3 | 0.94 | 0.82 | 0.33 | 0.11 |
Notes: 1/ estimates are not fully reported due to space limits (available upon request); 2/ the results represent the full effects of a devaluation of 1% in RER (the sum of all estimated and statistically significant parameters); 3/ year fixed effects were employed in all estimates; 4/ robust errors clustered by countries.
The estimates confirmed the heterogeneous effects of RER across country-sectors. Although the estimates of Equation [19] provide evidence suggesting that a competitive RER increases the growth of manufacturing employment of the majority sectors, regressions also show that devaluations may hurt the growth of employment in few sectors. This is the case of Brazil, Indonesia, Mexico, and Korea. Conversely, the regressions are contrasting for the Indian economy as far as the estimates indicate that devaluations of RER reduce the growth of employment in the majority of manufacturing sectors and promote it in a few others.
8. Concluding remarks
This article argued that the structural change towards manufacturing sectors is elementary in promoting long-run growth, because of its effects on productivity growth (as Ros, 2015, has modelled in his version of the third Kaldor’s law), or by changing the composition of income-elasticities of foreign trade (as many theorists of Thirlwall’s law have been arguing), which leads to a greater growth rate of output consistent with balance of payments equilibrium.
The argument developed is that a competitive RER is associated with changes in productive structure in direction of modern and more complex activities, as long it increases the profit-rate and financing capacity for investment and R&D.
The empirical findings corroborated the proposition that pursuing a competitive RER is a necessary condition to promote the industrialization of productive structure, which is in line with the results of the empirical literature. Our findings also indicated that a competitive RER is associated with the creation of “good jobs” related to the manufacturing activities. Thus, pursuing a competitive RER may contribute to improve the quality of life of the society by transferring workers from low-productivity activities towards high-productivity activities and by reducing the informality of labor market, which is imperative for promoting a more equalitarian income distribution. Moreover, the findings also suggest that a RER policy for development, by pursuing a competitive RER, increases the long-run growth as it induces an important engine of long-run growth share of manufacturing activities within the productive structure. Therefore, pursuing a competitive RER is a useful policy to create the conditions to reach a more developed/industrialized economy and, then, a greater long-run growth. However, it is important to highlight that structural change is a multifaceted phenomenon. Pursuing a competitive rer should not be seen as a panacea or a magic solution that solves all issues associated with economic development of poor societies. This study explored only one aspect of structural change arguing that economic development, understood as an industrialized/sophisticated productive structure, requires a competitive RER.

