


 nueva página del texto (beta)
 Inglés (pdf)
 Artículo en XML
 Referencias del artículo
 Enviar artículo por email
 Citado por SciELO
  Similares en
SciELO
Similares en
SciELO 
 Permalink
1. INTRODUCTION
Although the exact origin of the Covid-19 disease is still unknown, in late December 2019, a previously unidentified Coronavirus, now named as the severe acute respiratory syndrome coronavirus 2 (SARS-CoV-2), emerged in Wuhan, China and spread globally. Since then, the pandemic moved from Asia to Europe and the US, and as developed countries are gradually vaccinating their way out of the Covid crisis, a deadly second wave has overwhelmed less developed countries of South Asia (see Figure 1). India has witnessed a rapid increase in Covid positive cases since late March 2021 and by early May, officially reported daily cases touched the grim milestone of 400,000. The results of this severe second wave have been devastating: Acute shortage of hospital beds, medication, and medical staff even in big cities like Delhi, Bengaluru, Lucknow, and many more have been widely reported. One of the most pressing concerns have been a shortage of medical oxygen to treat Covid patients, a situation that has caused numerous avoidable fatalities (Wire Staff, 2021). But the problem is not going to be confined to India. Neighboring countries are also witnessing surges that threaten to overrun their health infrastructure (UN News, 2021).
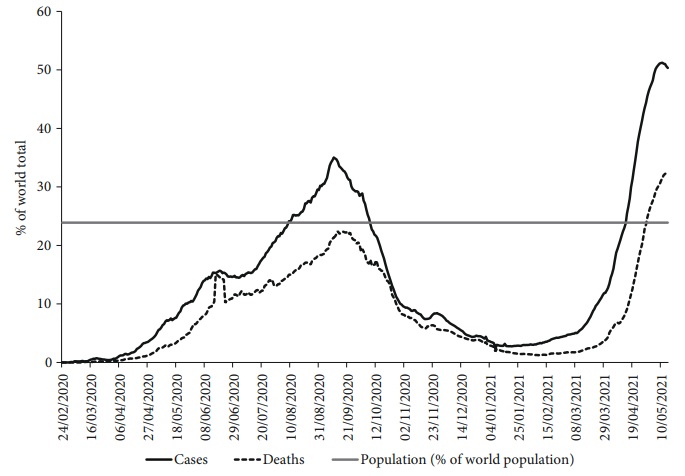
Note: The horizontal dashed line is the population share of South Asia in the world (as 23.9%). Data covers the period from 24th February 2020 to 15th May 2021.
Source: Chart created using data from the Our World in Data website: <https://ourworldindata.org/coronavirus>.
Figure 1 Proportion of daily reported COVID-19 cases and deaths in South Asia as a percentage of the world total
The strategies to mitigate COVID-19 have included both medical interventions (MIs) and non-pharmaceutical interventions (NPIs). While MIs involve long-term preparedness of health infrastructure and immediate treatment of symptoms with approved drugs, hospitalization in severe cases and administration of medical oxygen, NPIs include testing, contact-tracing, quarantining infected persons, mandating the use of masks in public, shelter-in place, or imposing lockdowns. Scholarly and reflective pieces on the pandemic have shown that across countries, the pace and shape of the MIs and NPIs, depend on the robustness of governance and broader political-economic factors (Bergquist, Otten, and Sarich, 2020; Atkinson et al., 2020; Salvatore et al., 2020). For instance, in the United States, the choice to mandate NPIs has been a political one: Most Democratic governors implemented NPIs while Republicans were reluctant to do so (Cui et al., 2021). Likewise, research on the ongoing pandemic indicates how the difficulties of persuading government ministers to make decisions, and the ambiguities and lags in communications between policy makers and health care professionals have shaped the COVID-19 policies (Atkinson et al., 2020). Moreover, because of its enormous economic cost, the NPIs, specifically the imposition of shelter-in-place or lockdown measures, have been disfavored by policy makers as well as groups that stand to lose from them -business owners and workers. As this article demonstrates, in South Asian countries, long-term health policies, and immediate economic and political considerations have been crucial in shaping the responses to the pandemic.
The efforts to contain the pandemic also spurred global cooperation for vaccine research, which resulted in the unprecedented development of a vaccine under one year. The approval of a vaccine in late 2020 led to a global rush to manufacture and administer the doses to a significant section of global population. The manufacturing and distribution of vaccines has raised important questions related to Intellectual Property Rights and the pharmaceutical industry’s prioritization of profits. There is an ongoing debate, and deep concerns about, access to vaccines and gaps in roll-out in low-income and middle-income countries compared with economically developed countries. At the same time, the pace and success of vaccination drives also depend on the state of a country’s health care infrastructure and the ability of national governments to formulate and implement effective policies regarding the pandemic.
This study captures the dynamics of the COVID-19 pandemic in South Asia by tracking major indicators, including the rates of infection and fatalities, the extent of testing, the preparedness to mitigate the disease, and also the pace of vaccination rollouts. Specifically, we capture the dynamics of the COVID-19 pandemic in four South Asian countries by tracking five key indicators. The severity of the disease and its lethal impact are captured by the daily reported cases per million persons and the daily reported deaths per million persons, respectively. Reporting of cases relies on widespread testing. Hence, the extent of the pandemic’s spread can only be truly captured if adequate testing is conducted. We look at this aspect of the pandemic by tracking daily tests per thousand persons and the daily test positive rate. The final indicator that we use refers to the most important intervention to deal with the pandemic in a long run sense: Vaccination. We track vaccination rollout by tracking the number of people fully vaccinated per hundred persons.
Historically, South Asian countries have witnessed many outbreaks of infectious diseases -cholera is one of the most glaring examples of this (Chakrabarti, 2010; Mahapatra et al., 2014). The region includes eight countries -Afghanistan, Bangladesh, Bhutan, India, the Maldives, Nepal, Pakistan, and Sri Lanka. Our study focuses on India and its three neighboring countries -Bangladesh, Pakistan, and Sri Lanka. The three countries of India, Pakistan, and Bangladesh are largest in terms of population. Even though Afghanistan and Nepal have higher populations than Sri Lanka, we chose the latter as the fourth country in our sample because the country has one of the most developed health care systems in the region. Comparing and contrasting these four nations will cover a large section of South Asian population and also allow us to consider variations in health policies and how they have determined the responses to COVID-19.
The rest of this paper is organized as follows: In section 2, we discuss our data sources; in section 3, we discuss trends about the spread of the pandemic; in section 4, we look at health spending and infrastructure; in section 5, we discuss government interventions; finally, we conclude the paper in section 6.
2. DATA SOURCES
We use several data sources for conducting the analysis in this paper. The data on the COVID-19 pandemic are taken from the online resource, Our World in Data (Ritchie et al., 2020). From this online resource, we collect information on reported COVID-19 daily cases per million population, reported COVID-19 daily deaths per million population, daily COVID-19 tests per thousand population, daily positive rate, people vaccinated per hundred and people fully vaccinated per hundred. These are the primary variables we use to track the spread of the pandemic and the response of governments to both estimate the severity of the outbreak and to initiate measures to contain its spread.
We also use data from the World Bank’s World Development Indicators Database to understand health expenditure, health infrastructure and poverty in the four South Asian countries that we study. We supplement this with information on the economic policy response of governments from the International Monetary Fund’s COVID-19 policy tracker. Together, these data give us a picture of the preparedness and the response of different South Asian countries to deal with the pandemic.
3. TRAJECTORY OF THE PANDEMIC
3.1. South Asia in the world
We start with an overview of the progress of the COVID-19 pandemic in the whole of South Asia region, comprising eight countries: Afghanistan, Bangladesh, Bhutan, India, Pakistan, Nepal, Maldives and Sri Lanka. Figure 1 plots the share of reported COVID-19 cases and deaths in South Asia as a percentage of the total number of reported COVID-19 cases and deaths in the world. Figure 1 highlights the two waves in which the COVID-19 pandemic has progressed in South Asia so far.
The first wave started in early April 2020 and peaked by the end of September 2020. Over this period of the rising phase of the first wave, COVID-19 cases in South Asia increased from less than 1% to more than 35% of all COVID-19 cases reported in the world. Over the same period, COVID-19 deaths in South Asia increased from less than 1% to about 24% of the total COVID-19 deaths in the world. The declining phase of the first wave ran from October 2020 to January 2021.
The second surge started in January 2021 and we are still in the rising phase of this much more devastating second wave (though there is some preliminary evidence that the second wave might have peaked by the middle of May 2021). In the second wave, COVID-19 cases in South Asia increased from about 2% of the world total (in early January 2021) to more than 50% of the world’s total cases (by mid-May 2021). By mid-May 2021, South Asia accounted for more than 35% of the world’s COVID-19 deaths.
The horizontal dashed line in Figure 1 gives the share of world population that lives in South Asia (which is 24%). Comparing this horizontal line with the plots of cases and deaths highlights two important facts. First, for most of the duration of the pandemic, South Asia’s case and death load has been lower than its share of the world’s population. Second, at the peak of both the first and second waves, South Asia’s COVID-19 case and death loads have exceeded its share in the world’s population.
3.2. Four South Asian countries: Cases and deaths
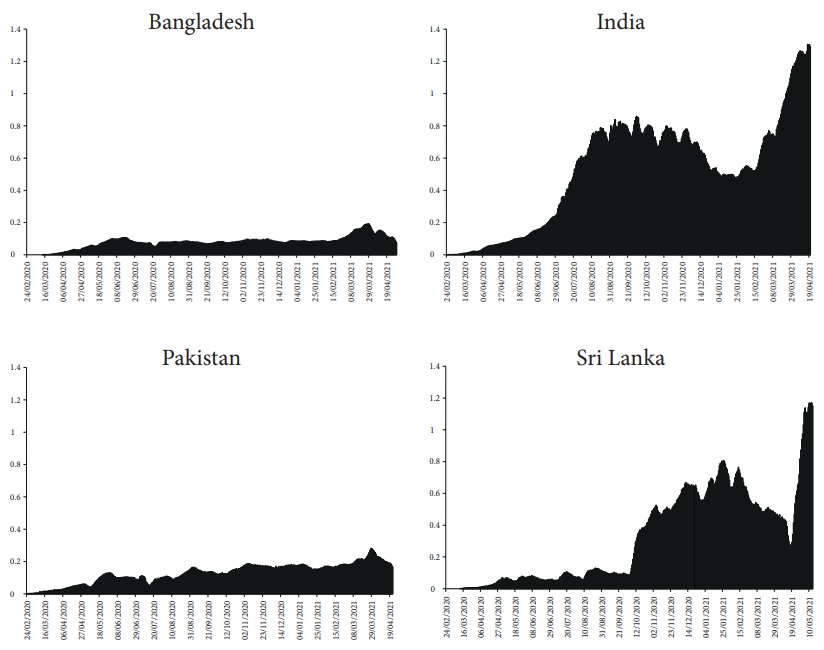
Figure 2 presents the 7-day moving average of the number of daily COVID-19 cases reported per million population in Bangladesh, India, Pakistan and Sri Lanka. From the figure we can see that in each of these countries, the pandemic has progressed in waves.

Note: Data covers the period from 24th February 2020 to 15th May 2021.
Source: Chart created using data from the Our World in Data website: <https://ourworldindata.org/coronavirus>.
Figure 2 Daily reported COVID-19 cases per million population (7-day moving average)
Two waves of the pandemic are most prominently visible in India. The first COVID-19 case was reported in India on 30th January 2020, but the first wave started in earnest only in April 2020. It peaked in late September 2020, and then went downhill until March 2021. A catastrophic second wave hit India in April 2021, exactly one year since the first. While the number of daily reported cases at the peak of the first wave in India was only about 75 per million population, the second wave has reached almost 300 daily reported cases per million population -a four-fold increase.
Sri Lanka shows a similar two-wave pattern. The first case of COVID-19 was reported in this country on 27th January 2020. Number of daily reported cases was relatively low in Sri Lanka for the next eight months. The first wave started in early October 2020, peaked in early-March 2021, and declined for a month before a huge second wave hit the country from early April 2021. Daily reported cases at the peak of the first wave was about 50 per million population; in the second wave, daily reported cases have crossed 100 per million population by the first week of May 2021.
The patterns observed in Bangladesh and Pakistan are similar. Both these countries have witnessed three relatively small waves (compared to India and Sri Lanka). At the peak of its latest wave, which started in early March, the daily reported cases in Bangladesh has been just under 50 per million population. In Pakistan, the peak for the latest wave, which also started in early March, was even lower. More importantly, the latest wave in both these countries is declining, in sharp contrast to the situation in India and Sri Lanka, where the wave has not yet peaked.
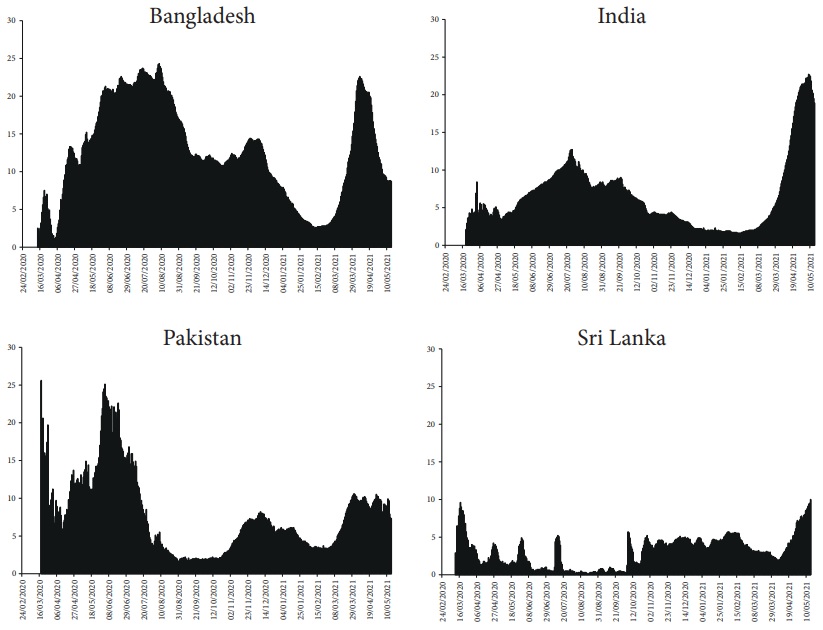
Figure 3 plots the 7-day moving average of daily reported COVID-19 deaths. In this figure, we see the same wavelike pattern that we observed in Figure 2. At the peak of the first wave in India, daily reported deaths were just under 1 person per million population. It has increased three-fold, to about 3 persons per million population, in the second wave. In Sri Lanka, daily deaths at the peak of the first wave was lower than 0.5 persons per million population, but it has come close to 1 person per million population in the second wave. In both Bangladesh, daily deaths during the peak of the first wave was much lower than 0.5 persons per million population; it has crossed above 0.5 persons per million population during the latest, third, wave. In Pakistan, peak daily COVID-19 deaths have crossed 0.5 persons per million population during both the first and the third wave.

Note: Data covers the period from 24th February 2020 to 15th May 2021.
Source: Charts created using data from the Our World in Data website: <https://ourworldindata.org/coronavirus>.
Figure 3 Daily reported COVID-19 deaths per million population (7-day moving average)
From Figures 2 and 3, we can conclude that the severity and fatality of the outbreak is worst in India, with the second wave being nothing short of catastrophic. The next worst outbreak is in Sri Lanka, which is also witnessing a devastating second wave from April 2021. Both Bangladesh and Pakistan seem to have so far weathered the storm better than India and Sri Lanka.
4. HEALTH INFRASTRUCTURE, EXPENDITURE, AND POVERTY
How prepared were these countries to deal with the pandemic? To address this question, we present, in Table 1, data on some indicators of health infrastructure, health expenditure and poverty for the four countries from the World Development Indicators Database of the World Bank.
Table 1 Health and poverty
| Bangladesh | India | Pakistan | Sri Lanka | |
| Population (million) | 161.4 | 1,352.6 | 212.2 | 21.7 |
| Physicians (per 1,000 persons) | 0.5 | 0.8 | 1.0 | 1.0 |
| Hospital beds (per 1,000 population) | 0.8 | 0.7 | 0.6 | 3.6 |
| Current health expenditure (% of GDP) | 2.3 | 3.5 | 2.9 | 3.8 |
| Current health expenditure per capita, PPP (current international $) | 94.3 | 253.3 | 160.6 | 503.6 |
| General government expenditure (% of current health expenditure) | 16.7 | 27.1 | 31.6 | 43 |
| Out-of-pocket expenditure (% of current health expenditure) | 73.9 | 62.4 | 60.2 | 49.8 |
| Poverty headcount ratio at national poverty lines (% of population) | 24.3 | 21.9 | 24.3 | 4.1 |
| GDP per capita, PPP (constant 2011 international $) | 3,879.2 | 6,888.2 | 4,939.8 | 11,955.5 |
| Military expenditure (% of GDP) | 1.3 | 2.4 | 4.0 | 1.9 |
Source: World Development Indicators Database of the World Bank. Numbers are for the latest year for which data were available.
Let us start by looking at two measures of health infrastructure: Physicians and hospital beds. Physicians per 1,000 persons is lowest in Bangladesh at 0.5. It is followed by India at 0.8 physicians per 1,000 persons. Pakistan and Sri Lanka both have a higher Figure: 1 physician per 1,000 persons. Hospital beds per 1,000 persons is lowest in Pakistan, at 0.6, followed by India, at 0.7, and then Bangladesh, at 0.8. With 3.6 hospital beds per 1,000 persons, Sri Lanka has more than 5 times the number for the other three countries.
Next, let us look at two measures of health expenditure: As a share of Gross Domestic Product (GDP) and in per capita terms. Current health expenditure as a share of GDP is close among the countries -with Bangladesh having the lowest, at 2.3%, and Sri Lanka having the highest, at 3.8%. But these countries are very different in terms of population and GDP. Hence, a better way to compare healthcare expenditure is to look at per capita figures. Current healthcare expenditure per capita in purchasing power parity (PPP) terms, and measured in current international dollars, varies widely across the four countries. Bangladesh has the lowest health expenditure, at $94.3 per person, followed by Pakistan, at $160.6 per person, and India, at $253.3 per person. With $ 503.6 per person, Sri Lanka is way ahead of the other three countries in health expenditure.
The picture of health expenditure is incomplete unless we also ask the following question: What fraction of current health expenditure comes from the government (or, relatedly, what is the share of out-of-pocket expenditure on health)? The pattern here is largely consistent with per capita healthcare expenditure. Bangladesh, which has the lowest per capita health expenditure, also has the lowest share contributed by the government (16.7%); Sri Lanka, with the highest per capita health expenditure, also has the government contributing the most (43%). India and Pakistan fall between these two ends with government, with 27% and 32% contributed by the government, respectively. The figures for out-of-pocket expenditure on health are the mirror images of the government share of health expenditure: Countries with higher government share have lower out-of-pocket expenditure on health.
The final set of indicators displayed in Table 1 refers to the average income and poverty. Per capita GDP is a measure of the average level income in a country. It provides an indicator of the average material standard of living of the population. Countries with higher per capita GDP are generally better off and can deal with health crises like the COVID-19 pandemic in a better way. From Table 1, we see that per capita GDP is lowest in Bangladesh, and highest in Sri Lanka. Pakistan and India fall in between, with India having a higher average income than Pakistan. Thus, in terms of average standard of living, Sri Lanka was the best and Bangladesh the worst prepared to deal with the pandemic.
Poverty is measured by the head count ratio, which is defined as the proportion of persons who fall below the national poverty line. This is a very rough and imperfect measure of the proportion of people who are most vulnerable in economic terms, and who would be most in need of help to cushion any negative income shock due to the pandemic. In terms of poverty headcount ratios, there is very little difference between Bangladesh (24.3% of population), India (21.9% of population) and Pakistan (24.3% of population) -though India’s number is a little lower than the other two countries. The poverty headcount ratio in Sri Lanka, at 4.1% of the population, is about 5 times lower than the other three countries.
5. GOVERNMENT RESPONSE
Governments responded to the pandemic with interventions in several directions. The first and immediate response was to start testing for COVID-19 cases across different cities, states and regions. This was essential to get an accurate picture of the spread of the pandemic in the country and also isolate infected patients and provide them medical care.
As the pandemic progressed and impacted the population of countries, governments also responded with two sets of policies to contain the spread of the pandemic and to reduce the adverse economic impact on the population. The first related to various non-pharmaceutical interventions like encouraging measures for physical distancing in society, which could reduce the speed of transmission of the virus. The second set of policies related to expenditures that were necessary to deal with the health and economic impacts of the pandemic.
Using information from the Johns Hopkins University coronavirus dashboard and the International Monetary Fund’s COVID-19 country-level policy tracker, we have summarized basic information about government responses in Table 2, and will now discuss each component in detail.
Table 2 Response to COVID-19
| Bangladesh | India | Pakistan | Sri Lanka | |
| First case reported | 8 March | 30 January | 26 February | 27 January |
| 50 or more cases first reported | 31 March | 10 March | 16 March | 19 March |
| Schools, colleges, etc. closed | 15 March | 16 March | 13 March | 13 March |
| National lockdown started | 26 March | 24 March | Varies by region | 20 March |
| Total tests per 1,000 persons on May 1, 2020 | 0.426 | 0.654 | 0.825 | 25.21 |
| COVID-19 health expenditure (% of GDP) | 0.01 | 0.10 | 0.07 | 0.10 |
| COVID-19 economic stimulus (% of GDP) | 0.34 | 0.8 | 3.34 | 0.10 |
Source: Johns Hopkins University coronavirus dashboard (https://coronavirus.jhu.edu/map.html); International Monetary Fund’s COVID-19 policy tracker (https://www.imf.org/en/Topics/imf-and-covid19/Policy-Responses-to-COVID-19).
The final piece of government intervention related to COVID-19 vaccination. It is widely understood by public health experts and epidemiologists that the only sustainable way to deal with the pandemic is to vaccinate a large section of each country’s population. This effort picked up from the early part of 2021 and we track the progress of vaccination in the four South Asian countries in this section.
5.1. COVID-19 testing
Part of the difference in the number of cases reported across the four countries can be attributed to differences in the adequacy, or otherwise, of testing. Without adequate number of tests, a country with a severe outbreak would not report the true scale of the epidemic. We look at two indicators of the adequacy of COVId-19 testing across these four countries (see Figure 4).
Note: Data covers the period from 24th February 2020 to 15th May 2021.
Source: Charts created using data from the Our World in Data website: <https://ourworldindata.org/coronavirus>.
Figure 4 Daily tests per thousand population (7-day moving average)
By late-August 2020, India was conducting more than 0.5 daily tests per thousand population; Sri Lanka reached this level of testing by about November 2020. Both India and Sri Lanka witnessed a gradual decline in daily testing rates in the early part of 2021. As the second wave progresses, testing has been ramped up again in both countries.
Bangladesh and Pakistan have been conducting far fewer tests than India and Sri Lanka. In Pakistan, daily tests have slowly increased to reach about 0.25 tests per thousand population by early April 2021. Bangladesh has the lowest level of testing among the four countries, not even reaching 0.25 tests per thousand population.
While tests per thousand population gives a first indication of the level of testing, it does not normalize by the severity of the outbreak. Hence, we look at a second measure, the test positive rate. This is the ratio of positives that are reported per 100 tests conducted. The World Health Organization (WHO) recommends a benchmark figure of 5% test positive rate as an indication of adequate testing. When the test positive rate is higher, it shows that testing is low given the severity of the outbreak.
In Figure 5, we plot the 7-day moving average of the test positive rate in the four countries. From the figure, we get corroboration of the general pattern we saw in Figure 3 but with some important differences. In general, testing has been least adequate in Bangladesh, where the test positive rate has mostly been above 10%, other than a few months in the early part of 2021. In Pakistan, testing was generally inadequate during the early phase of the pandemic. By September 2020, the test positive rate in Pakistan had fallen to below 5%, giving indication of adequate testing once the severity of the outbreak is considered. Since late February 2021, the test positive rate has been rising in Pakistan. In general, India has performed better than Bangladesh and Pakistan, in terms of testing. But the picture is very different for the second wave in India since late March. The test positive rate has increased rapidly since early April and is now over 20%. This provides evidence that testing is inadequate given the severity of the outbreak in the second wave in India. In general, Sri Lanka has performed the best in terms of testing. Even during the current, second wave, the test positive rate in Sri Lanka has stayed below 10%, giving indication of adequate testing.
Note: Data covers the period from 24th February 2020 to 15th May 2021.
Source: Charts created using data from the Our World in Data website: <https://ourworldindata.org/coronavirus>.
Figure 5 Daily test positive rate, i.e. positive cases per 100 tests (7-day moving average)
5.2. Non-Pharmaceutical interventions
5.2.1. Bangladesh
In response to the emergence of the virus, the government reduced international flights and imposed thermal scanner checking of international travelers and sailors of freight ships. By March 15, 2020, the government imposed a 14-day obligatory quarantine for all travelers entering the country. However, travel restrictions and quarantine programs were only partially effective at this point. The lack of adequate quarantine facilities, for instance, resulted in the unrestricted movement of returning expatriates and travelers. Other crucial non-therapeutic measures of social distancing and sheltering-in have been patchy. Schools were shut down by March 15 but a broader lockdown was imposed only on March 26. The lockdown was gradually lifted from May 31, 2020. Daily infections and deaths were on a decline since end-November 2020. But this declining trend was rapidly reversed from early March 2021. The government responded by imposing a national lockdown from April 14, 2021 to May 16, 2021. Following the start of the lockdown, cases have started declining (as can be seen in Figure 2).
5.2.2. India
Although its first positive case emerged by January 30, India started preventive measures only in early March. The COV-IND-19 Study Group’s March 23-rd report has a dated list of initiatives taken by the Indian government. Drawing on this list we see the following sequence of important policy interventions.
On 3-rd March, India banned travelers from China, Iran, Italy and South Korea. On 11-th March, it suspended visas granted to nationals of France, Germany, and Spain. On 16-th March, the Central government proposed social distancing measures and recommended closure of educational institutions. On 22-nd March, India observed a day of self-imposed ‘janata curfew,’ (peoples’ curfew) and on March 24-th, the Prime Minister announced that the country would go under total lockdown for a period of 21 days within four hours! Lockdown on such a short notice generated panic among citizens who ignored all principles of social distancing and rushed to crowded stores to stock up essentials.
Starting on April 15, 2020, the Indian government started gradually relaxing the lockdown in a phased manner. The relaxation of lockdown guidelines went through 5 phases and by October 15, 2020, life was more or less back to normal. Leaders in the ruling political party, the Bharatiya Janata Party (BJP), and functionaries of Central and State government started disseminating the message that India has overcome the pandemic. Large public gatherings for religious festivals (e.g. the Hindu festival known as the Kumbh Mela) and political rallies for state-level elections were allowed. Naturally then, the country was caught completely unawares when a devastating second wave hit in late-March 2021. Leading public health experts have criticized the complacency of the Central government in this regard (Bhuyan, 2021).
5.2.3. Pakistan
The health ministry of Pakistan introduced screening measures at its major airports by the end of January. But social distancing advisory and caution against public gatherings were issued only by mid-March. From the outset, preventive measures lacked uniformity and there have been divisions within the government about the strategies to contain the pandemic. Although schools and colleges were shut from March 13, 2020, the Prime Minister, Imran Khan, has consistently argued against a nationwide lockdown, citing its adverse effects on wage earners and the economy in general. Consequently, varying levels of shutdowns have been imposed in different provinces and cities. Apparently, this ambiguity in shutdown policy has sent confusing messages, leading to frequent violations of physical distancing measures.
As we have seen above (see Figure 2), the pandemic has progressed in three waves in Pakistan. While the federal and state governments adopted varying containment measures, including travel restrictions, school closures, and partial lockdowns, during the first two waves, there does not seem to be a vigorous response to the third wave (which started in mid-March 2021). This is especially worrisome because the death rate is higher in this third wave (see Figure 3).
5.2.4. Sri Lanka
Relative to the other three countries, the government in Sri Lanka acted swiftly to contain the spread of the contagion in 2020. The government of Sri Lanka issued a preliminary social distancing advisory on January 20, a week before the first COVID-19 case of a Chinese tourist in Sri Lanka was confirmed. On the same day, screening of international travelers began in earnest. From early March, incoming travelers from Italy, Iran, and South Korea were required to be quarantined for two weeks in government facilities created for the purpose. The country suspended on-arrival visas for tourists on 11th March, 2020. Schools and universities were declared closed on 13 March and from 16 March onwards, people were asked to work from home. In addition, the government announced an all-island curfew on March 20, 2020, and everyone, except those working in the essential services, were required to stay home. Retailers were instructed to deliver essential goods to the homes of the people. These services were further streamlined by the creation of a special task force to distribute essential items.
The Sri Lanka government’s measures at containment of the pandemic worked well until late-September 2020. But since early October 2020, there was rapid rise in cases and deaths in the country (see Figures 2 and 3). To the best of our knowledge, the government did not strengthen its containment measures significantly to deal with the second wave. Unfortunately, a third, and more dangerous wave hit the country in April 2021 and is continuing to ravage the population.
5.3. COVID-19 vaccination
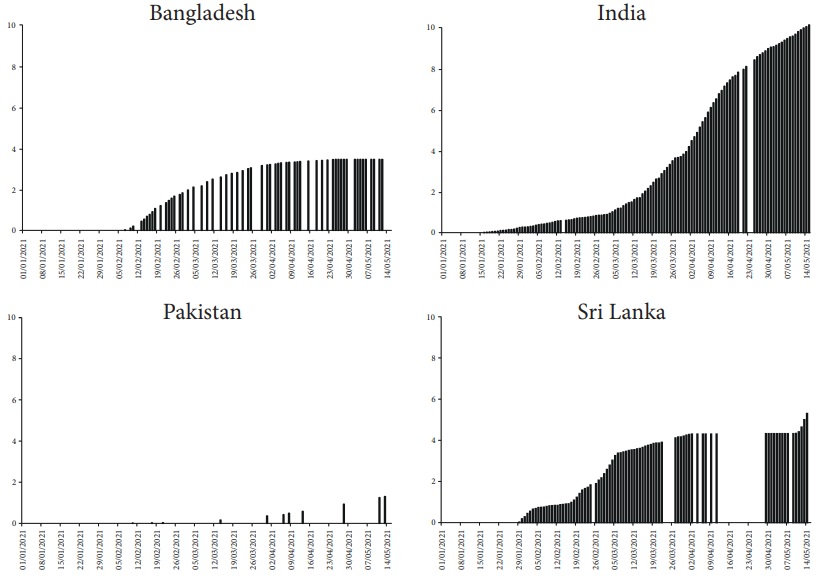
One of the pillars of the long-term strategy to deal with the pandemic is vaccination. Hence, the final metric we track is the speed of vaccination rollout. Figure 6 plots the number of persons vaccinated per hundred population, and Figure 7 plots the number of persons fully vaccinated per hundred population. Here we see a disappointing picture.
Note: Data covers the period from 24th February 2020 to 15th May 2021.
Source: Charts created using data from the Our World in Data website: <https://ourworldindata.org/coronavirus>.
Figure 6 People vaccinated per hundred population

Note: Data covers the period from 24th February 2020 to 15th May 2021.
Source: Charts created using data from the Our World in Data website: <https://ourworldindata.org/coronavirus>.
Figure 7 People fully vaccinated per hundred population
Pakistan has the slowest COVID-19 vaccination rollout. While vaccination efforts started in mid-February 2021, it has only managed to vaccinate about 1.2% and fully vaccinate almost 0% of its population (Figure 6). Sri Lanka kicked off vaccination in early February 2021 and had managed to vaccinate about 4% of its population by early April. Since then, the pace of vaccination has slowed down significantly (Figure 6). Sri Lanka saw completion of vaccination dosage in a serious way only in late April and by mid-May, it has managed to fully vaccinate only 1% of its population (Figure 6). Bangladesh started its vaccination campaign in mid-February and the pace of vaccination has slowed down significantly since early April (Figure 6). By mid-May, Bangladesh had managed to fully vaccinate a little over 2% of its population. Among these four countries India started COVID-19 vaccination earliest, in mid-January, and by mid-May had vaccinated close to 10% of its population (Figure 6) and had fully vaccinated about 3% of its population (Figure 7).
As noted earlier, the ability of a country to vaccinate its people depend on a range of political, economic, and social factors. The pace of vaccination in South Asia highlights a scarcity of supply as major vaccine producing countries have kept most doses for themselves. The three countries -Bangladesh, Pakistan, and Sri Lanka- lack the necessary know-how, raw material, and the infrastructure to ramp up their production of vaccines (Rowland, Rauhala, and Berger, 2021). Consequently, their vaccination plans rely on supplies from other large producers such as China, Russia, and India. However, after the disastrous second wave, India is struggling to procure vaccines for its own citizens -which has adversely hit supplies to other countries in the world, including Bangladesh and Sri Lanka.
India is different in this respect from other South Asian countries because it has a well-developed vaccine production capacity. In January 2021, the Drug Controller General of India authorized the use two vaccines. The first, called Covishield, was developed by Oxford University and AstraZeneca, and is being produced locally by the Serum Institute of India. The second one is a locally developed vaccine called Covaxin. A leading global manufacturer of vaccines, India was expected to roll out these vaccines not just for its own usage but also for other countries in Asia and Africa. By April 2021, India had exported millions of doses to other countries. However, the government’s inability to estimate vaccine needs and place order in advance has resulted in a severe supply crisis in the country. This shortage of shots has become even more acute after the onset of the deadly second surge in March 2021 in India. The subsequent ban on vaccine exports threatens to delay the global vaccination drive, including in countries such as Bangladesh and Sri Lanka, which are scrambling to find alternate sources of vaccine imports (Yasir, Bengali, and Gladstone, 2021; Burke, Wintour, and Ratcliffe, 2021).
Although the sluggishness of vaccine procurement and delays in effective distribution are the biggest determinants of vaccine rollouts, misinformation and hesitancy have also had negative effects on vaccination in these countries. For instance, rumors of potential side effects and suspicions about vaccine efficacy have kept away people from taking vaccines in Pakistan (Dagia, 2021). A nationally representative, cross-sectional survey in Bangladesh has revealed that more than 32% of the respondents suspected the effectiveness and safety of the vaccine (Ali and Hossain, 2021). According to reports, in India, the fears of losing a day’s work to get the shot and possible side effects that may force them to take days off work that they simply cannot afford, are keeping daily wagers away from vaccines (Cohen, 2021). Apparently, vaccine hesitancy is low in Sri Lanka. However, a recent survey-based study reveals that most respondents are concerned about the possible side effects, allergies, and protection duration (Wijesinghe et al., 2021). Suspicion of the new vaccines are also rooted in misinformation regarding the seriousness of coronavirus disease itself. For instance, in India, the unscientific approach of public figures to COVID-19 has created rumors and misinformation about the disease and its remedies (Express Web Desk, 2021). Unfortunately, systematic awareness campaigns that will disseminate scientific information and reassure people of side effects are lacking in these countries.
6. CONCLUSION
In this paper, we have studied the progression of and responses to the COVID-19 pandemic in four South Asian countries: Bangladesh, India, Pakistan and Sri Lanka.
Our analysis shows that in terms of preparedness, Sri Lanka was clearly the best placed. It was not only the richest country among the four studied in this article, but also had the largest expenditure on health -with the greatest share contributed by the government. Bangladesh was at the most disadvantaged position -not only because it was the poorest, but also because of the low contribution of the government to an already low total health expenditure. India and Pakistan fell in between these two extremes.
Our study also highlights how policy priorities of countries come to the fore during a health crisis like a pandemic. Countries which have invested, or continue to invest, more in building health infrastructure and capacities, would naturally be better able to shield its citizens from the negative impact of the pandemic. One way to gauge this policy slant is to compare health and military expenditure (last row of Table 1). From the data in Table 1, we see that the policy priorities are most skewed in Pakistan, where military expenditure is twice that of health expenditure. At the other extreme is Sri Lanka, where health expenditure is twice that of military expenditure. Bangladesh and India fall in between, with India having a more favorable expenditure share towards health than Bangladesh.
The impact of the pandemic is of course going to depend on a complex set of factors, which includes but it not limited to health expenditure and health infrastructure. One simple way to quantify the negative impact of the pandemic is to look at the total number of COVID-19 deaths per million population. On May 15th, 2021, total (cumulative) reported COVID-19 deaths per million population in Bangladesh, India, Pakistan and Sri Lanka were 73.62, 195.86, 88.47 and 43.95, respectively.
Thus, while Sri Lanka has clearly been best able to minimize the adverse impact of the pandemic on lives lost, due in no small measure to its superior health infrastructure (see section 3), India has performed the worst among the four South Asian countries we have studied, despite having better infrastructure than Bangladesh and Pakistan. The fact that India is currently governed at the federal level by a Hindu nationalist, right-wing political party, whose leaders have routinely minimized the role of scientific analysis and evidence in dealing with the pandemic, must surely have contributed to the relative outcomes we see.

