


 nueva página del texto (beta)
 Inglés (pdf)
 Artículo en XML
 Referencias del artículo
 Enviar artículo por email
 Citado por SciELO
  Similares en
SciELO
Similares en
SciELO 
 Permalink
1. INTRODUCTION
Public health outcomes during the first wave of infection in Europe varied remarkably. Germany and the UK stand out in particular, as England and Wales officially had to mourn over 46,000 deaths (out of 59 million inhabitants) compared to Germany’s 9,000 deaths (out of 83 million inhabitants). An analysis based on excess mortality suggests that the official figure may even underestimate the total number of British COVID-related casualties, since excess mortality (in this case defined as the difference between total deaths in 2020 and the average of the last five years) is higher from mid-March, when the official deaths start to rise sharply (Office of National Statistics, ONS, 2020).
But is the more than sevenfold British death toll a result of smarter German containment policy, or can it be traced back to other characteristics which are specific to the UK? If the difference can be traced back to policy, what are the German policies that proved to be particularly beneficial? Getting the answers to these questions right in the mid of a pandemic is not just a question of scholarly interest, but a matter of life and death.
In order to shed light on these research questions, I use the economic-epidemiological agent-based model COVID-Town (Mellacher, 2020). This model simulates the spread of the virus in an artificial economy consisting of thousands of heterogeneous agents and is informed by a large variety of German legal and statistical data. This model is able to simulate containment strategies in a detailed way and allows to study economic, public health, and -to a limited degree- social consequences of the spread of the virus and the containment measures.
This paper contributes to the literature using agent-based models to study economic-epidemiological outcomes in the COVID-19 pandemic (Basurto et al., 2021; Delli Gatti and Reissl, 2020; Dignum et al., 2020; Kano et al., 2020; Mellacher, 2020; Silva et al., 2020; Vermeulen, Pyka, and Müller, 2020), which is part of a larger stream of literature using agent-based models to study the pandemic (e.g.Aleta et al., 2020; Bicher et al., 2020; Inoue and Todo, 2020; Poledna et al., 2020; Sharma et al., 2021; Wallentin, Kaziyeva, and Reibersdorfer-Adelsberger, 2020) that overlaps significantly with the literature on the effects of non-pharmaceutical interventions on the evolution of the pandemic and the economy, which also encompasses other theoretical research, such as based on the SIR framework or different simulation-based frameworks (e.g.Balmford et al., 2020; Flaxman et al., 2020; Reissl et al., 2021), as well as empirical research (e.g.Haug et al., 2020; Huber and Langen, 2020).
In terms of the research question, my study is most closely related to the one by Balmford et al. (2020) who use a highly simplified economic-epidemiological simulation model to compare public health outcomes inter alia in Germany and the UK. My approach differs from this study by using a more complex model that allows for a) variations in containment policy (instead of a yes/no decision about the lockdown), b) endogenous determination of economic costs of the lockdown (instead of assuming fixed costs per day). Both features are important in order to find a) especially cost-effective containment policies and b) because the spread of the virus may be more damaging than containment measures, as e.g. evidence from the Spanish flu suggests (Correia, Luck, and Verner, 2020).
The rest of this paper is structured as follows: The next section discusses the advantages (and disadvantages) of using an agent-based modelling approach to this research question. The third section gives an overview of the model, which is described in detail by Mellacher (2020). The fourth section describes the differences in model calibration to the baseline model. The fifth section presents the model validation, as well as the results of counterfactual policy analysis. Finally, section six concludes.
2. METHOD: WHY AGENT-BASED MODELLING?
Epidemiological modeling rose to prominence during the COVID-19 pandemic, especially during the first wave. Most models rely on the SIR framework initially developed by Kermack and McKendrick (1927). SIR-type models are especially popular among economists (e.g.Acemoglu et al., 2020; Álvarez, Argente, and Lippi, 2020; Bethune and Korinek, 2020).
In these models, the population is split into separate compartments -in the easiest case susceptible (S), infected (I) and recovered, which is sometimes also labeled removed, (R). The evolution of the size of these compartments is described by differential equations producing the by now well-known patterns, such as an inverted U-curve for the number of infected and an S-shaped relationship for the recovered. Naturally, this type of model can be extended to incorporate other compartments like exposed (E), capturing agents who carry the virus, but are not symptomatic (yet), or dead (D) [e.g., Piguillem and Shi, 2020].
While SIR models benefit from their parsimony and are easy to set up, they are only capable of incorporating a limited level of agent heterogeneity and crucially depend on the assumption of homogenous mixing (at least between group i and j, where i may be equal to j), i.e., the interactions cannot be empirically micro-founded in the interactions within the household, among friends and colleagues. Furthermore, SIR models are not well-equipped to explicitly model most containment policies. For instance, in order to investigate the effect of school closures on the evolution of the pandemic, a typical SIR model would assume a certain contact reduction (e.g., Imperial College, 2020). Even though it would theoretically be possible to explicitly add students and possibly teachers as separate types of agents, doing so is expensive in terms of modelling efforts, as each type of agent requires at least two new compartments (susceptible and infected), and the laws of motion for each existing and new compartment have to be modified or defined accordingly. Thus, agent heterogeneity in SIR models is severely limited.
Agent-based models (ABMS) are the main alternative put forward to address these limitations of SIR models. These models have been fruitfully employed to study the evolution of the pandemic in epidemiological models (e.g.Aleta et al., 2020; Bicher et al., 2020; Vermeulen, Pyka, and Müller, 2020; Wallentin, Kaziyeva, and Reibersdorfer-Adelsberger, 2020), the economic fallout in economic models (Inoue and Todo, 2020; Poledna et al., 2020; Sharma et al., 2021), as well as in integrating economic and epidemiological models to evaluate policy scenarios from both an economic and an epidemiological point of view (Basurto et al., 2021; Delli Gatti and Reissl, 2020; Dignum et al., 2020; Kano et al., 2020; Mellacher, 2020; Silva et al., 2020).
Turning back to the example of school closures: Instead of assuming a certain decrease in social contacts, an agent-based model is able to explicitly model school closures, in which case neither students nor teachers go to schools anymore and thus cannot meet there. Since young children cannot stay home alone, one of their parents has to stay at home with them and will work or -if this is impossible- abstain from working. In an ABM, the contact reduction from a given policy can thus emerge from the interactions between the agents and does not have to be uniform across the population, as students experience a stark decline of their social contacts, but the mixing patterns of pensioners, who are typically most vulnerable to COVID-19, will not be affected a lot by this school closures. This mechanism is actually implemented in the COVID-Town agent-based model used in this paper. Further deepening our analysis, however, one can find pensioners who in fact may be affected a lot by school closures, namely those living in an intergenerational household together with school students. This mechanism exists in COVID-Town as well. Agent-based models thus make an important step towards addressing the complexities of social and economic processes by setting up complex virtual worlds which can be subjected to experiments to explore their consequences in one or more dimension(s). While COVID-Town pays special attention to modelling epidemiological dynamics in a detailed, empirically micro-founded way, the models by Delli Gatti and Reissl (2020) and Basurto et al. (2021) put more emphasis on modelling the economy in a complex way.
The main drawbacks of using an agent-based model are given by the need to a) build and verify a complex model, b) calibrate a large number of parameters and c) analyze the model via the means of Monte Carlo simulations, which are computationally expensive. Thus, agent-based analysis is time-consuming, and it took the scientific community much longer to develop integrated economic-epidemiological agent-based models than their counterparts which are based on the SIR framework.
3. MODEL
This section is intended to merely give an overview of the COVID-Town model used in this research. A detailed description would go beyond the scope of this paper but is given by Mellacher (2020) including all behavioral rules, equations, and the parameters, as well as their calibration.
COVID-Town is a computer simulation model centered around an artificial town populated by numerous human agents such as children, pensioners, various types of workers and firm owners, as well as non-human agents such as firms. This artificial town is then subjected to a) the introduction of a virus and b) various policy scenarios describing the epidemiological response of the government and partly also the response of the agents to the virus, as well as fiscal policy.
The baseline calibration used in this paper involves 82,000 human agents living in 41,000 households, working in thousands of firms, and visiting tens of thousands of locations such as households, firms, and non-commercial leisure facilities. This artificial economy is built inter alia using German statistical and legal data on demography, household composition, firm demography, employment, unemployment, time use, company profits, taxes, wage rates and replacement rates, schools, and hospital capacities.
First and foremost, COVID-Town is an economic-epidemiological model intended to evaluate the economic as well as public health impact of COVID-19, even though the model also allows to evaluate the social impact of the crisis in a limited way, namely especially the ability of the agents to fulfill their leisure plans. Three interconnected sub-models are at the heart of COVID-Town: An activity model, an epidemiological (and medical) model, and an economic model.
3.1. Activity model
COVID-Town is a discrete-time model, in which each week is split into seven days ranging from Monday until Sunday, and each day is split into three phases (morning -evening- night). Each human agent spends one of these phases at home to rest, which is typically the night phase1.
On each workday, one phase is devoted to going to work. Most workers work during the morning phase of Monday until Friday. Service workers (who work at commercial leisure facilities) and health care workers (who work at hospitals) are exceptions to this rule. They work in shifts to keep leisure facilities and hospitals staffed during each day including Saturday and Sunday. While hospitals are active during every shift, commercial leisure facilities are only open during morning and evening phases.
Finally, each phase which is not dedicated to work or rest is a leisure phase. During leisure time, agents decide via a boundedly rational stochastic process, how they want to spend their phase: They either want to stay at home, meet a friend, go to a non-commercial leisure facility (representing, e.g., parks) or a commercial leisure facility (representing, e.g., restaurants).
Needless to say, not every plan will work out. If an agent wants to meet a friend, but this wish is not reciprocal, the plan will fail. Leisure plans will also fail if e.g. agents lack the money to go to a commercial leisure facility, the agent or its friend is isolated, the location is under quarantine, etc.
The preferences of each agent are drawn from a random distribution, where the mean is given by age-dependent data from the German time use study. The number of friends is also drawn from a random distribution, where the mean is given from survey data. Thus, some agents do not have many friends and like to stay at home, whereas others are extroverted and potential “superspreaders”. On average, however, they represent the empirical characteristics of their age group. Thus, the activity model is empirically micro-founded.
3.2. Epidemiological model
During each of the phases described in the previous subsection, agents move to explicitly modeled locations, where they meet other agents and may become infected. Each infectious agent can meet up to a certain number of agents per phase, which can be altered in policy scenarios to reflect the fact that people who are aware of the virus typically try to keep their distance. At home they meet their family or cohabitors, at work their colleagues or customers and during leisure time their friends or other agents who happen to be at the same place coincidentally (e.g. cohabitors of a friend that they are meeting at their friend’s house or strangers who happen to go to the same restaurant).
The progression of the disease is modeled as in a state-of-the-art sir-type model (Imperial College, 2020). After an agent is infected, it becomes exposed, i.e., it does not show any symptoms and is -initially- non-infectious. Later on, it becomes first infectious, and then moves out of the exposed category to either become infected with mild symptoms (including a certain fraction of permanently asymptomatic individuals) or become a subsequent hospital case. Hospital cases are either severe (who require a standard hospital bed) or critical (requiring first an intensive care unit and then -if the treatment is successful- a standard hospital bed during their recovery phase). All critical and a majority of severe cases die, if they do not receive the treatment that they need because the capacities are exhausted.
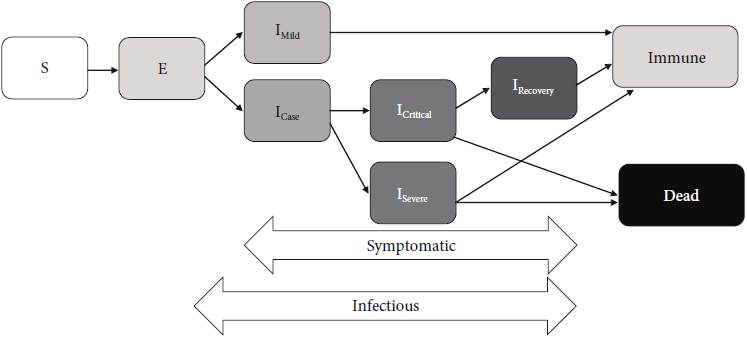
The probability to become a critical or severe case or die is age-dependent and based on empirical data.
3.3. Economic model
In the economic model, eight types of agents receive income, pay taxes, and spend their funds at two different markets. Sources of income are wages, profits, subsidies (unemployment benefits, family benefits, sickness benefits, quarantine benefits). Schools and hospitals are operated and paid for by the government. Factories and offices are private enterprises owned by firm owners. The types of agents and their economic relations are depicted in Figure 2.
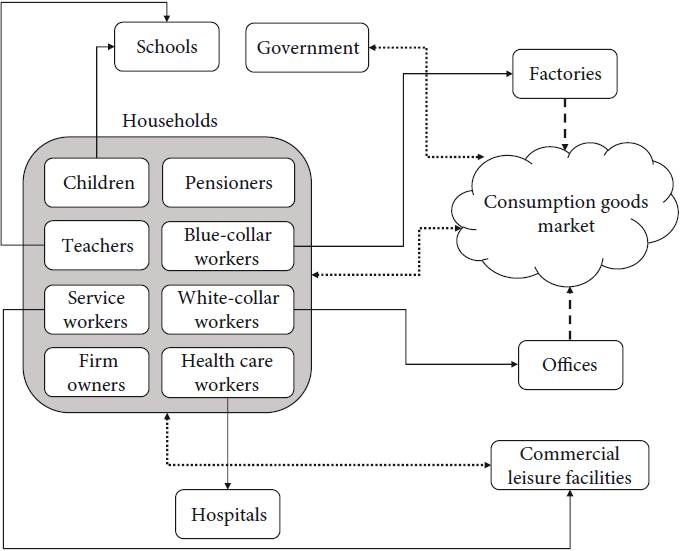
Source: Mellacher (2020).
Figure 2 Overviewof the economy. Solid lines represent work, dashed lines production, dotted lines consumption relations
The consumption goods market in this first version of COVID-Town is highly simplified and aggregated. Factories (using blue-collar workers) and offices (using white-collar workers) produce consumption goods. Human agents plan to spend their average weekly income over the course of a week, where a fraction is dedicated to expenses at the leisure market. This fraction is age-specific in order to ensure that each age group is able to carry out its empirically observed leisure behavior. Both consumption and production happen on each day from Monday until Friday and the market is always cleared.
The leisure market, on the other hand, behaves completely differently, as the interactions on this market are disaggregated, firms are heterogeneous, and a state of disequilibrium is the exception rather than the rule. Agents visit and spend money at commercial leisure facilities during their leisure time as described in the activity model. On a weekly basis, commercial leisure facilities adapt their prices based on their utilization in the past week (i.e., the number of visitors divided by a maximum capacity). Leisure facilities are heterogeneous with regard to their attractivity, which in turn co-determines the leisure preferences of the human agents (together with individual tastes). Thus, even if the simulation is initialized with an equal number of employees per leisure facility, a pattern in which some facilities attract a lot of customers and employ a lot of workers emerges endogenously.
Like the consumption goods market, the labor market is also highly simplified. On a weekly basis, all firms (factories, offices, and commercial leisure facilities) decide on their labor force by comparing their average rate of profit with a target rate of profit. If the former exceeds (falls behind) the latter by a certain threshold, the firm will hire (fire) one worker. Unemployed workers always accept job offers. The target rate of profit is calibrated with the empirical counterpart in order to ensure that the artificial economy hovers around the empirical economy in the medium run in absence of any virus or containment efforts.
3.4. Calibration
The baseline calibration of the model with empirical data is described in detail in Mellacher (2020), but that paper only includes a calibration to the first German wave of the pandemic and only the lockdown, but not the “opening up” phase. Since the first British wave was considerably longer and possibly started at a different period of time than the German wave, I adapt the calibration for the present research question. In order to do so, three steps have to be taken:
Calibrate the model to a German scenario which follows the evolution of the pandemic in Germany until June 2020. This especially requires to modelling a plausible evolution of the infection detection rate.
Make the British and the German infection timeline comparable, as the infection can be assumed to have spread differently even before the introduction of strict lockdown measures.
Set up (a stylized version of) the British policy scenario against COVID-19 until June 2020 including testing policies, i.e., with corresponding infection detection rates that relate to the test positivity rate in the two countries.
3.5. Infection detection rate
A key parameter in any epidemiological model that involves the isolation of detected infected, but does not model testing explicitly, is the infection detection rate, i.e., the probability of detecting one infected individual. This detection rate is set to be constant in Mellacher (2020), which is a useful simplification for the short time horizon covered in that paper. If we assume, however, that testing is somehow targeted at people showing symptoms or identified contacts of infected individuals, the detection rate cannot be independent of the number of infected. This means that a successful lockdown both reduces the number of infections and increases the detection rate (thus further reducing the number of new infections via isolation and contact tracing). This effect is furthermore increased by the fact that governments massively expanded their testing capacities. In order to approximate the infection detection rate, one may thus look at the number of tests per capita and the test positivity rate, i.e., the fraction of tests which came back positive.
Up until 23rd of April 2020, Germany conducted 629,085 tests on 537,155 people (Robert Koch Institute, RKI, 2020). In calendar week 11, i.e., the start of the simulation, Germany conducted 127,457 tests. No information about the number of people tested in Germany is available for this period. If we assume, however, that the same relation between the number of tests and the number of people tested as in mid-April holds, we can estimate the number of people tested to be approximately 108,000.
In the UK, testing data is available on a weekly basis, but these weeks range from Thursday until Wednesday (in contrast to the week from Monday until Sunday covered in the German data). In the two weeks encompassing the 11th calendar week, on average 18,000 people were tested per week in England (UK Government, 2020a). If we account for the difference in population size, this amounts to about 27,000 people tested in Germany. If we assume a direct relationship between the number of people tested and the detection rate and take the detection rate as estimated in Mellacher (2020) as given, this corresponds to a detection rate of 8.2% in the beginning of the simulation.
British (as well as German) testing capacity was increased drastically, however. If a) the number of tests increases more than the true number of infected, and b) tests are directed equally well towards actually infected (or at least not much worse), the detection rate goes up. A strong indication for a) is given in the daily positive rate, i.e., the share of COVID-19 tests which are positive as given by Roser et al. (2020), which is about 30% at the beginning of April, 10% at the end of April and 2% at the end of May. In Germany, the positive rate plateaued at about 10% in the beginning of April, 3% at the end of April and under 1% at the end of May.
If we translate this data into detection rates and take the detection rate of 1/3 for the whole first wave (until the end of April) as estimated by Mellacher (2020) and the average German positivity rate of 6.3% in this period as given, the average positivity rate of 1.5% (Germany) and 4.2% (UK) in May translates to an increased detection rate, as in the height of the pandemic, only severe cases will be detected, whereas broader testing is possible if the testing capacities are not flooded with severe cases. The test positivity rates quickly fell in June to 0.7% (Germany) and 1.2% (UK), and were 0.6% in July (both in Germany and in the UK).
A simple approach to operationalize the assumption of a direct relationship between the test positivity rate and the detection rate is to calibrate the model to a certain detection rate in July and set the detection rates in May and June as linear combinations based on the detection rates until April and July. The goal of doing so is to find an evolution of the detection rate that produces the empirical German epidemiological dynamics in order to obtain a baseline calibration (in-sample-fitting, i.e., descriptive output validation). Once the model is calibrated, we can test whether it is able to produce the empirical British epidemiological dynamics using the same approach and a British policy scenario (out of sample fitting, i.e., predictive output validation).
Table 1 Calibration of the detection rate
| Germany | UK | |||
| Positivity rate | Detection rate | Positivity rate | Detection rate | |
| March-April | 6.3 | 33.3 | 22 | 8.2 |
| May | 1.5 | 60 | 4.2 | 45 |
| June | 0.7 | 64 | 1.2 | 62 |
| July | 0.6 | 65 | 0.6 | 65 |
Source: The German detection rate from March- April is taken from Mellacher (2020). The corresponding UK detection rate is calculated by comparing the number of people tested in this period. The detection rate in July. The detection rates in May and June are linear combinations of the German detection rate in March-April and July, following the evolution of the test positivity rate. Test positivity rate from Roser et al. (2020).
3.6. Timeline
In a second step, we have to make the British and German policy timeline comparable. This is necessary, because the true number of infections per capita likely differed at the beginning of the German anti-COVID policies. Since British testing (based on the positivity rate) was much lazier in the beginning of the pandemic, we cannot rely on the reported number of infections. Thus, we must look at deaths in order to get a rough estimate of whether the virus had a “head start” in one of the countries.
According to data from the ONS (2020), 115 COVID-related deaths were recorded in England and Wales from the 10th to the 16th of March, which corresponds (after accounting for the difference in population size) to about 162 German deaths, which corresponds to the number of German deaths between the 16th and the 22nd of March (RKI, 2021). As a rough estimate, we can thus conclude that the virus had a 6-day head start in the UK with respect to Germany.
3.7. Policy scenarios
Table 2 shows the German and the uncorrected British containment policy scenarios. In the corrected British scenario, each policy takes place six days later to account for the six-day head start of the virus in the UK described in the previous subsection. While these scenarios are relatively detailed, some level of stylization is necessary, because of regional policy variation. This is especially true for Germany, where the “opening up” phase was largely left to the 16 states (Merkur, 2020), but also for the UK, where we can observe variation in policies between the four nations comprising the UK (England, Wales, Scotland, and Northern Ireland), as well as variation in policy adaption (The Guardian, 2020).
If family isolation and workplace isolation is activated, household members or colleagues of a detected infected are isolated. Minor social distancing ( SD ) increases the preference of agents to stay at home during leisure phases by 10%. Major SD increases it by 100% and cuts the maximum number of agents met during each phase by 50%. If schools close, children and teachers will stay at home during work phases. A household member will stay at home as a caregiver if there is a young child in the household. If commercial leisure facilities close, agents may not enter them anymore and the respective leisure plans will fail. Service workers will get paid by the government. If there is a contact ban, agents may not visit their friends anymore (but still go to non-commercial leisure facilities). Under curfew, agents may only leave their households in order to work. If non-essential industries close, a share of factories is closed down. In absence of any data on this, I assume the share to be 10%. If sanitary standards are increased, the infection chance goes down to 0% (hospitals), 25% (schools and commercial leisure facilities) and 50% (factories and offices).
Table 2 Containment policy scenarios
| German baseline scenario | Uncorrected British scenario | |
|---|---|---|
| 02/03/2020 (day 0) | Increased sanitary standards at hospitals, isolation, family isolation, workplace isolation | |
| 12/03/2020 (day 10) | Minor SD, Workplace isolation ends | |
| 16/03/2020 (day 14) | Schools and commercial leisure facilities close, major SD | |
| 17/03/2020 (day 15) | Major SD, teleworking mandatory | |
| 20/03/2020 (day 18) | Commercial leisure facilities close | |
| 21/03/2020 (day 19) | Schools close | |
| 23/03/2020 (day 21) | Contact ban, teleworking mandatory | |
| 24/03/2020 (day 22) | Curfew, non-essential industries close | |
| 06/05/2020 (day 65) | Contact ban ends | |
| 10/05/2020 (day 69) | Non-essential industries open up | |
| 11/05/2020 (day 70) | Increased sanitary standards at workplaces | |
| 13/05/2020 (day 72) | Curfew is replaced with contact ban | |
| 28/05/2020 (day 87) | Workplace isolation restarts | |
| 01/06/2020 (day 91) | Schools reopen with increased sanitary standards | |
| 02/06/2020 (day 92) | Schools reopen with increased sanitary standards | |
| 08/06/2020 (day 98) | Commercial leisure facilities reopen with increased sanitary standards | |
| 04/07/2020 (day 124) | Commercial leisure facilities reopen with increased sanitary standards | |
Sources: BBC (2020), Bundesregierung (2020a, 2020b), Mitze, Kosfeld, and Rode (2020), Welt (2020),UK Government (2020b, 2020c, 2020d, 2020e)Description: schools = schools closure, comm. Leisure fac. = commercial leisure facilities close, SD = social distancing. In the “corrected” UK scenario, each measure is enacted six days later.
4. RESULTS
The complex nature of the model used in this paper does not allow for an analytical solution. Since many stochastic processes are involved both in the model setup, as well as in the model runs themselves, it is also not sufficient to analyze just a single run. As it is standard in macroeconomic agent-based models (see, e.g., Dosi, Fagiolo, and Roventini, 2010), I analyze the model using Monte Carlo simulations in order to get an idea of the “average” result of each policy scenario. More specifically, I run each scenario with 500 distinct random seeds, which are the same for each scenario. This approach has two main advantages:
a) Commensurability: The setup is the same for each scenario, i.e., there are 500 different artificial towns in total, each of which is subjected to every policy scenario. This amounts to a perfect experiment in which each group is ex-ante identical. Thus, the ex-post differences can be traced back only to the treatment, i.e., the respective policy scenario.
b) Replicability, i.e., the simulation can be repeated using the given random seed and it will produce the same results.
I only consider simulation runs, in which the virus is not eliminated within the first x days, where x is the time horizon under investigation. This is necessary, because eliminating the virus is much easier in a population of 82,000 agents than in a population of 82,000,000 agents, but adding agents is computationally very expensive.
4.1. Validation
I now turn to model validation, i.e., investigate the relationship between my model and the empirics (Gräbner, 2018). Following Tesfatsion (2017), Mellacher (2020) conducts extensive input validation, process validation, descriptive output validation and predictive output validation on the COVID-Town model. While some inputs, all processes and most outputs are stylized facts of the real world (i.e., validated qualitatively), most inputs are directly calibrated using empirical data and the deaths curve, as well as an estimated infection curve using nowcasting data are fitted to empirical data, i.e., are validated quantitatively.
However, the data derived from the scenario presented in Mellacher (2020) only captures the lockdown phase, but not the “opening up” phase. This is reasonable, since the first German wave lasted only about 50 days in terms of new infections from the start of the scenario, whereas the restrictions were only lifted after about 100 days. Since the first wave of infections took considerably longer in the UK than in Germany, the model has to be calibrated to fit the German data for a longer timeframe, also covering the “opening up” phase after the lockdown.
Figure 3 shows that the model can -building on the baseline calibration by Mellacher (2020)- be calibrated to reproduce the empirical German death pattern of the first five months of the pandemic (descriptive output validation). Furthermore, building on this calibration, a counterfactual policy scenario in which the German government would have adopted the British containment policy yields to a death curve that is very similar to the empirical British one (the “corrected” scenario), which suggests the model fares very well at predictive output validation, at least in the UK case. Figure 3 finally also shows that the evolution of the pandemic before the usual start of the simulation (i.e., the 11th calendar week of 2020) played a crucial role, as the simulated death toll is considerably smaller, if we assume that the British situation was the same as the German one at period zero (i.e., the “uncorrected” scenario).
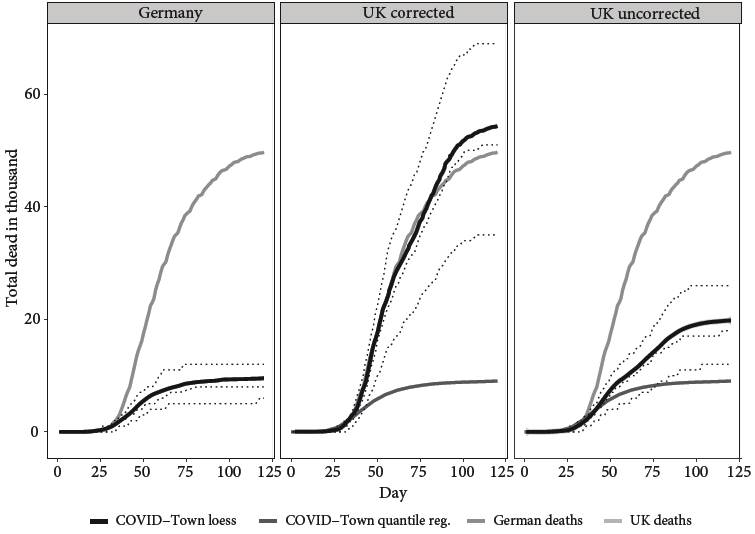
The solid black line shows local regression (LOESS), the dotted line quantile regression results
Figure 3 Simulatedcumulative total dead for Germany (left), the UK scenario which is corrected for the evolution of the pandemic until the beginning of the containment measures (middle) and the uncorrected UK scenario (right)
4.2. Counterfactual policy analysis
In contrast to purely epidemiological models, COVID-Town is also able to evaluate economic, as well as social outcomes, albeit in a more or less stylized way. The model produces many economic outputs -such as profits, production and unemployment rates in different sectors, average income of various household or worker types, the income Gini etcetera. However, in order to keep the analysis simple and not go beyond the scope of this paper, I will only compare the cumulative Gross Domestic Product (GDP) in the various scenarios with regard to economic outcomes.
It is important to note that this simulated GDP is not an accurate estimate of what the German GDP would have been, if it had enabled Johnson’s anti-COVID-19 policy, because the model lacks important features of the real world that would make such an analysis possible (e.g., an outside world and consumption / investment behavior that depends on sentiment)2.
However, the model is calibrated with empirical data and captures other important economic features of the crisis, such as heterogeneous industries which are differently affected by the containment measures, and Keynesian intersectoral spillovers of demand shortages. I also explicitly model a variety of reasons for productivity losses that are caused by the virus and the containment measures, namely a) caregivers working with lower productivity (or missing work), because schools are closed, b) workers being too sick to work, c) workers being unable to come to work, because they are under quarantine, d) workers dying. Most economic-epidemiological models do not account for any of the features a), b) or c), but COVID-Town is to my knowledge the only model that accounts for all of them. Thus, a comparative economic analysis seems to be fruitful, even though we know that it will not yield quantitatively correct predictions.
Due to the presence of heterogeneous services with a variable price in our economy, calculating real GDP is not straightforward. In order to approximate daily GDP, GDP t , I calculate the following for each day, where l i,t denotes the number of workers of type i (service workers, blue-collar workers or factory workers) employed in the private sector in the period t, l j,t the number of workers of type j (health care workers or teachers) employed in the public sector, ( the target rate of profit, and w i/j the gross wage rate of a worker. This calculation would correctly predict the GDP, if the economy were in equilibrium.
Finally, to get a quick impression of the social impact of the crisis and the containment policies, I present data on the cumulative leisure plans thwarted, i.e., the number of leisure activities planned by the agents that failed because a) the agents did not have enough money to pursue them, b) they were under quarantine or too sick, c) they were not allowed to visit a certain location, e.g., due to closures or due to a curfew, d) they wanted to meet a friend, but this friend did not want to meet them, e) they wanted to meet a friend, but this friend was too sick or under quarantine. While d) cannot be related to the pandemic in a straightforward way, all other options are more or less directly influenced by the crisis and governmental response. Thus, if a scenario causes relatively many leisure plans to fail, its negative social impact within the model is higher.
COVID-Town is highly flexible and offers, in principle, an infinite number of containment policy scenarios. In order to confine myself to the research question at hand, I study the public health, economic and social outcomes for only six scenarios: a) The German baseline scenario, b) the corrected UK scenario, which aims to mimic the empirical UK containment policy timeline, c) the corrected UK scenario with the exception that contact tracing is never interrupted, d) the corrected UK scenario, but with German-level testing, e) the corrected UK scenario with both contact tracing and German-level testing, and f) the uncorrected UK scenario, which does not account for the different evolution of the pandemic in the two countries until the beginning of March 2020.
Table 3 shows the cumulative outcomes of the first 300 periods, on the 10th of June 2020 (for the German and the uncorrected UK scenario) or the 4th of June (for the other scenarios). This time horizon was chosen, since the virus is eliminated in almost all simulation runs of scenarios involving German-level testing after 150 days and the remaining simulation runs may not be representative anymore, even though the German and the UK corrected scenario largely match the empirics for the first 120 days, as can be seen from Figure 3. The simulated GDP and the simulated thwarted leisure plans are normalized to the German baseline scenario. Table 3 reads as follows: In the UK corrected scenario, on average 48.6 agents out of 82,000 died within the first 100 days of the simulation. Adjusting for population size, the UK recorded 48.5 COVID-19 deaths within the same time horizon in the real world. Simulated GDP was 0.61% lower than in the German baseline scenario, whereas the number of leisure plans which failed during this timeframe was 32.9% higher.
Table 3 Results after 300 periods (i.e., 100 days), 10.06.2020 (Germany)
| Simulated deaths | Empirical deaths (per 82,000 inhabitants) | Simulated gdp (normalized) | Simulated thwarted leisure plans (normalized) | |
| Germany | 8.851 | 8.719 | 100 | 100 |
| UK corrected | 48.597 | 48.468 | 99.388 | 132.873 |
| UK corrected + work contact tracing | 41.057 | - | 99.132 | 133.811 |
| UK corrected + German testing | 26.873 | - | 99.607 | 132.822 |
| UK corrected + German testing + work contact tracing | 23.516 | - | 99.478 | 133.779 |
| UK uncorrected | 18.310 | - | 98.891 | 137.041 |
We can derive five main insights from these results:
A UK-style containment scenario causes worse outcomes than the German baseline scenario in every dimension analyzed. This result is in line with the public health and economic outcomes observed empirically. Although this is not measurable empirically for the social costs of the crisis in terms of forgone (“thwarted”) leisure activities, it is reasonable to assume that the curfew implemented in the UK was more expensive in this dimension than the “contact ban” introduced in Germany.
The difference in public health outcomes seem to be driven mainly by two factors: a) Timing, and b) testing. It is important to note that b) seems to have played a role in a), as my analysis suggests that the virus had a head start in the UK following the low number of COVID-19 deaths in this country before the start of the simulation (i.e., beginning of March 2020).
For lockdown timing, there seems to be some trade-off between public health outcomes on the one hand, and social and economic outcomes on the other hand, although efficiency gains due to earlier introduction of the lockdown cannot be ruled out in principle (Mellacher, 2020).
Increasing the detection rate, on the other hand, causes a Pareto improvement by reducing the number of deaths, increasing economic and (marginally) also social performance.
Not interrupting contact tracing would not have done much to contain the spread of the virus, at least in the form of tracing work colleagues. Whether or not there is a trade-off between public health and social/economic outcomes depends on whether tracing is combined with increased testing, or not. If these policies are combined, the gain in public health outcomes does not come at social or economic costs.
5. CONCLUSION
I used the economic-epidemiological agent-based simulation model COVID-Town (Mellacher, 2020) to investigate how German public health, economic and social outcomes would have changed, if it had adopted a UK-style policy against COVID-19 in the first wave.
In order to do so, I first calibrated the model to fit a German baseline scenario covering the first wave of infections including a lockdown and “opening up” phase. After fitting the model to this German baseline scenario, I set up a UK-style containment policy scenario, which does not only account for the differences in policies and timing of individual policies, but also for differences in COVID-19 testing and the different evolution of the pandemic prior to the beginning of the baseline simulation in March 2020.
In line with the empirics, the UK-style scenario causes a much higher number of casualties, as well as a larger drop in economic activity. In addition to that, my results suggest that the social costs of the crisis in terms of forgone leisure activities were drastically higher in the UK than in Germany. My analysis thus suggests that all of the public health differences and some of the economic differences between the UK and Germany can be attributed to a more efficient German containment policy.
I finally studied, how the results are impacted by the most visible differences between the policies, i.e., lockdown timing, testing and the British interruption of contact tracing. The model suggests that both lockdown timing and testing had a considerable impact on mortality, whereas work contact tracing plays a minor role. While differences in lockdown timing can show patterns of “trade-offs” between public health and economic/social outcomes, increases in the detection rate (i.e., COVID-19 testing) can increase the performance in public health, economic and (marginally) also social outcomes, i.e., constitute Pareto improvements. Work contact tracing can cause a Pareto improvement, if it is coupled with increased testing, but comes at the cost of economic performance otherwise.
Beyond the immediate research question posed in the title, this research paper shed some light on trade-offs and efficiency of containment policies more generally. However, it is naturally beyond the scope of this work, to answer them comprehensively.
In particular, a more fruitful approach to study lockdown efficiency more generally is to create flexible scenarios, in which the government reacts, e.g., to a certain incidence instead of a policy scenario that is geared towards a timeline. Such an approach is explored by, e.g., Basurto et al. (2021) and Wallentin, Kaziyeva, and Reibersdorfer-Adelsberger (2020).
Furthermore, the pandemic appears to be subject to significant seasonality, which likely stems from varying activity patterns. In principle, the COVID-Town activity model could be adapted to incorporate this kind of seasonality. Finally, a more sophisticated approach could directly model the availability of tests (and testing policies) instead of relying on setting the detection rate. In such an approach, the detection rate would emerge from the model, which could help to reproduce stylized facts in a more convenient way, especially if scenarios are to be set in a flexible way (e.g., a lower detection rate during peaks).

