


 nova página do texto(beta)
 Inglês (pdf)
 Artigo em XML
 Referências do artigo
 Enviar este artigo por email
 Citado por SciELO
  Similares em
SciELO
Similares em
SciELO 
 Permalink
1. Introduction
Since the 2008 global financial crisis, income and wealth inequalities have gained renewed attention in the economic literature and wider policy debates. Given the economic and political costs of the broadly acknowledged rise of income concentration at the top of the distribution since the 1980s, economists and politicians in the past decade have put forward various interpretations as well as proposals for reducing the gap between the very rich and the rest of the population (Milanovic, 2016). However, none of these discussions seem to have prepared our society to battle devastating consequences of inequality during the Covid-19 crisis. On the one hand, inequality aggravates the pandemic, as the wide gap between the rich and poor -in terms of income, type of employment, living conditions, access to health, and other dimensions- has major consequences for the distribution of the death toll within and between countries. On the other hand, the pandemic exacerbates inequality by widening this gap through its deep economic and social impacts.
First, the most vulnerable are more prone to be infected by the virus, due both to the need to continue working in person and to inequalities in living conditions. Second, precarious healthcare and unequal distribution of comorbidities play a role in explaining wide disparities in severity of cases and number of deaths. Third, loss of income generated by the crisis seems to disproportionately affect self-employed and informal workers, as well as lower-skilled employees in the services, retail, and construction sectors.
Hence, after an initial period in which high-income countries were the epicenter of the Covid-19 pandemic, developing countries now account for more than half of global deaths. A study by Murray et al. (2007) suggests that mortality rates during the 1918-1920 flu pandemic were up to 30 times higher in poor regions of the world. Simonsen et al. (2013) show that during the H1N1 pandemic in 2009, mortality was 20 times higher in South America than in European countries. In 2020, Latin American countries are attracting worldwide attention for their inability to fight Covid-19. Acording to data from the World Health Organization (WHO), in November, Latin American death toll passed 400,000 and Brazil topped 160,000 deaths, ranking second in the world in absolute number of deaths. If this were not enough, International Monetary Fund (IMF, 2020b) projects a fall of 8.1% in Latin America’s Gross Domestic Product (GDP) in 2020 -a number that makes the 4.4% contraction projected for global GDP look like a mild recession.
In addition to conflicting policies in the health front, wide structural inequalities, high levels of informality in the labor market, and the importance of services and tourism sectors in these economies may help explain these disastrous results. Moreover, the region was experiencing a period of slow growth and thus faced high levels of unemployment prior to the pandemic. According to World Bank data, Latin America GDP growth rate have fallen behind the World growth rate for five consecutive years1 while unemployment rate in the region has been above 7.5% since 2016. In this context, many of these countries lacked the fiscal space to react proportionately: As of October 2020, $63.5 million dollars in loans from the IMF to fight the crisis in twenty countries in Latin America (IMF, 2020a).
By the beginning of August, countries like Peru, Chile, and Brazil had the fiscal space to spend more than their neighbors (IMF, 2020a) but have nonetheless presented some of the highest numbers in the world with respect to deaths per 100,000 people2. In contrast, according to WHO data, by November, Uruguay had accumulated 62 deaths and ranked 142nd out of 219 countries in terms of deaths per 100,000 people while spending less than 2% of GDP to fight the pandemic. While other differences certainly have played a role, Uruguay is known for its relatively low level of income inequality in the region: The 2018 Gini index for Brazil was 53.9 and only 39.7 in Uruguay (World Bank Data).
High inequality may contribute to explaining why in November, Brazil has the second-highest number of accumulated deaths and third-highest number of cases in the world, even after spending more than 6% of GDP in fiscal measures to fight the Covid-19 crisis. Setting aside the antiscience discourse of the federal government and the overall disastrous approach on the health front, the second section will examine the country’s wide inequalities as a risk factor in the pandemic. The third section will build a preliminary analysis of the consequences of Covid-19 crisis for inequality in Brazil. The final section concludes the paper.
2. Inequality as a risk factor for Covid-19: measuring the social risk of infection by Covid-19 in Brazil
Several dimensions of structural inequalities can potentially increase the risk of infection and death during the pandemic. First, low-income populations are more exposed to contamination. Second, access to healthcare is not evenly distributed in Brazil. Third, low-income populations infected with the novel coronavirus tend to have worse outcomes.
In this section, we will discuss in detail these three aspects of inequalities in Brazil and construct a measure of the number of social risk factors for Covid-19 infection that sheds light on the roots of the unequal observed health outcomes by region, income, and race in Brazil during the Covid-19 pandemic.
2.1. Inequality and the social risk of infection
The Covid-19 epidemic spread quickly, releasing a scientific race to understand the effects of the virus. Bioscientists and medical authorities ascertained that a few social and health factors increased the risk of contracting and dying of Covid-19: Age, sex, and underlying health conditions. Epidemiologists warned that large social gatherings, poor hygiene, and closed spaces would lead to more infections. Social scientists cautioned that structural inequalities increased the risk of minorities and poor populations getting sick and dying from Covid-19. The warnings of medical authorities and epidemiologists were turned into guidelines and policies, but the warnings by social scientists were mostly ignored by authorities and the virus’s arrival into unequal societies uncovered a challenge. Policies that treated everyone as equals exacerbated structural inequalities and revealed the discrepancies in living, working, economic, and health conditions.
Data on the evolution of the virus’s spread by neighborhood in New York City soon corroborated socioeconomic characteristics were responsible for stark differences in infection, hospitalization, and death rates. As of the end of July 2020, data from the NYC Department of Health and Mental Hygiene showed Latino and black populations’ infection rates around 1.6 times higher, with hospitalization and death rates around two-times higher than those of white population. Furthermore, infection, hospitalization, and death rates are higher among the poor (Centers for Disease Control and Prevention, CDC, 2020).
Studies on previous respiratory infection epidemics (1918-1920 flu, H1N1, and SARS) have shown that social inequalities are a determinant for the rate of transmission and severity of these diseases (Cordoba and Aiello, 2016; Mamelund, 2017; Bucchianeri, 2010). Multidimensional poverty is responsible for the fact that those living near the poverty line did not have the means to avoid infection. Structural racism plays an important role in explaining why minorities are also particularly vulnerable to infections. They are overrepresented in essential jobs and more likely to be dependent on public transportation. Minorities in big cities are concentrated in neighborhoods that experience outbreaks, and the higher population density and likelihood of sharing smaller houses with more people increase contagion rate. Furthermore, once infected, poor and minority populations are more likely to have worse outcomes due to a higher prevalence of comorbidities and more precarious access to healthcare.
The United States and Brazil share two crucial characteristics: High income inequality and a history of slavery. It is thus expected that race and low income in Brazil would also be risk factors for Covid-19 infection. To investigate, we build a measure of individuals’ social risk factors to the virus using the Continuous National Household Sample Survey (PNAD Contínua, Pesquisa Nacional por Amostra de Domicílios Contínua) of the Instituto Brasileiro de Geografia e Estatística (IBGE). We construct binary variables to indicate a social risk of infection according to living and working characteristics. The work-related risk factors considered for an individual are: Employment in a job that has been deemed essential by the federal government, being informally employed (not having carteira assinada)3, not owning a car or a motorcycle, and not having internet access. Regarding living conditions, we consider living in a house with more than three occupants per bedroom or with no plumbing and no sewage system to be a social risk. We compute the measure as the sum of social risk factors to Covid-19 contamination for each individual.
Figure 1 shows the correlation between our measure and accumulated cases and deaths per 100,000 people. The Pearson correlation coefficients are calculated per day since the number of cases and number of deaths first surpassed 100. Panel C displays the evolution of the correlation coefficients by day, while panels A and B present scatterplots for the days in which we observe the strongest correlation between social risk factors to Covid-19 and cases per 100,000 (May 29th) and the strongest correlation between our measure and deaths per 100,000 (June 15th). Panels A and B show that the average of the selected social risk factors to Covid-19 for each Brazilian state positively correlates with the number of Covid-19 cases per 100,000 and Covid-19 deaths per 100,000 , respectively. In panel A, we observe that states in the North and Northeast regions with higher social risk rating also have a high infection rate, even if these states represent a larger share of rural areas (less affected by the virus); high average of social risk factors in the largest cities in these two regions explains this apparent contradiction. Manaus, the capital of the Northern state of Amazonas, appeared to have the fastest contagion rate and an explosion in mortality in the first months of the pandemic (Orellana et al., 2020). As a consequence, mortality rates in the state of Amazonas have been four-times higher than the national average and even in remote towns people have been as likely to get sick as in New York City. Tragically, the virus exacted an especially high toll on indigenous people (Andreoni, Londoño, and Casado, 2020). Figure 1, panel A suggests that the social risk factors selected in this paper had substantial explanatory power for Covid-19 infection rates.
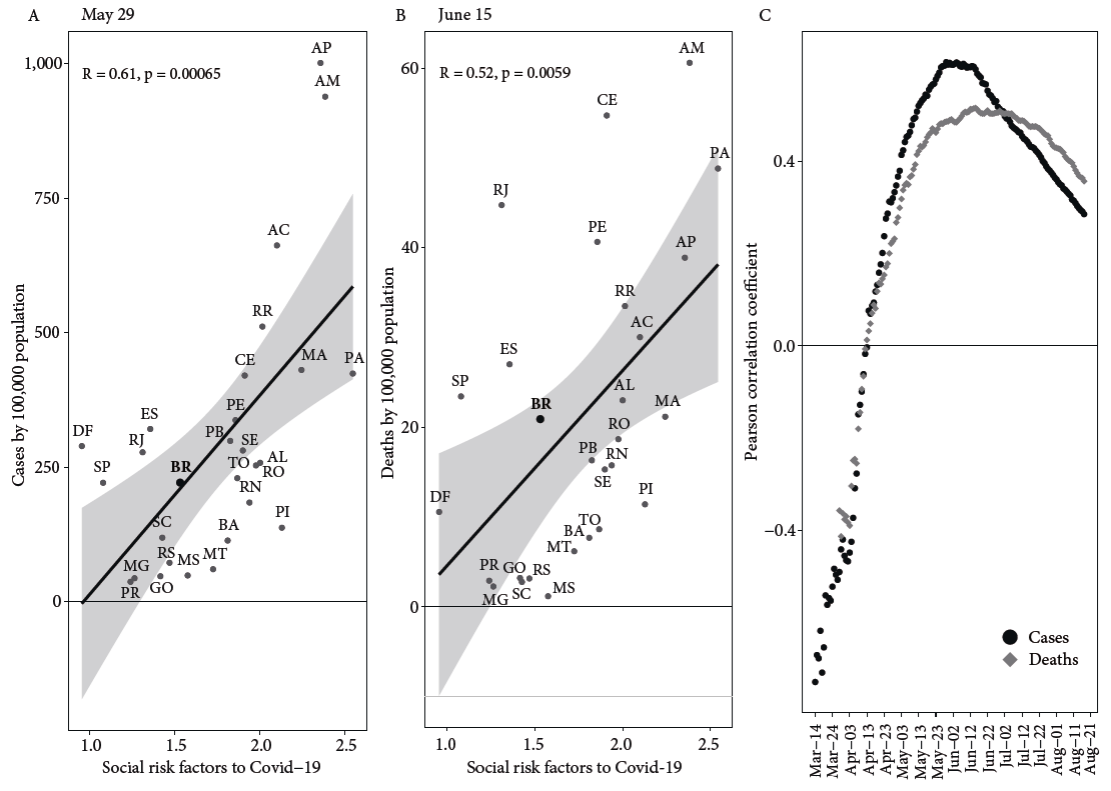
Source: Authors’ calculation with data from PNAD Contínua (IBGE, 2019) and Painel Coronavírus Brasil (Coronavírus Brasil, 2020).
Figure1. Correlation between social risk factors to Covid-19 and Covid-19 cases and deaths by population by State, 2020
Examining panels B and C, we notice that the positive correlation between the number of social risk factors to Covid-19 and deaths per 100,000 is less robust. This is evidence that the factors taken into account in our measure of social risk explain well the vulnerability to infection, but that other factors, not taken into account so far, are important for explaining the differences in death rates. Those will be discussed in the following sections.
The correlation between the number of social risk factors to Covid-19 and the number of reported Covid-19 infections and deaths have also changed during the pandemic, as we observe in panel C. It was relatively low when the country first reached 100 cases in mid-March and 100 deaths at the end of March, it increased between then and the end of May, and it started to fall in mid-June. As the first reported cases have been associated with travel abroad, the virus took time to spread from elite circles to more vulnerable areas. One possibility is that the explanatory role of social risk factors for infection rates increased as the pandemic affected the entire population. As the virus reached major metropolitan areas, and a relevant proportion of those socially at risk were exposed, the infection rate among this group may have started to fall, reducing this correlation in a third stage of the pandemic. A study carried out in São Paulo (Tess et al., 2020) revealed that between 15% and 20.9% of the population in Brazil’s biggest city have already been exposed to the virus.
According to our measure, the average Brazilian accumulates 1.53 social risk factors, though there are regional, racial, gender, and educational discrepancies in the values. In North and Northeast regions, which are the poorest and most unequal ones4, individuals are at higher social risk (2.35 and 1.92, respectively) than the average Brazilian, while those living in the South, Southeast, and Midwest regions are less vulnerable than the average Brazilian according to our measure. The social risk to infection also decreases with educational attainment, as those who have less than a high school degree are found to be more vulnerable than the average Brazilian. For those with a college degree and above, the measure is approximately twice as small (0.98) than for those without any formal education (1.86).
Table 1 presents the average number of social risk factors to Covid-19 by race and sex. The IBGE provides five race classifications: Brancos, Pretos, Amarelos, Pardos, and Indígenas, here translated as white, black, Asian, brown, and indigenous. Those correspond respectively to 46%, 9%, 1%, 44%, and 0.4% of Brazil’s population. The term Pardo aggregates the vast majority of African and native Brazilian descendents5.
Table1. Social risk factors to Covid-19 by race and sex, 2019
| Total | Women | Men | |
|---|---|---|---|
| All races | 1.53 | 1.39 | 1.68 |
| White | 1.25 | 1.14 | 1.38 |
| Black | 1.74 | 1.59 | 1.88 |
| Asian | 1.17 | 1.12 | 1.24 |
| Brown | 1.74 | 1.59 | 1.90 |
| Indigenous | 2.01 | 1.82 | 2.20 |
Source: Authors’ caulculation with data from PNAD Contínua (IBGE, 2019).
For all racial groups, women are less vulnerable than men. Although the average woman is less vulnerable than the average person, this is not true for black, indigenous, and brown women. When we look at the number of social risk factors by race, only white and Asian persons are less vulnerable than average.
Lower infection rates among women, higher rates among minorities, and lack of intersectional data on cases poses a difficulty in inferring the health impacts of Covid-19 on women of color. Our results for the intersection of sex and race shed some light on this discussion and stress the importance of taking the unequal health burden of Covid-19 on women of color into account.
We now turn our discussion to the intersection between class and race. It has been established that low-income and racialized populations are at increased social risk of being infected and dying from Covid-19, but structural racism makes it impossible to separate these factors. Figure 2 presents the average number of social risk factors by income percentile with information for two racial groupings: Black, brown, and indigenous -which in the aggregate experience above-average social risk- and white, which are culturally dominant in Brazilian society. Income percentiles were calculated from per capita household income reported in the survey. The first two interesting aspects to notice are that, except for the fifth decile, the number of social risk factors falls steadily with income, and that black, brown, and indigenous populations are at higher social risk than white populations in every income percentile. The average Brazilian in the bottom 60% of the income distribution presents social risk above the national average and race seems to be a determining factor. For white people, the measure falls below the national average at the fourth decile; black, brown, and indigenous people only escape the above-average social risk in the top four deciles.
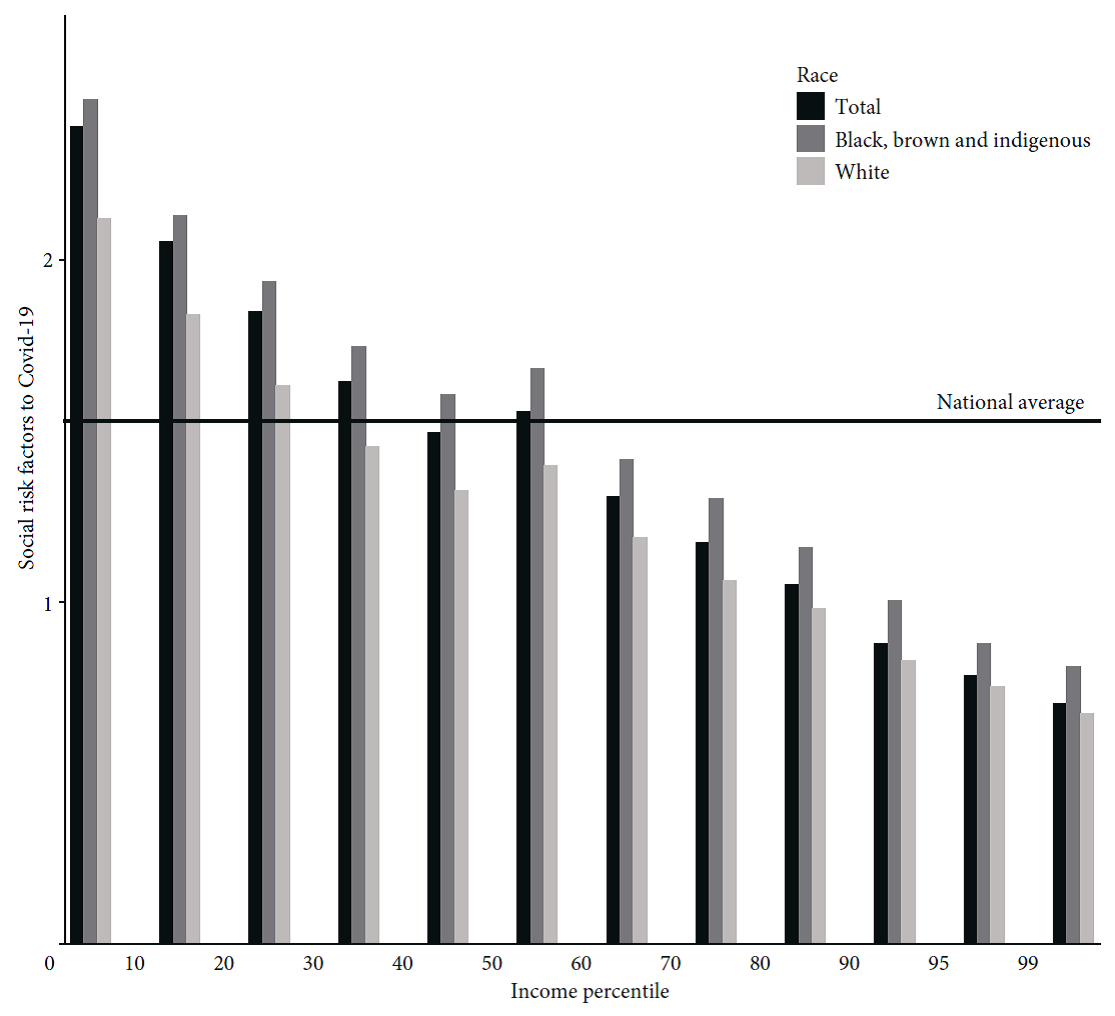
Source: Authors’ calculation with data from PNAD Contínua (IBGE, 2019).
Figure 2 Average social risk factors to Covid-19 for selected racial groups and income percentile, 2020
Another worrying pattern is the fact that the racial gap in the number of social risk factors is higher at the bottom of the distribution than at the top. Those at the intersection of race and poverty are therefore much more vulnerable to Covid-19. An even more dramatic pattern is observed for the intersection between race and low educational achievement, with whites of all educational groups facing below-average social risk, while for black and brown people only those that started or earned a secondary diploma present less social risk factors than the average Brazilian.
Our results highlight the importance of recording infection, hospitalization, and death rates not only by race, sex, and income, but also for the intersection of those groups. The lack of microdata that would allow researchers to assess how structural inequality, racism, and sexism imposes an unequal distribution of vulnerabilities across different social groups is an obstacle to the design of effective policy measures.
The data presented in this section shows that when Covid-19 started to spread locally in Brazil, racialized and low-income populations were at increased risk of being exposed to the virus. We also showed that the number of selected social risk factors has a high correlation with the number of cases by population by State, but that those factors alone have less explanatory power over death rates. This corroborates the importance of taking into consideration additional factors for observing socioeconomic inequalities in the numbers of cases and death tolls: Previous inequalities in health access and outcomes lead to inequalities in the severity of cases.
2.2. Inequality and access to healthcare
As dictated by the Brazilian constitution of 1988, health is a universal right and a responsibility of the state that should be equally accessible and regionally decentralized. The implementation of the Unified Health System (SUS, Sistema Único de Saúde) began in 1990 and has allowed Brazil to slowly address the nation’s health inequities, already exacerbated during the preceding 20 years of military dictatorship. Nonetheless, this system still falls short of achieving its egalitarian goals.
Another important aspect of Brazil’s healthcare system is the coexistence of a large private health network, mostly available to those who can afford health insurance. According to Guimarães (2020), the overall number of beds available in the private and public systems are comparable, though numbers from the National Health Survey (PNS, Pesquisa Nacional de Saúde) of the IBGE show that 71% of Brazilians rely on the public healthcare system and 72% of Brazilians do not have private health insurance. Those numbers are higher for black, brown, and indigenous populations (80% and 81%, respectively) and for those that did not complete middle school (83% and 84%, respectively).
The Northern region’s population is the most dependent on the public system (80%) and is home to the lowest proportion of those that have been to a doctor in the last year (61%). The same discrepancies are observed when we evaluate race and educational attainments, with black, brown, and indigenous populations and those that did not complete middle school being more dependent on the public system and less likely to have been to the doctor in the last year.
Unequal healthcare access in Brazil had two consequences for the pandemic. First, the Brazilian public system was unprepared, and particularly so in the North and Northeast regions, to provide services to those infected by the virus. Second, even before the pandemic, many individuals -especially those racialized and living in poorer regions- had compromised immune systems. This last argument is further scrutinized next.
2.3. Inequality and comorbidities
According to the WHO (2020), 80% of people infected by Covid-19 will experience mild symptoms. It is consistently observed across countries that age and underlying health conditions can explain severe illness, need of hospitalization, and death (Guan et al., 2020).
As studies show prevalence of lower respiratory illness (Margolis et al., 1992) and diabetes (Gaskin, Thorpe, and McGinty, 2014) are correlated with educational attainment, income, and race. Brazil does not escape this pattern, with regional and educational gaps among those diagnosed with diabetes and hypertension (Viacava et al., 2019; Leite et al., 2015).
To investigate if prevalence of comorbidities that are associated with increased risk for Covid-19 is socially determined in Brazil, we use the 2013 PNS and evaluate the correlation between incidence of health risk factors and educational attainment. We consider health risk factors to include being over 60 years of age, being diagnosed with diabetes, hypertension, asthma, lung disease, coronary disease, or chronic kidney disease. The fact that the information on diseases is self-reported and requires a previous diagnosis by a doctor leads to racial, educational, and regional biases. To partially correct for this, we restrict our sample to individuals who have consulted a doctor within the last year, which corresponds to 72% of our initial sample population6.
The proportion of our sample of who falls into the group considered at health risk for Covid-19 is 42%. However, the number of health risk factors is not equally distributed among the population. As shown in Figure 3, the proportion of people who declared to have attended only elementary school and present one or more health risk factors is 60%, compared to 32% for those who attended high school and 37% for those who have started a higher degree. This difference is even greater when considering those who have more than one health risk factor, with a frequency among those who attended up to middle school 2.5 times higher than among those who attended high school and twice as high than for those that started a graduate degree.
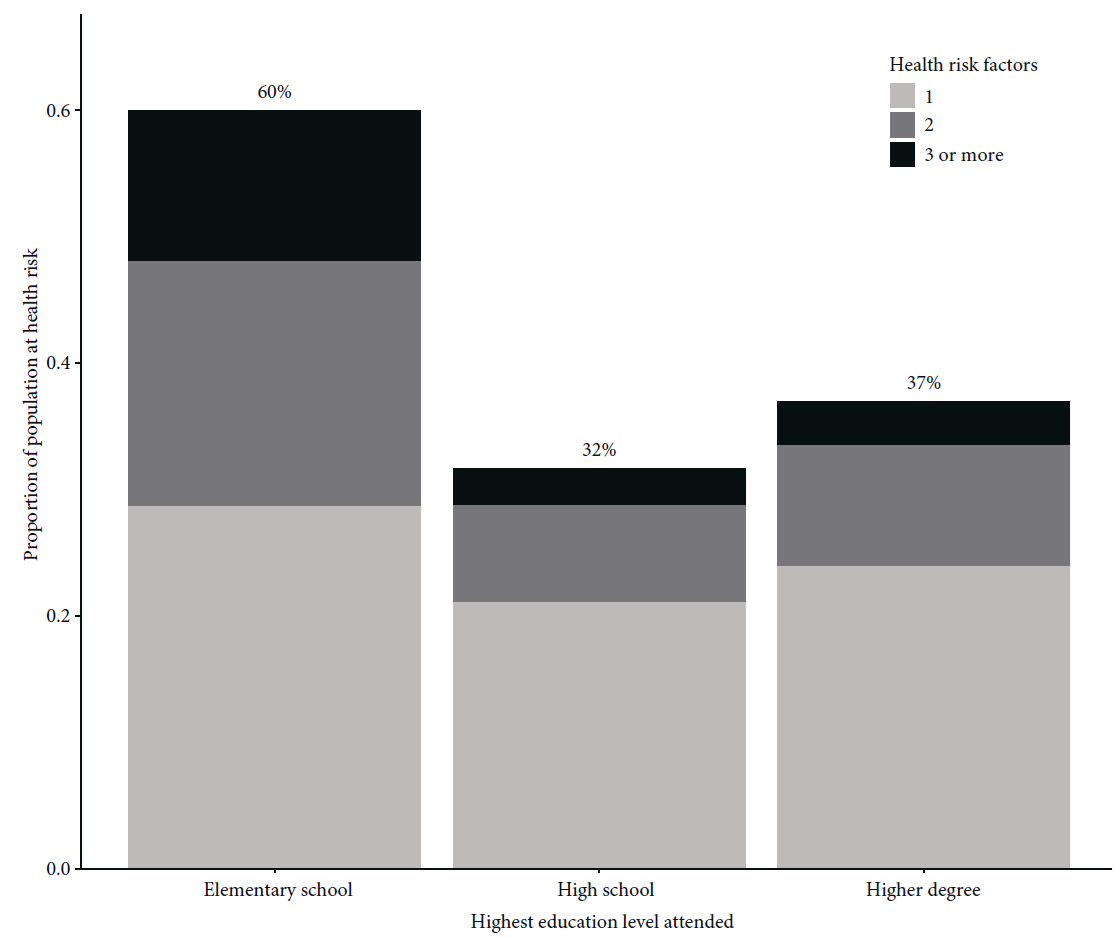
Source: Authors’ calculation with data from PNS (IBGE, 2013).
Figure 3 Proportion of population at health risk by education attainment, 2013
When we consider all results presented in this section, it is clear that when Covid-19 reached Brazil it found a structurally unequal country, where certain social groups were more vulnerable to infection, less likely to have access to healthcare, and more likely to develop severe illness. Finally, the juxtaposition of these three layers of vulnerability were more prominent for those at the intersection of class and race. Therefore, without a strong policy response to support vulnerable groups, Covid-19 health burden in Brazil will be necessarily higher for racialized, poor, and less-educated populations. In the next section we discuss economic policies implemented and study observed health and economic impacts of Covid-19 in Brazil so far. We then analyze if policies implemented have been successful in mitigating expected unequal distribution of the health and economic costs of Covid-19.
2.4. Social and health risk factors, Covid-19 infections, and mortality
The number of reported Covid-19 cases and deaths in Brazil clearly reflects the country’s deep racial and regional inequalities. When the death toll reached 54,488 people, a technical report (Soares, Cravo, and Tatsch, 2020) based on official health statistics showed that 61% of the dead were black or brown (categories that together make up only 54% in Brazil’s population, according to the census). In the Northeast, black and brown people made up 82% of total deaths while only accounting for 70% of the region’s population. Data from National Household Sample Survey Covid-19 (PNAD Covid-19, Pesquisa Nacional por Amostra de Domicílio Covid-19) of the IBGE point in the same direction. Among respondents who declared having had at least three Covid-19 symptoms in the previous week, 62% were black and brown -a proportion significantly higher than the 55% share of black and brown people in the full sample. For those who had more than six symptoms associated with Covid-19, this share goes up to 66%. Finally, considering only those who had to be hospitalized for one or more days, 60% are black and brown (this share goes up to 70% of those who required a ventilator).
The evidence reflected in the deep racial inequalities in the distribution of social risk factors to Covid-19 infection, incidence of comorbidities, and access to healthcare may help explain such racial dispari ties in proportion and severity of Covid-19 infections. In fact, racial inequalities seem to have played a more important role in explaining different rates of infection and hospitalization than income inequalities for most of the population. The share of respondents in each section of the income distribution who declared having had at least three Covid-19 symptoms in the previous week corresponds exactly to its share in total population, as depicted in Figure 4. In other words, being at the bottom 50% (or at the top 10%) of income distribution in Brazil does not seem to increase (or decrease) likelihood of infection. When observing the share of hospitalizations and, even more so, the share of respondents who have been put on a ventilator, disparities become apparent at the top of the income distribution: For the top 10%, the proportion of individuals who required a ventilator is only 1.6%.
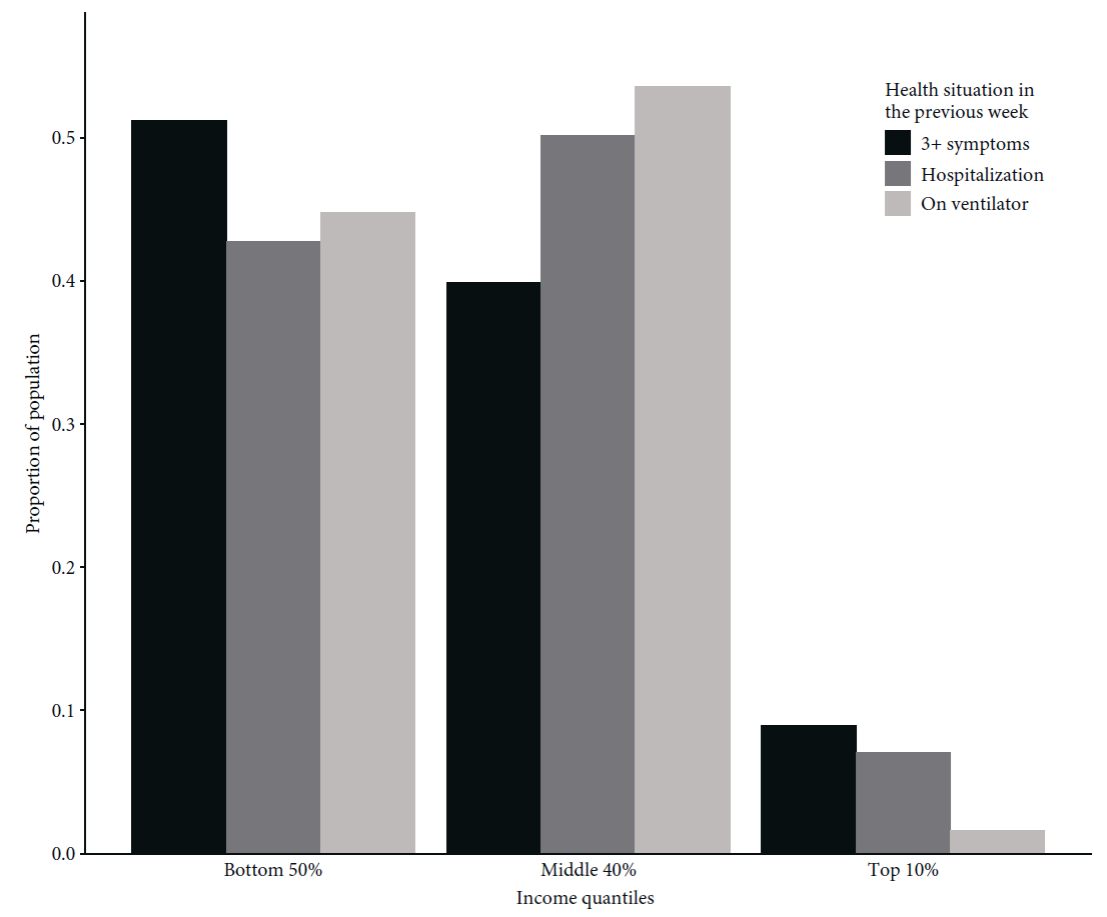
Source: Authors’ calculation with data from PNAD Covid-19 (IBGE, 2020a).
Figure 4 Proportion of population declaring Covid-19 symptoms, hospitalization, and requirement of a ventilator in the previous week according to the income distribution, 2020
A few hypotheses explain this pattern. First, those at the bottom 50% of income distribution in Brazil are highly concentrated in rural areas in the country’s North and Northeast, which presented a lower rate of infection than metropolitan areas in the Southeast. Additionally, these areas provide lower access to hospitals. Both these facts help explain why the bottom 50% of the distribution seems to have a lower rate of hospitalization than the 40% at the middle of the distribution, which includes socially vulnerable workers in big cities in Southern states. Second, Brazil’s deep income inequalities have traditionally been associated with a disproportionate concentration of income at the very top: The top 1% of Brazilians in the income distribution receive more than one quarter of national income. As a consequence, income differences between the top and middle of the distribution are higher than those between the middle and bottom, contributing to disparities in the use of ventilators appearing at the top. These disparities are even more significant when one takes into account that access to ventilators is largely concentrated in the private healthcare system, which is only available to the portion of the population that seems to have been the least in need of such access.
3. The socioeconomic impact of the pandemic in Brazil
As opposed to several high-income countries that entered their Covid-19 crises following long periods of economic expansion and reductions in unemployment rates, Brazil experienced a 7% fall in GDP in 2015-2016 and had since been going through its slowest ever economic recovery. Moreover, as a result of the combination between fiscal expansion and slowdown in tax receipts, the electoral year of 2014 brought about the first increase in Brazilian public debt relative to GDP in this century.
In the years that followed, the rise in public debt was used to justify the adoption of a fiscal consolidation program focused on cutting public investment and approving structural reforms in the pension system and other sources of mandatory expenditures. In 2016, congress passed an amendment to the constitution establishing a ceiling for federal primary expenditures: The budget would only be allowed to expand at the rate of the previous year’s inflation. In other words, the country was headed toward a substantial reduction in the size of the state, as public expenditures would not be allowed to keep up with GDP growth. It also attached Brazil’s commitment to austerity to the constitution and restricted future governments’ ability to implement anticyclical economic policies.
As unemployment almost doubled -from 6.5 million people in 2014 to 13.2 million people in 2017- former president Michel Temer approved a labor reform that allowed for more flexible work contracts. Not surprisingly, the agenda was unable to deliver the promised surge in investors’ confidence, leading to successive frustrations in GDP growth projections since the recovery started in 2017. Even if the economy had continued to grow at the same pace, Brazil would only have returned to its precrisis real GDP level by 2025 -more than ten years after the 2014 peak. To make matters worse, since 2015 income inequality grew an average of 50% faster than it fell in the 2000s, and households were still trying to cope with significant levels of debt and increasingly precarious jobs. Before the Covid-19 crisis, Brazil counted 38.4 million informal workers (41.3% of the labor force) and 12.5 million unemployed (11% unemployment rate).
The Covid-19 shock came right after another round of frustrating GDP numbers released in early March: Economic growth in 2019 -the first year of Bolsonaro’s presidency- slowed to 1.1%, far below market expectations from the beginning of the year of around 2.6%. The reaction in congress to the disappointing economic performance had already revealed growing discontent with the ability of the austerity agenda and the spending ceiling to deliver economic growth. But it was the sanitary crisis unraveled by Covid-19 that would put a halt in the five years of austerity in Brazil. In the end of March 2020, President Bolsonaro decreed a state of public emergency, allowing government expenditures during the pandemic to go beyond what is allowed by fiscal rules (including the spending ceiling).
3.1. Policy responses and the impact of Covid-19 on inequality
Brazil has adopted loose, inarticulate, and insufficient lockdown measures, as the president continuously denied scientific evidence and blamed the economic collapse on state governors and mayors who imposed any restrictive measures. On April 11th, Brazil had officially reported 1,000 deaths while ranking 131st in an index that classified 178 countries with respect to strictness of government responses (see Roser et al., 2020).
The same disregard cannot be attributed to the Brazilian government’s fiscal response. According to the IMF (2020a), the ten advanced economies of the G20 spent, on average, 6.6% of GDP (including deferred taxes) on fighting the pandemic. The average health expenditures in these countries were 0.5% of GDP, with the greater part being destined for income transfers and job maintenance programs. In the ten developing economies of the G20, the fiscal response only added up to 2.8% of GDP on average, from which the same 0.5% of GDP was classified as health expenditures. In other words, this group of developing countries has spent three times less in nonhealth areas relative to the size of their economies (and ten times less if we consider the absolute dollar value of the response) than the advanced economies considered above. However, the same database shows a total of 6.5% of GDP in additional spending and foregone revenues in Brazil (0.9% of GDP in the health sector and 5.6% of GDP in the nonhealth sector). Brazil has thus matched the average fiscal response of the group of advanced economies in the G20 relative to its GDP. Its fiscal response was smaller than that of the United States, Japan, Germany, and Australia, but greater than that of Canada, France, Italy, Korea, Spain, and the United Kingdom. As a consequence, fiscal projections suggest that the country will run a primary deficit of more than 8% of GDP in 2020 and that public debt will go beyond 100% of GDP in 2026.
Almost half of the total additional expenditures approved by May 15, 2020 were allocated to the emergency cash relief program Auxílio Emergencial, while the job maintenance program, which guaranteed partial or full payment of unemployment insurance to workers with reduced or suspended work contracts, accounted for 22% of the total expenditure. Spending more than 2% of GDP on Auxílio Emergencial was not a decision made by the executive branch of the government, but rather a package pushed by the national congress with the support of numerous actors in civil society. The program, originally approved for three months and already extended by another six, transferred R$600 (around $110)7 per adult on a monthly basis in the first five months (and will transfer R$300 in the last four months) to unemployed and informal workers, as well as to beneficiaries of the cash transfer program Bolsa Família8. The administrative capacity developed in Brazil for managing Bolsa Família and other social protection programs in the past decades helped in the implementation of Auxílio Emergencial. Brazilians who were registered as potential beneficiaries for other social programs but were not drawing a pension or unemployment insurance were automatically qualified to receive the emergency cash relief. Other informal and unemployed workers were able to fill out a form through a mobile app released by the public commercial bank Caixa Econômica Federal to apply for the benefit. By July, more than 60 million people had directly received the cash transfer and more than half the population had benefited from it.
According to a special June 2020 PNAD Covid-19 released by IBGE, cash transfers from Auxílio Emergencial more than compensated for beneficiaries’ income losses during the crisis. As observed in Figure 5, the loss of labor income for the bottom 50% of the distribution was smaller than the average per capita income gain from the emergency program. While there are important methodological differences between PNAD Covid-19 and previously conducted surveys, data also suggests that the Auxílio Emergencial program was responsible for reducing poverty to its lowest historical level precisely during what may become the deepest recession in world history (Duque, 2020). When focusing on black and brown respondents, the average 17% loss in labor income has been fully neutralized by the cash relief program.
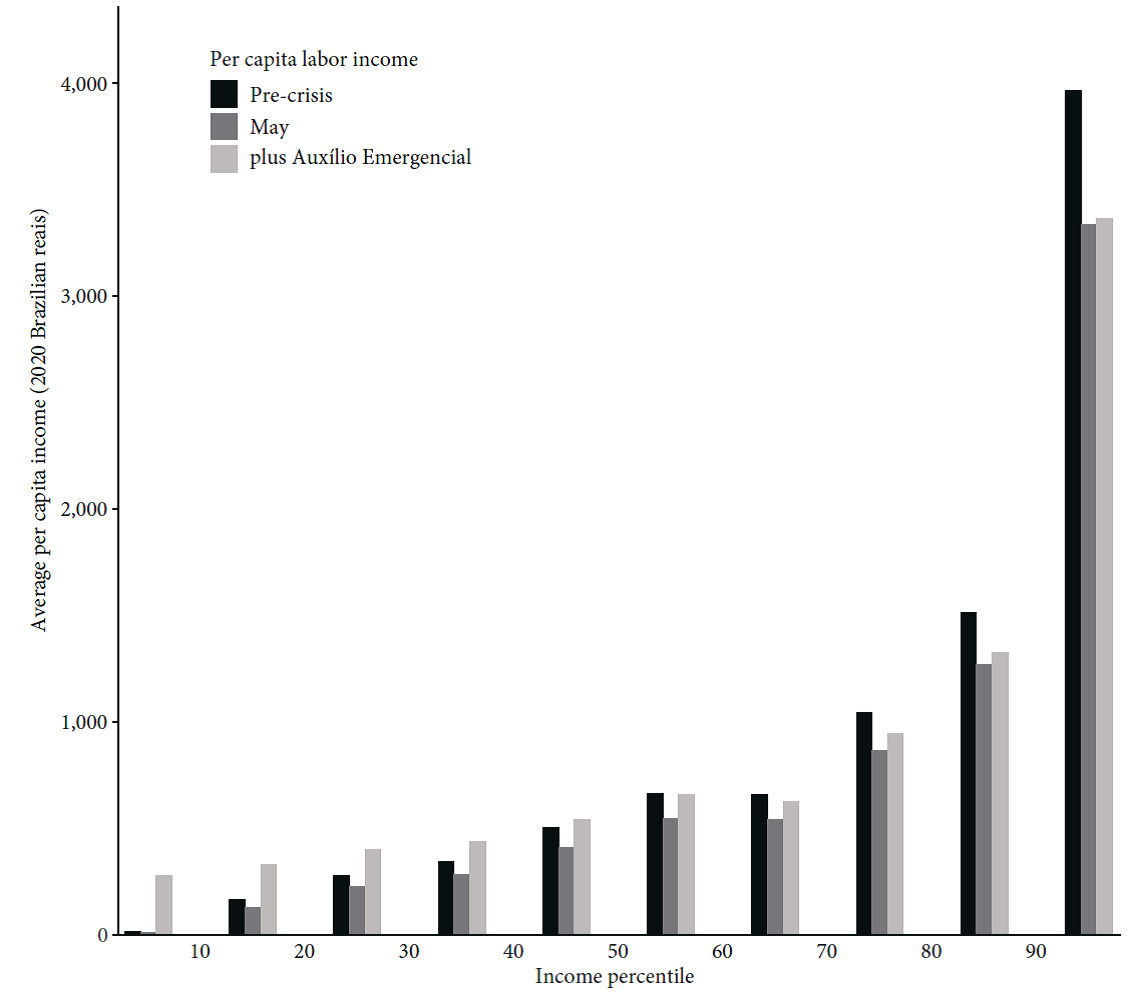
Source: Authors’ calculation with data from PNAD Covid-19 (IBGE, 2020a).
Figure 5 Average per capita labor income before and after Covid-19 and with Auxílio Emergencial by income decile, 2020
Hence, the program has so far fully neutralized the pandemic’s initial impact on income inequality: While the PNAD Covid-19 survey suggests that the Gini index for per capita labor income increased9 from 0.64 to 0.67 during the crisis -representing a significant 5% rise in inequality- this index falls to 0.56 when adding the per capita value obtained from Auxílio Emergencial in the corresponding household.
However, as the original benefit (approved for three months and then extended for another two) has been reduced by half as of September and is only approved to last until December, these numbers may change quickly. In particular, the substantial fiscal response in Brazil was not matched by an adequate expansion of credit lines to businesses (see Pires, 2020), which seems to be leading to a mass bankruptcy of small firms. Until the first half of July, another survey (IBGE, 2020b) revealed that 716,000 companies had closed -99.8% of which had fewer than 49 employees. As the small businesses going bankrupt are concentrated in sectors in which low-skilled labor predominates (services, retail, and construction), the crisis may continue to disproportionately affect jobs and wages at the bottom of the distribution.
A labor market survey released in August by IBGE10 shows that between April and June 2020, the greatest job losses happened in the food and housing sector, domestic services, construction, and other services (a reduction of 26.1%, 24.7%, 19.4%, and 17.5%, respectively, relative to the same quarter in 2019). In the PNAD Covid-19 survey, the reduction in labor income of individuals who have at most a middle school education was already at 18.5%, relative to a 13% decrease for workers with a college degree or more.
As the crisis is expected to last through 2021, the generous but temporary Auxílio Emergencial might have only postponed the pandemic’s effect on income inequality in Brazil. An abrupt termination of the program and a return to austerity measures in 2021 could amplify the same inequalities that made the country so vulnerable to the health, economic, and social effects of Covid-19.
4. Conclusion
As of November 12, 2020, Brazil has reported 164,000 deaths by Covid-19. If the disastrous response on the health front by the antiscience federal government were not enough, this paper demonstrated how structural inequalities played an important role in explaining this tragic outcome. First, our measure of the number of social risk factors to Covid-19 contamination, built around several dimensions of inequality (i.e., work, transportation, infrastructure, and living conditions) is positively associated with Covid-19 cases across Brazilian states and represents deep racial, income, and regional inequalities. Second, the country’s stark inequalities in access to healthcare due to the duality between the private and public systems contribute to explaining why social risk factors alone do not account for observed disparities in the number of deaths. Third, the comorbidities associated with more severe cases of Covid-19 are also shown to be unequally distributed, thus helping explain the observed gap between the top of the distribution and the rest of the population in terms of ventilator use during the pandemic.
When addressing the social and economic effects of Covid-19, we have shown that the substantial fiscal response pushed by congress -particularly the implementation of the emergency cash relief program Auxílio Emergencial during the pandemic- has been able, through a reduction of poverty levels to a historical low, to neutralize the initial rise in wage inequality caused by the crisis. While this short-term response was insufficient to compensate for the effects of structural inequalities on the country’s infection rates and death toll, it has certainly been able to prevent additional social and economic costs to the most vulnerable. However, the program is scheduled to end on January 1st 2021 and the sharp increase in public debt during the pandemic has already presented an opportunity for Bolsonaro’s ultraliberal economic team to push for the return of an austerity agenda that would be even more severe than the five years of pre-Covid austerity policies.
Our results suggest that problems of multidimensional inequality and structural racism are of paramount importance and racial and regional differences need to be addressed through a government effort to permanently strengthen social welfare programs and public health, education, and infrastructure systems. Unfortunately, Brazil does not seem to be heading in that direction. In light of the evidence that social inequalities increase the breadth and length of the pandemic and the presence of a deep economic recession, the threat of a return to an economic agenda centered on cutting social expenditures poses major health and social risks. More generally, pursuing the past decades’ economic framework on a global level will accelerate the same tendencies in the labor market and in inequality that imposed high social, health, and economic costs during the Covid-19 pandemic, paving the way for further tragedies. Our analysis suggests that Covid-19 has exacerbated inequalities that made the pandemic worse, thus requiring an even more substantial effort by governments to counterbalance these tendencies.
In this context, low- and middle-income countries with high levels of inequality require an even more substantial fiscal response to neutralize these effects. However, these are also countries more susceptible to external restrictions, capital flight, and budget constraints in the era of financial liberalization. The way our globalized world and economic system has been shaped in the recent past can be seen as a major comorbidity in compounding the symptoms of the pandemic in 2020. Structural changes to the global labor market, increasing underemployment in high-income countries, and economic insecurity elsewhere are likely to widen health inequities in the longer term and leave us even more vulnerable to future pandemics.

