


 nueva página del texto (beta)
 Inglés (pdf)
 Artículo en XML
 Referencias del artículo
 Enviar artículo por email
 Citado por SciELO
  Similares en
SciELO
Similares en
SciELO 
 Permalink
1. Introduction
This paper is an analysis of the economic impact of the Covid-19 pandemic in India. First, the paper explains the status of growth and development in the Indian economy over a decade prior to the pandemic. Secondly, it describes the nature of impacts inflicted by the lockdown in the economy between March 2020 and October 2020. Thirdly, it attempts to quantify the extent of economic losses in India using an Input-Output framework. Finally, it critically assesses the economic response of the Indian government in a comparative framework.
The impact of the Covid-19 pandemic on the global economy has been profound. It was on a fragile global economy that the pandemic first arrived in the early weeks of 2020. Strict lockdowns became necessary in almost all countries; in many countries, a second lockdown has been imposed to respond to the second wave in winter. Economic activities came to a halt. As factories and offices are temporarily closed, the production of goods and services declined. Supply chains were severely disrupted. Concurrently, autonomous to the supply shock, a shrinkage took place on the demand side. As economic units were shut down, people lost jobs and wages. Aggregate effective demand also fell.
In short, the economic crisis induced by the pandemic was marked by an autonomous, concurrent, and global decline in demand and supply. The shocks to the real economy have spilled over into the financial and external sectors. In summary, from being a health crisis the pandemic has expanded into a global economic crisis.
2. The pandemic and the Indian economy
As with the global economy, the Indian economy too was faced with multiple constraints when the pandemic emerged. We shall outline the major features of the crisis in the Indian economy prior to the pandemic before discussing the economic situation after March 2020.
2.1. The Indian economy before Covid-19
A key feature of India’s economic growth performance after 1947 was that its economic growth averaged about 3% per annum. The economy moved up from this average annual growth rate only by the 1980s; the economic growth rate in the 1980s averaged 5.6% per annum (Chandrasekhar and Ghosh, 2002). From 1991, India began liberalising its economy. Over the first decade of economic reforms -between 1992-1993 and 2002-2003- the rate of growth of the economy was 6.1%, which was only marginally higher than the growth rate for the 1980s (Reserve Bank of India, RBI, 2003).
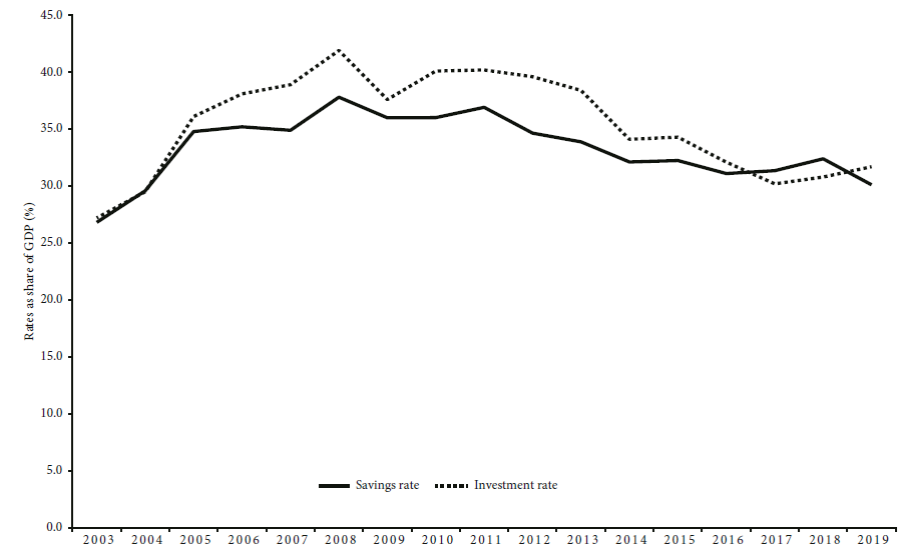
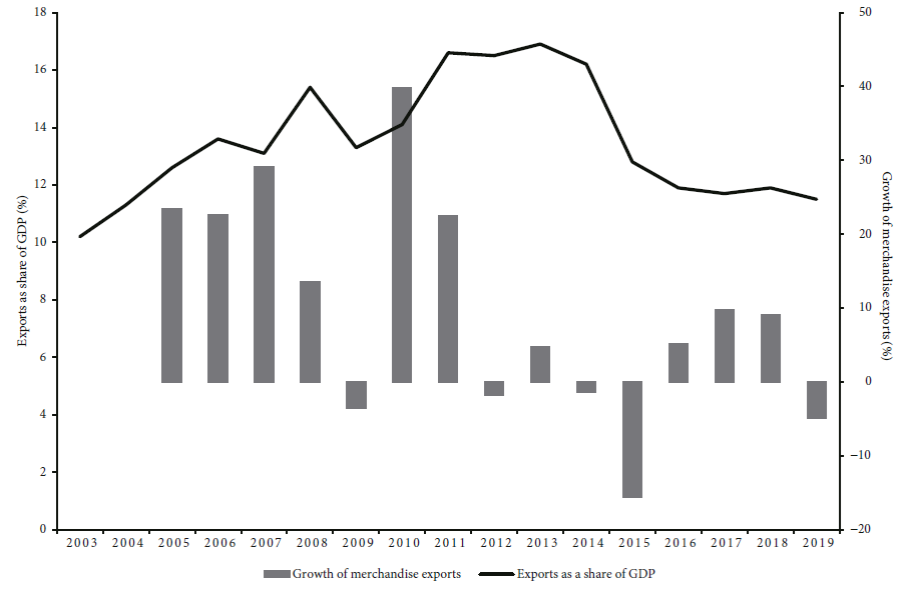
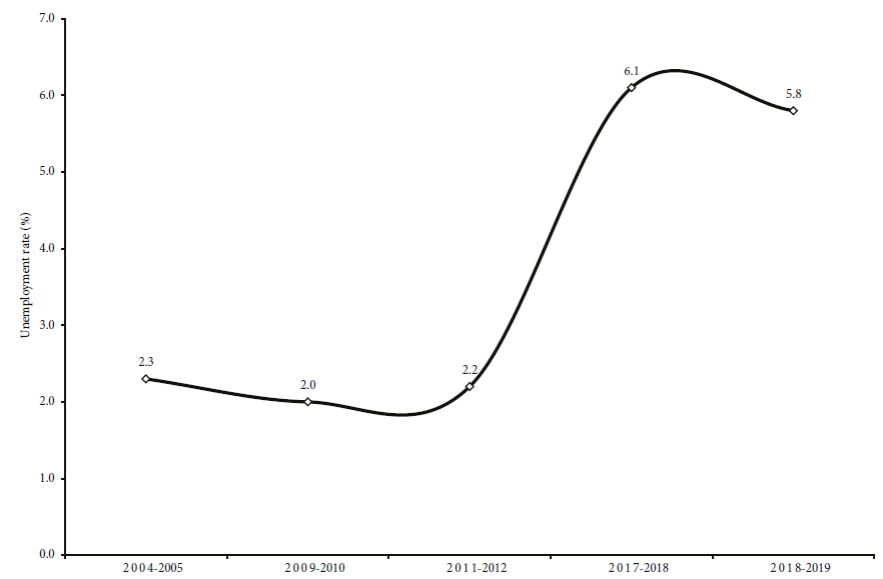
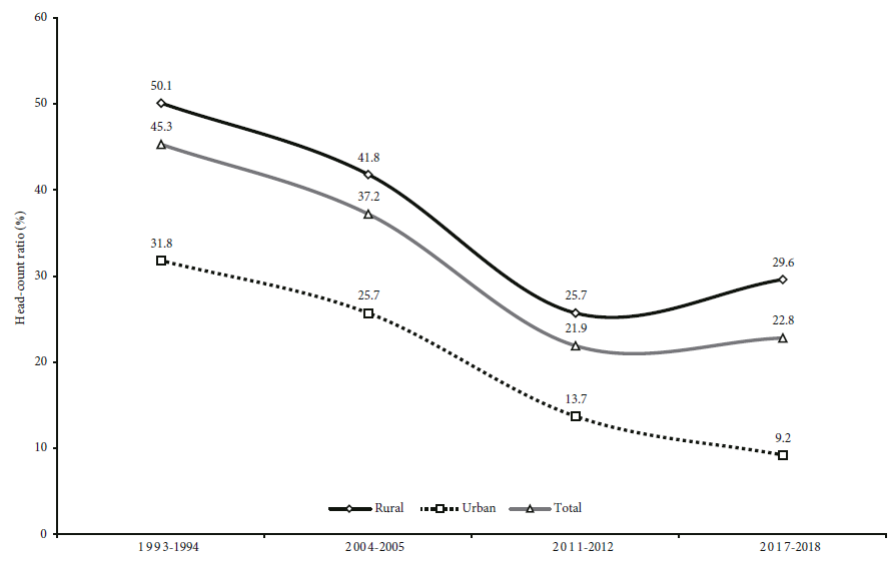
The next stage of growth in the economy began by 2002-2003 (see Figure 1). Due to a number of fortuitous international and national circumstances, and driven largely by a domestic credit boom, the economic growth rate (based on the base year of 2004-2005) rose to an average of 8% to 10% per quarter between 2003-2004 and 2011-2012, except in the midst of the global financial crisis (see also Nagaraj, 2013). This phase of growth was backed by a corresponding rise in an array of macroeconomic indicators: the investment rate, the savings rate, share of exports in Gross Domestic Product (GDP) and domestic bank credit (see Figures 2 through 4). These improvements in the macroeconomy were also reflected in the levels of living of people, even if only marginally. There was a decline in unemployment rates and the head-count ratios of income poverty (see Figures 5 and 6).

Source: CEIC Database. Available at: <https://www.ceicdata.com/en>.
Figure 1. Year-on-year growth rates of GVA at basic price, India, quarterly series, 2004-2005 and 2011-2012 base years (percentages)
Source: CEIC Database. Available at: <https://www.ceicdata.com/en>.
Figure 2. Investment rate and savings rate, India, annual, 2003-2019 (percentages of GDP)
Source: Centre for Monitoring Indian Economy (CMIE). Available at: <https://www.cmie.com/>.
Figure 3. Share of exports values in GDP and growth of merchandise exports, India, 2005-2006 to 2019-2020 (percentages)

Source: CEIC Database. Available at: <https://www.ceicdata.com/en>.
Figure 4. Monthly growth rates in domestic credit supply, India, 2004-2020 (percentages)
Source: NSSO: Reports & Publications, National Portal of India. Available at: <https://www.india.gov.in/nsso-reports-publications>.
Figure 5. Unemployment rates, India, 2004-2005 to 2018-2019, principal plus subsidiary status (percentages)
Source: Parliament of India, Lok Sabha (House of the People), Question 1418. Available at: <http://164.100.47.194/Loksabha/Questions/Qtextsearch.aspx>.
Figure 6. Head count ratios of income poverty, India, 1993-1994 to 2017-2018 (percentages)
These trends were reversed after 2011-2012. Official data show that the growth rate of Gross Value Added (GVA; based on the new base year of 2011-2012) continued to rise till the first quarter of 2016-2017 (see Figure 1). From the second quarter of 2016-2017, the growth rate of GVA began to fall. It fell from 9.3% in Q1 of 2016-2017 to 3.5% in Q3 of 2019-2020 and 3% in Q4 of 2019-2020. One of the proximate triggers for this decline was the ill-conceived demonetisation of Rs 500 and Rs 1,000 notes in November 2016, which sucked out about 86% of the cash in the economy in just a few hours (Ramakumar, 2017).
At the same time, many economists have questioned the veracity of the growth of GVA between 2011-2012 and 2016-2017. This was because the macroeconomic indicators universally associated with a rise in economic growth -investment rate, savings rate, share of exports in the GDP and the growth of domestic bank credit- had begun to decline after 2011-2012 itself (see Figures 2 through 4). The slowdown in the major macroeconomic indicators after 2011-2012 also had a direct impact on the lives of people. There was a rise in the level of unemployment and a rise in the head-count ratio of income poverty between 2011-2012 and 2017-2018 (see Figures 5 and 6).
In summary, the Indian economy was slowing down gradually after 2011-2012, and slowing down at a faster rate after 2016-2017. Thus, when the pandemic struck, the Indian economy was already in a vulnerable state.
Though the presence of a slowdown after 2011-2012 was unmistakable, the Union government consistently refused to adopt a counter-cyclical fiscal policy. As Figure 7 shows, the ratio of central government’s expenditure to the GDP fell between 2011-2012 and 2018-2019. Throughout this period, the government remained wedded to the ideological orthodoxy of fiscal consolidation. Fiscal deficit turned into a holy cow; any rise in fiscal deficit, it was argued, would scare away foreign investors (Patnaik, 2019). The fall of public expenditure was also an indicator of the increasing withdrawal of the state from economic activities under the neoliberal policy regime.

Source: RBI (2020).
Figure 7. Central government expenditure as share of GDP, India, 2004-2020 (percentages)
2.2. Lockdown and the economy: Nature of impacts
India imposed a national lockdown from 25 March 2020, which crippled economic activities across States. The resultant demand and supply shocks reverberated across the productive sectors of the economy.
2.3. Agriculture
The lockdown started when the harvest of India’s second agricultural crop season (rabi) had begun. Farmers were expecting good returns from the sale of their produce. But they were disappointed by the breakdown of global and domestic food supply chains and falling farm-gate prices. Globally, the demand for Indian agricultural commodities fell due to the shutdown of international trade. Domestically, farmers struggled to bring their produce to the market yards due to the poor availability of transport facilities and restrictions on the movement of goods.
The broken supply chains drastically reduced market arrivals of agricultural goods in India. Table 1 provides data on the total market arrivals of 15 commodities between March and September for two years, 2019 and 2020. For the period examined, market arrivals of all crops were lower in 2020 than in 2019. It was only in paddy, lentil, tomato, cabbage, lady’s finger, and banana that market arrivals in 2020 constituted more than 75% of market arrivals in 2019. In the case of wheat, barley, pigeon pea, potato, and cauliflower, market arrivals in 2020 were between 50 and 75% of market arrivals in 2019. For all the remaining crops, market arrivals in 2020 were less than half of the market arrivals in 2019. In wheat, the most important rabi crop, only 60.4% of the arrivals in 2019 were recorded in 2020. Thus, farmers across the country suffered major economic losses (see Ramakumar, 2020 for a detailed analysis).
Table 1. Total arrivals in the agricultural markets between March and September, selected crops, India, 2019 and 2020 (tonne and percentages)
| Crop | Cumulative quantity of market arrivals for specified periods in 2020 as a share of corresponding quantity of market arrivals in 2019 (%) | ||
|---|---|---|---|
| March to September | March to June | July to September | |
| Paddy | 87.2 | 88.1 | 86.2 |
| Wheat | 60.4 | 57.7 | 62.6 |
| Barley | 51.6 | 43.6 | 58.8 |
| Gram | 39.7 | 34.8 | 43.7 |
| Pigeon pea | 60.6 | 62.5 | 58.8 |
| Lentil | 76.5 | 79.1 | 74.4 |
| Potato | 60.6 | 64.3 | 57.7 |
| Tomato | 86.2 | 84.6 | 87.3 |
| Onion | 46.8 | 47.0 | 46.6 |
| Cabbage | 82.1 | 86.3 | 78.6 |
| Cauliflower | 73.4 | 77.1 | 69.9 |
| Peas | 39.4 | 39.2 | 39.6 |
| Lady’s finger | 75.1 | 75.2 | 75.1 |
| Banana | 86.9 | 89.4 | 85.3 |
| Mango | 46.8 | 35.1 | 51.6 |
Source: Computed from the CMIE commodities database. Available at: <https://www.cmie.com/>.
2.4. Animal husbandry
During the lockdown, many regular consumers of milk, such as sweet shops, restaurants, and hotels were shut. The demand for milk fell by 20-25 per cent during the lockdown (GoI, 2020). Milk sales declined, and milk dairies announced milk holidays. Milk prices declined by 19% between February and May 2020. Liquid milk procurement from farmers fell from 53.42 million litres per day (mlpd) in the first two weeks of March 2020 to 50.39 mlpd by the last two weeks of May 2020 (Ramakumar, 2020). The sale of milk also declined from 38.69 mlpd in the first half of March 2020 to 34.75 mlpd by the last two weeks of May 2020.
India is the second largest exporter of beef in the world, after Brazil. It exports about 100,000 tonnes of buffalo meat every month, but exports in March 2020 itself were estimated to have fallen to 40,000 tonnes. Between April and August of 2020, the exports of all meat and meat products was lower by US$ 336.4 compared to the corresponding period in 2019. Domestically, on the demand side, there was a sharp fall in meat sales; people began to believe that eating meat would lead to Covid-19 infections. Supply also fell. Sufficient animals could not be transported from the source areas to the large abattoirs. Many abattoirs closed down.
Poultry producers were also adversely affected. Broiler birds, whose life span is about 30 to 40 days, began to pile up in the farms and growers were forced to keep feeding them with purchased poultry feed. As a result, birds were culled on a large scale. As broiler birds grew in size and numbers, and as their markets shrank, growers incurred considerable financial losses. It is estimated that about 40% of the poultry producers closed down business. Chicken prices at the farm gate fell from Rs 85-90/kg to Rs 5-10/kg during the lockdown. According to the All India Poultry Breeders Association, the total loss for the poultry industry was likely to be US$ 3,333 million.
2.5. Industry
India’s Index of Industrial Production (IIP), which stood at 134.2 in February 2020, fell to just 54.0 in April 2020 (see Figure 8). While it rose after April till July 2020, it fell again in August 2020 and continued to be considerably below the levels for February 2020 or August 2019.

Source: Ministry of Statistics and Programme Implementation, Government of India. Available at: <http://www.mospi.gov.in/>.
Figure 8. Index of Industrial Production, India, monthly, 2019 and 2020, base year 2011-2012=100
In a survey by the Federation of Indian Chambers of Commerce and Industry (FICCI) in March 2020, about 53% of the businesses had responded that the impact on them was either “very high” or “high” (FICCI, 2020). About 73% of the businesses experienced a “big” reduction in orders; 35% reported a rise in inventories; and 81% reported a “significant” impact on cash flows. About 52% indicated that the delay in sourcing products was more than four weeks.
About 40% of India’s total non-farm work force is engaged in micro, small and medium enterprises (MSMEs). It is estimated that about 60 million MSMEs employ about 110 million workers (GAME, 2020). It was in the MSME sector that the impact of the lockdown was most severe. The total losses in this sector are estimated to be about US$ 10,667 million to US$ 16,000 million in profits (ibid.).
Another survey of MSMEs by the FICCI in April 2020 showed that about 73% of the MSMEs reported a drop in orders (Global Alliance for Mass Entrepreneurship, GAME, 2020). About 50% of the MSMEs reported a rise in inventory levels by more than 15%. Another survey by the All India Manufacturers’ Organisation (AIMO) in May 2020 covered 46,525 companies (AIMO 2020). It showed that about 35% of the MSMEs reported their future as “beyond recovery”; they had “no chance of recovery” and had begun “shutting down their operations”. Another 39% reported their recovery to be at least six months away. Yet another survey in July 2020 by the GAME and the Krea University, covering 1500 micro-enterprises, showed that 57% of the micro-enterprises had no cash reserves, and 65% of them had to access finances from personal savings to continue operations (GAME, 2020).
2.6. Other economic indicators
We shall now discuss three other indirect indicators of economic activity. First, there was a fall by one-third in the total Goods and Services Tax (GST) collections in India between February and April 2020 (see Figure 9). The cumulative shortfall of GST collections between March and October 2020 was US$ 20,251 million compared to March-October 2019. This shortfall was about 19% of the GST collections between March and October 2019.

Source: CMIE. Available at: <https://www.cmie.com/>.
Figure 9. Total collection of GST, India, monthly, nominal figures, 2019 and 2020 (Rs million)
Secondly, the total quantity of revenue-earning freight moved by the Indian Railways was lower in 2020 compared to 2019 (see Figure 10). If we consider the period between March to September 2020, the cumulative freight movement was lower by 69,770 tonnes (or about 10%) than between March and September 2019.

Source: CMIE. Available at: <https://www.cmie.com/>.
Figure 10. Revenue earning freight traffic of major commodities through Indian Railways, monthly, 2019 and 2020 (‘000 tonnes)
Thirdly, India’s exports fell after February 2020 (see Figure 11). The value of exports fell from $27,742 million in February 2020 to $10,153 million by April 2020 before improving to $27,585 million by September 2020. But if we consider the period between March and September 2020, the cumulative value of exports was lower by $45,191 million (or about 24%) compared to March-September 2019.
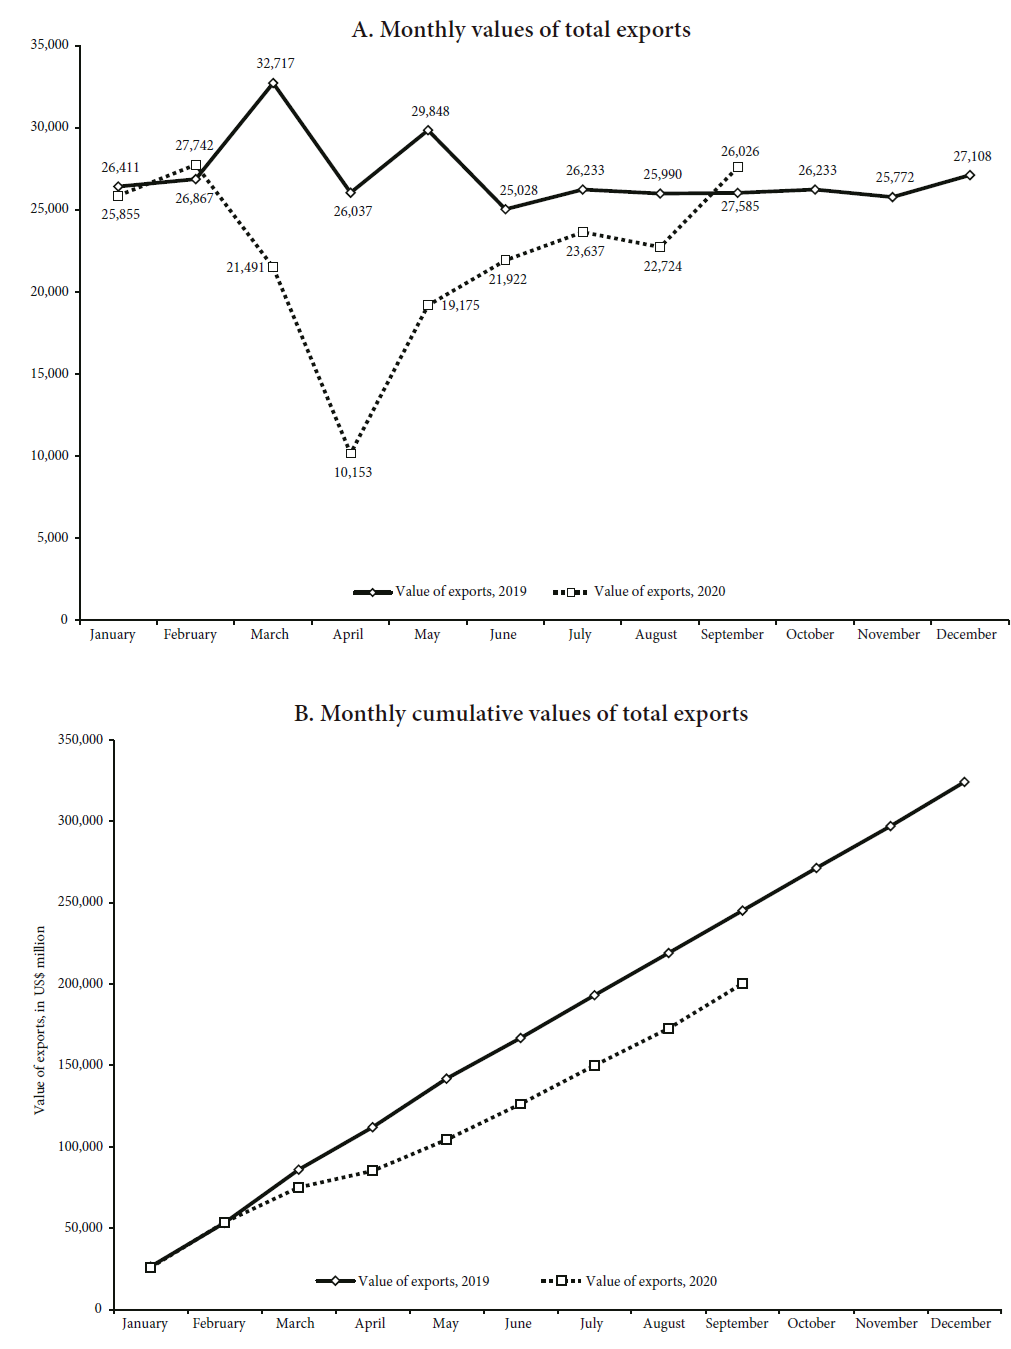
Source: CMIE. Available at: <https://www.cmie.com/>.
Figure 11. Monthly value of total exports, India, 2019 and 2020 (US$ million)
Spokespersons of the government have chosen to celebrate the higher year-on-year numbers in GST collection, freight traffic and exports in September and October 2020 as a sign of a major revival in the Indian economy. We feel that this may be a premature assessment. In all likelihood, the higher numbers in September-October are a reflection of the pent-up demand among certain sections of the society, particularly given the easing of the lockdown after August. Once the pent-up demand is exhausted, it is very likely that economic activities will show sign of stress again.
2.7. Impact on employment
The economic shutdown after March 2020 led to a major rise in unemployment. Here, we use monthly data from the nation-wide employment surveys of the CMIE. First, seekers of employment exited the labour force in large numbers in March and April 2020 (see Table 2). The size of the labour force shrank in March and April 2020. There was some recovery from May 2020, but the total size of the labour force in October 2020 was still lower than in February 2020 by 13.2 million persons.
Table 2. Selected indicators of labour force and employment, India, February to October 2020 (million and percentages)
| Variable | February 2020 | March 2020 | April 2020 | May 2020 | June 2020 | July 2020 | August 2020 | September 2020 | October 2020 |
|---|---|---|---|---|---|---|---|---|---|
| Labour force (million) | 440.1 | 433.8 | 369.0 | 396.5 | 420.0 | 424.3 | 428.3 | 426.0 | 426.9 |
| Labour participation rate (%) | 42.6 | 41.9 | 35.6 | 38.2 | 40.3 | 40.7 | 40.9 | 40.6 | 40.6 |
| Employed persons (million) | 406.0 | 395.8 | 282.2 | 303.4 | 373.8 | 392.7 | 392.5 | 397.6 | 397.1 |
| Unemployed persons actively looking for employment (million) | 34.2 | 37.9 | 86.8 | 93.1 | 46.2 | 31.5 | 35.7 | 28.3 | 29.8 |
| Unemployed persons not actively looking for employment (million) | 10.4 | 16.3 | 88.6 | 50.0 | 31.8 | 15.5 | 13.0 | 11.9 | 22.6 |
| Unemployment rate (%) | 7.8 | 8.8 | 23.5 | 23.5 | 10.9 | 7.4 | 8.4 | 6.7 | 7.0 |
| Unemployment rate for Scheduled Caste groups (%) | 7.2 | 9.4 | 32.0 | 30.6 | 14.6 | 8.8 | 8.5 | 6.7 | 7.7 |
| Unemployment rate for Scheduled Tribe groups (%) | 6.4 | 4.4 | 18.7 | 23.2 | 7.8 | 3.3 | 4.5 | 5.1 | 4.7 |
Source: CMIE. Available at: <https://www.cmie.com/>.
Secondly, the total number of employed persons shrank at a faster rate than the labour force. There was a fall of employed persons by 2.5% in March 2020 and 29% in April 2020. Despite recovery after May 2020, the number of employed persons were less by 8.9 million in October 2020 compared to February 2020.
Thirdly, there appears to be a strong “discouraged worker effect” among the labour force. The number of unemployed persons not looking for employment rose eight times between February 2020 and April 2020. It fell back to 13 million by August 2020 but rose again to 22.6 million by October 2020 (or 11 million more than in February 2020).
Fourthly, unemployment rose significantly. The monthly unemployment rate, which hovered around 7.8% in February 2020, rose to 23.5% in April and May 2020 before falling back to 7% by October 2020. However, this is no reflection of the reality, as large number of workers exited, and still remained out of the labour force in October 2020. The impact of unemployment was most severe on the historically disadvantaged and oppressed sections of India’s society: Scheduled Caste (SC) and Scheduled Tribe (ST) persons.
Fifthly, the impact on employment was not limited to the informal sector, but also the formal sector. The total number of salaried jobs in India was 86.1 million in 2019-2020 (Vyas, 2020a). In April 2020, this number fell to 68.4 million. By August 2020, it had risen to 73.8 million, but was still 12.7 million less than in February 2020.
Finally, young job seekers, particularly between 15 and 39 years, were the most acutely hit (Vyas, 2020b). Persons in the age group of 20-24 years constituted only 9% of the total employment but accounted for 35% of the total employment losses. Persons in the age group of 25-29 years were only 11% of the total employment but accounted for 46% of all the job losses.
3. Quantification of the economic impact
In this section, we attempt an exercise to quantify the direct and indirect losses to the Indian economy on account of the pandemic.
3.1. Input-Output analysis: A methodological departure
Many multilateral agencies have used either prevailing economic models or sector-wise estimates to arrive at the direct economic losses due to the lockdown in India. We provide a list of such estimates for the Indian economy in Table 3 (an exception is Asian Development Bank, ADB, 2020). But the Covid-19 lockdown did not just directly disrupt production in each sector, but also indirectly affected other sectors either because of an impact on inter-sectoral demand for inputs or due to slowdown in final demand due to reduced incomes and employment. In this paper, we depart from such traditional methods, and present estimates of economic losses based on an Input-Output (I-O) analysis. The I-O analysis includes direct and indirect impacts due to multiplier effects in each sector resulting from changes in other sectors.
Table 3. Forecasts for real GDP growth, India, 2020-2021 (percentages)
| Agency/Institution | Month of release | 2020-2021 |
|---|---|---|
| Centre for Monitoring Indian Economy (CMIE) | October | -12.3 |
| Reserve Bank of India (RBI) | October | -9.5 |
| RBI forecasters survey (Median) | October | -9.1 |
| Ministry of Finance | September | - |
| International Monetary Fund (IMF) | October | -10.3 |
| World Bank | October | -9.6 |
| Asian Development Bank (ADB) | September | -9.0 |
| Organisation for Economic Co-operation and Development (OECD) | September | -10.3 |
| United Nations Conference on Trade and Development (UNCTAD) [calendar year 2020 and 2021] | September | -5.9 |
| State Bank of India (SBI) | September | -10.9 |
| S&P Global Ratings | September | -9.0 |
| Fitch Ratings | September | -10.5 |
| Moody’s | September | -11.5 |
| ICRA | September | -11.0 |
| CRISIL | September | -9.0 |
| CARE Rating | September | -8.0 to -8.2 |
| India Ratings | September | -11.8 |
| Goldman Sachs | September | -14.8 |
| Nomura | September | -10.8 |
| UBS Securities | September | -8.6 |
Source: Swamy (2020).
The common criticisms directed at I-O models are three: 1) the technical coefficients that determine inter-sectoral dependence remain constant over time; 2) the analysis assumes constant returns to scale; and 3) the elasticity of substitution for all inputs is zero. It is argued that the above three characteristics of I-O models are deviations from the actual behaviour of the economy. While these criticisms are valid to an extent, they apply mainly to analyses that attempt forecasting of future economic behaviour. Further, this paper does not attempt to forecast economic activity into the future. The only time dependent analysis that we attempt is the estimation of an I-O table for 2019-2020 and 2020-2021 based on the coefficients for the years 2016-2017. The period of forecast here is relatively short. While all the coefficients may not hold, it is reasonable to assume that the variation may be relatively small.
There is a reason why we rely on an I-O table for 2016-2017. An I-O table for 2019-2020 is not available. The last official I-O table published by the Government of India is for 2007-2008. At the same time, an I-O table for India for 2016-2017 has been published by the Asian Development Bank. The ADB’s is a 34 sector I-O table closed with accounts for private consumption, government consumption, exports, imports, capital accumulation and savings, value added and indirect taxes. Using this table, we estimate the loss in economic output across different sectors of the Indian economy for 2019-20 and 2020-21.
The method used in this paper has previously been used in studies that estimated economic losses due to natural disasters. Yasuhide Okuyama has a series of papers on the use of this method for assessing losses due to natural disasters (see Okuyama and Santos, 2014; Okuyama, 2007; Okuyama, Hewings, and Sonis, 2004). I-O models have also more recently been used to assess the impacts of Covid-19 in specific sectors. For example, Baldwin and Tomiura (2020) applied the I-O method to assess the impact of Covid-19 on international trade. The ADB has evaluated the economic impact of Covid-19 on developing Asian economies (ADB, 2020). The method used in this paper broadly follows Okuyama and Santos (2014).
3.2. Our method
We begin with the I-O Table for India for 2016-2017. From this table, the matrix of technical coefficients [A] was calculated using Equation [1]. The Leontief matrix [L] was then calculated using Equation [2].
where Z is the matrix of intermediate consumption by each
sector, which represents the distribution of an industry’s output across
different sectors of the economy; x is the vector of total outputs
from each sector; and
A pro-rata growth rate for the final demand in each sector was then applied to derive the actual final demand for 2019-2020, and the expected final demand for 2020-2021. This gave us the final demand vectors [f 2019-2020] and [f 2020-2021]. The growth rate in final demand was assumed and adjusted such that the expected GVA for the two years, without Covid-19, matched the projections made by the Government of India. The I-O coefficients represented by the matrix [A], and the wages-to-profit ratio, were assumed to be constant over this period. Applying the standard Leontief equation, i.e., x = L × f, to the two demand vectors [f] for 2019-2020 and 2020-2021, we obtained x 2019-2020 and x 2020-2021. We could therefore calculate Z2019-2020, Z2020-2021, GVA 2019-2020, GVA 2020-2021, and then create I-O tables for 2019-2020 and 2020-2021 assuming that these were normal years without Covid-19.
The next step was to estimate the impact of Covid-19 on economic activity and the total potential losses. At the outset, we must state a few limitations of the exercise. First, it was difficult to estimate the exact value of loss as the economic situation is evolving and changing rapidly. Secondly, because the output varies across the year and the quarter in which economic activity is halted will affect the total loss estimations, a sub-annual analysis was difficult to do; quarterly I-O tables and output estimates are not available. Thirdly, the unprecedented scale and impact of Covid-19 is likely to result in changes in structural inter-dependencies in the economy represented in the I-O table. In such a dynamic context, it was difficult to arrive at very precise estimates. Fourthly, the I-O table fails to capture all the information about the informal sector, which plays a significant role in the Indian economy. Due to all these reasons, the estimates of economic loss that we present here should be considered conservative estimates. The scenarios we construct address this uncertainty by providing a wide range of possibilities.
We constructed four scenarios based on a range of potential lockdown days for each sector in the economy. The loss per day was calculated as the ratio of total potential economic output in a normal year for each sector and the number of days in the year. The product of the lockdown days and potential output per day gave us the total output loss in each sector i represented by the vector [Δxi]. The standard linear I-O analysis using the Leontief matrix required a change in the final demand [Δf]. Therefore, the change in output was converted to a change in final demand by dividing the total output vector [Δx2020] by the diagonal of the square matrix [L], as shown in Equation [3]. This methodology is discussed in detail in Miller and Blair (2009). The direct impact of a loss of output on final demand was captured by the diagonal elements of the matrix [L].
The resultant vector [Δf] is the corresponding loss in final demand. The total potential output loss as well as the reduction in final demand was then estimated for 2019-2020 and 2020-2021. The new final demand vectors [f CV ] were estimated by subtracting [Δf] from [f]2. New row vectors [X CV ], square matrices [Z CV ], and column vectors [GVA CV ] were calculated and new I-O CV tables were constructed for both years to reflect the system of economic transactions after Covid-19.
3.3. Our estimates
We construct four scenarios by varying the potential down-time for each sector across the economy. Table 4 shows the average down-time across all sectors of the economy, and the resulting loss in GVA for each scenario in 2019-2020 and 2020-2021. While the first Covid-19 case in India was registered on 30 January 2020, the pandemic truly arrived on Indian shores only by March 2020. Therefore, the workdays lost in 2019-2020 are likely to be relatively less. Our sector-wise assumptions about lockdown periods are broadly based on Government of India’s official notifications on the classification of which goods and services were “essential”, and the respective rules applicable to these sectors at different points in the five months between 24 March 2020 and 30 August 2020.
Table 4. Projected losses in GVA due to Covid-19 lockdown, India
| Scenario | 2019-2020 | 2020-2021 | ||||
|---|---|---|---|---|---|---|
| Average lockdown period* (days) | Direct + Indirect loss compared to the expected loss in the year: I-O analysis (%) | Growth Rate in real GDP with respect to GDP in the previous year (%) | Average lockdown period* (days) | Direct + Indirect loss compared to the expected loss in the year: I-O analysis (%) | Growth Rate in real GDP with respect to GDP in the previous year (%) | |
| Scenario 1 | 5 | 2.3 | 6.2 | 31 | 11.9 | -6.0 |
| Scenario 2 | 7 | 2.9 | 5.6 | 40 | 16.1 | -10.5 |
| Scenario 3 | 9 | 3.4 | 5.0 | 53 | 20.4 | -15.1 |
| Scenario 4 | 9 | 3.4 | 5.0 | 70 | 26.3 | -21.4 |
Note: * These are averages across all sectors.
Source: Computed by authors.
The results show that India’s economic losses in 2019-2020 itself range from 2% to 3% of the expected GVA if indirect impacts are also considered. In 2020-2021, the losses are considerably higher. The total direct and indirect losses due to the pandemic in 2020-2021 range from 12% to 26% of the expected GVA without the pandemic. This results in an actual negative growth rate in the GDP that ranges from -6% to -21%. On 31 August 2020, the CSO (Central Statistics Office) published its first estimate of the growth of GVA and GDP for Q1 (April-June) of 2020-2021. It estimated that Q1 growth rate of GVA was -22.8% and of GDP was -23.9%. The growth estimates for Q2 were also likely to be negative. It is likely, therefore, that the losses would be much higher than those estimated by other agencies (see Table 3). In our assessment, the annual growth rate for 2020-2021 is likely to be between scenarios 3 and 4 (see Table 4).
4. The government’s economic response
Given the economic losses, firm closures, and losses in employment, it would be wrong to assume that the economic activities would return to normal when the lockdown is lifted. When the lockdown is lifted, supply chain disruptions would ease even if supply may normalise only with a lag. Here, the extent to which production would be restored depends also on the extent of firm survival and the success of credit and liquidity injection measures. On the other hand, losses in employment are a huge drain of aggregate demand in the economy. Employment levels may not reach February 2020 levels anytime soon in 2020-2021. Even if levels of employment are restored, they are still likely to be of less-skilled and less-paid forms. In such a circumstance, stimulus measures by governments would have to play a central role in reviving demand.
Governments in the developed world have stepped in with unprecedented levels of intervention in the economy. These interventions have taken multiple forms. Compensations to farmers for economic losses, furlough packages to pay firms up to 80% of wage bills, direct cash payments to workers, injections of liquidity, provision of credit at zero interest rate or without collateral, free supply of food or food stamps and recapitalisation of banks are examples.
The IMF classifies interventions into two types: one, direct spending and revenue measures called “above-the-line measures”; two, loans, equity injections and guarantees called “below-the-line measures”. IMF’s estimate in October 2020 was that $11.7 trillion was the total size of the planned interventions of governments across the world. Of this, about half was to be through direct spending and revenue measures. The remaining half was to be through loans, liquidity support, equity injections and guarantees (IMF, 2020).
It is in this context that we study India’s economic response to the pandemic. India, till 30 October 2020, has announced a total of US$ 279,600 million as the Covid-19 economic stimulus package. This amounts to about 10% of India’s GDP, which makes the package appear impressive. However, we would add important qualifiers.
First, the appeal of the size of India’s stimulus package is deceptive. Many announcements made as part of the package were already included as part of the budget for 2020-2021 presented prior to the lockdown in February 2020. Of the US$ 279,600 million announced, only US$ 41,333 million constituted direct fiscal spending or exemptions. In other words, only 15.4% of the Indian package can be termed “above-the-line” measures, as opposed to about 50% globally (see Table 5). The rest constituted loans, credit guarantees and liquidity enhancement measures from the banking system. If we consider only above-the-line measures, the size of the India’s package would shrink to just 1.5% of the GDP. The corresponding figures were 9.3% of the GDP for advanced economies and 3.5% for emerging market and middle-income countries (IMF, 2020). Thus, India’s stimulus package was smaller than those announced by other major economies of the world.
Table 5. India’s Covid-19 economic stimulus package (percentages)
| Type of intervention | Details | Outlay as share of GDP | Share in total outlay |
|---|---|---|---|
| Above-the-line measures: direct spending and foregone/deferred revenue | Provision of in-kind (food; cooking gas) and in-cash transfers to lower income households; insurance coverage for workers in the healthcare sector; wage support and employment provision to low-wage workers. | 1.4 | 14.6 |
| Above-the-line measures: Improving health infrastructure | Increase number of hospital beds, ventilators, intensive care facilities and quarantine centres. | 0.1 | 0.8 |
| Below-the-line measures | To support businesses and shore up credit provision to several sectors of the economy and sections of the population. | 8.5 | 84.6 |
| All measures | 10.0 | 100.0 | |
| All above-the-line measures with direct bearing on the government budget/deficits | 1.5 | 15.4 | |
Source: Computed by authors from government documents and releases.
Secondly, the size of India’s package was also small relative to the stringency of its lockdown. The Oxford Covid-19 Government Response Tracker (OxCGRT) estimates a country-wise Stringency Index for lockdown based on 17 indicators, such as school closures and travel restrictions. The index ranges between 0 and 100 (100 for most stringent). More stringent the lockdown, larger is the expected size of the stimulus package. India had one of the most stringent lockdowns in the world. Yet, the size of India’s stimulus package was smaller than in countries with less stringent lockdowns (see Figure 12). In Japan, the package constituted 21.1% of the GDP. In Sweden, with one of the most relaxed lockdowns, the package constituted 12% of the GDP.
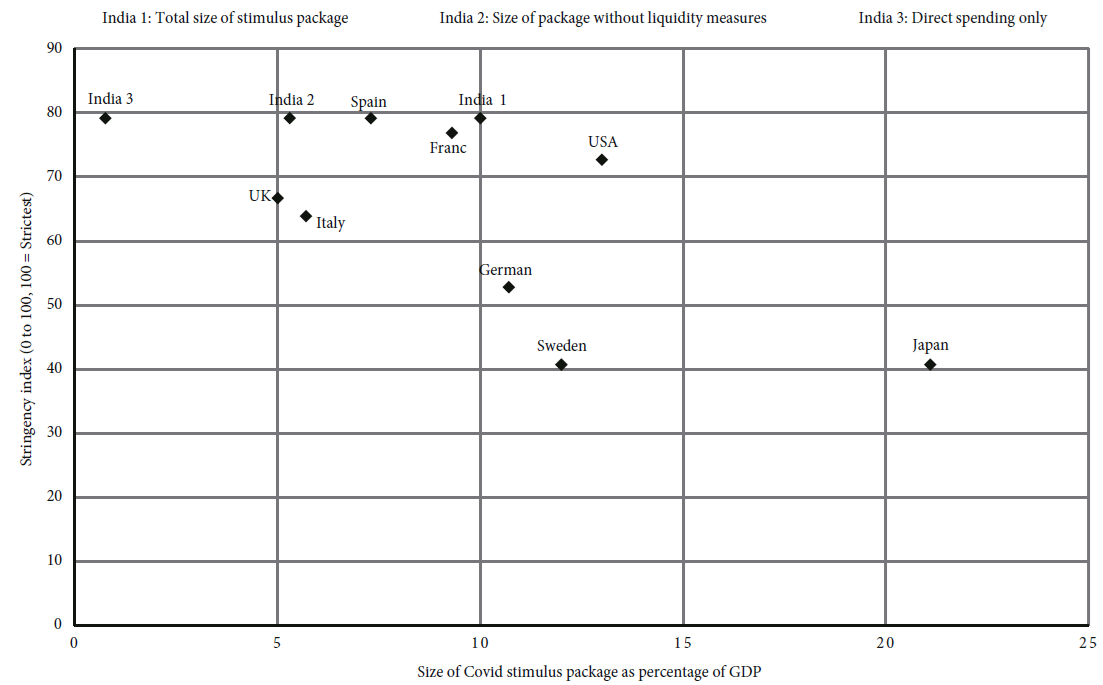
Note: India-1 is the total size of package; India-2 is the package after subtraction of liquidity injections measures; India-3 includes only direct spending measures.
Source: Compiled from official sources and OxCGRT.
Figure 12. Relationship between total size of Covid stimulus packages and the strictness of lockdowns, selected countries, 2020
Thirdly, even within the above-the-line measures, only a small share was aimed at raising aggregate demand or increasing capital investment in the economy. In fact, India’s package has been aptly called a supply-side package.
Fourthly, the overriding reliance in the package on fresh loans through the banking system, as well as moratorium on loan repayments, has raised fears about the long-term health of the banking system. India’s banks, even prior to the pandemic, were burdened with high levels of non-performing assets (NPA). There was no indication that forcing banks to provide fresh loans, with little attention to creditworthiness, would be associated with any measure to recapitalise banks. In the absence of recapitalisation, the long-term outlook of the banking system may be adverse.
5. Conclusions
This paper dealt with the impact of the Covid-19 pandemic on the Indian economy. The health crisis has been accompanied by an unprecedented economic crisis, where demand and supply have fallen autonomously and concurrently, even as they depress each other in feedback loops. The intensity of this crisis was exacerbated by the fact that the Indian economy was slowing down over a decade prior to the pandemic. As a result, India’s capacity to deal with the pandemic stood seriously diminished in March 2020.
The pandemic-induced economic crisis after March 2020 affected all economic sectors. In agriculture, farmers were faced with broken supply chains, lack of market outlets, poor demand and falling output prices. Our analysis of market arrivals of 15 agricultural commodities between March and September 2020 brought home this reality in the countryside. In industry, micro and small enterprises were the most acutely affected. Surveys showed that about 35% of all MSMEs were likely to shut down permanently. The crisis also led to a major loss of employment; at least 13 million people disappeared from the labour force between February and October 2020.
Using a I-O framework, this paper attempted an original assessment of the extent of direct and indirect losses to the Indian economy. Based on four scenarios of losses centered on workdays lost, we estimated that India’s GDP growth rate in 2020-2021 may range from -6% to -21%.
The government’s economic response till August 2020 was supply-centered, and seriously deficient on the demand side. The extent of short-run and long-run employment losses demanded that the package focussed on the generation of employment and raising aggregate demand. Yet, the financial allocation for employment generation was raised only marginally. In fact, on a year-on-year basis, the expenditure of the Union government declined by 0.6% between April and September 2020; the corresponding figure for April-September 2019 was +14.1%. The government was hesitant to expand budgetary spending because it feared a rise in fiscal deficit. Such fiscal conservatism is not new under India’s neoliberal regime. However, India has remained steadfast in its adherence to fiscal conservatism even as advanced capitalist economies have shed the dogma of austerity while responding to the pandemic. We believe this is illustrative of a certain ideological orthodoxy that marks the present right-wing dispensation in India. Given this conjuncture, the chances of an early revival in the Indian economy appear dismal.

