


 nueva página del texto (beta)
 Inglés (pdf)
 Artículo en XML
 Referencias del artículo
 Enviar artículo por email
 Citado por SciELO
  Similares en
SciELO
Similares en
SciELO 
 Permalink
1. Introduction
According to the Organisation for Economic Co-operation and Development (OECD), in recent years, the Mexican education system has attained significant achievements; the country significantly reduced dropout rates and reached almost universal coverage in primary schools. Despite these accomplishments, the educational system still bears many challenges. In 2000, Mexico started evaluating its educational achievement through the OECD’s Program for International Student Assessment (PISA). Since then, PISA evaluations have contextualized students’ outcomes in basic education and compared them to international standards. In 2018, Mexico’s educational outcomes came last among OECD members in the PISA results. As a result, the OECD has recognized that Mexico still faces significant challenges in education, and its attainments are still insufficient to perform well in a knowledge society (Bosco, 2011).
Inefficiency in educational outcomes may arise from the government’s lack of incentives to behave efficiently1. Some of these incentives are within the control of schools, but others are not. A series of factors that are out-of-control for primary schools and have an effect on their efficiency outcomes are well recognized in the literature. One of these factors is the competition among schools, which has been found to improve the technical efficiency of resources (García-Díaz, del Castillo, and Cabral, 2016; Grosskopf et al., 1997; Misra, Grimes, and Rogers, 2012). Other authors have found that the institutional frameworks -in the form of incentives- may be fundamental determinants of efficiency (Wößmann, 2007; Yoshikawa et al., 2007). Such evidence implies that the rules for rewarding teaching and learning, spending resources, and training, among other things, will influence the behavior of students, parents, teachers, principals, and administrators.
The state-level nature of the Mexican education system provides substantive institutional variations with different levels of efficiency. A wide range of decisions has been made at the state level since the early nineties when decentralization of the education system took place. As some states are more likely to lack the necessary expertise to allocate limited resources optimally, conducting evidence-based policy -and evaluating state performance- results crucial for improving efficiency in education.
The purpose of this paper is twofold: To measure technical efficiency and its determinants across public elementary schools in Mexico. To do so, we propose a two-stage estimation approach. In the first stage, we employ the stochastic frontier analysis to calculate elementary school’s technical efficiency score for each school. In the second stage, efficiency is regressed on school characteristics and environmental variables at the state level. The study covers 48,645 public elementary schools observed annually from 2009 to 2011. In addition, we also employ cross-sectional data for 2011 concerning different determinants of school efficiency across Mexican states. The period of analysis corresponds to the years when expenditure on education was less discretionary among Mexican states2. During this period, elementary schools were funded by the federal government through inter-government transfers, while state-level governments covered expenditure on infrastructure. Hence, it represents an optimal period to analyze the differences in efficiency levels across states3.
The main results of our analysis are as follows. In the first stage, we find that, after controlling for inefficiency, there is a positive relationship between inputs and outputs as other studies have found (Badri and Mourdad, 2012; Grosskopf et al., 2001). In the second stage, we find that primary schools have some inputs under their control that affects educational outcomes. Among them, the principal’s non-teaching load, infrastructure, teaching experience, and expenditure per student all have a significant positive effect on efficiency. Concerning state-level characteristics, we find that states’ spending on elementary school reduces efficiency. Moreover, average school grade has a positive influence on the efficiency of educational outcomes. We also found that there is a differentiated effect over efficiency across regions. Finally, we find that the presence of the most radical teacher’s union (Coordinadora Nacional de Trabajadores de la Educación, CNTE), adversely affects efficiency in educational outputs. This finding confirms that the fragmentation and regionalization of teachers’ demands negatively affect the efficient use of resources to attain better educational outputs. The main implication of these results is that it is not expenditure alone, but the way those resources are used that makes a difference in the efficiency of educational outcomes.
The paper proceeds as follows. In Section 2, a general description of elementary schools in Mexico is presented. Section 3 describes the two-stage process, explaining the stochastic frontier analysis to obtain schools’ technical efficiency scores and, then, the regression analysis to capture efficiency determinants across states. Section 4 describes the data sources and possible sample selection errors. Section 5 presents the estimation methodology and results. We conclude with a discussion of the main findings and their implications.
2. Elementary Schools in Mexico
In 2009 there were 14.8 million elementary school students in Mexico who attended 99,228 schools, of which 91.3% were public, and 8.7% were private (Secretaría de Educación Pública, SEP, 2010). Basic education consists of (i) pre-school education, which is optional, and covers the age span of 3 to 5 years; (ii) mandatory elementary education, with an official entry age of 6 to be completed in six years; and (iii) mandatory three-year secondary school. The three stages represent a total of 12 years of basic education, which is compulsory by law. In 1992, the decentralization of the basic education system from the federal to the state level was intensified in the Acuerdo Nacional para la Modernización de la Educación Básica. As a result, administrative responsibility for elementary school shifted to the states with oversight by the federal government through the vice-ministry for Basic Education. In 1998, the contribution fund for expenditure on basic education, FAEB (Fondo de Aportaciones para la Educación Básica y Normal), was created, establishing criteria for the allocation of public resources from the federal government to the states. It is relevant to note that decentralization did not imply that the federal government gave up its role in education. Instead, it meant that it transferred decision-making power to states but kept the supervision and regulation of the educational system (Villanueva Sánchez, 2010).
In 2004, Mexico’s federal government launched an integral basic education reform. The reform was based on the idea that education should serve to develop educational competence and focused on pre-school, primary, and secondary levels. Using this framework, they implemented measurements for educational achievements at the national level employing the standardized tests ENLACE (Evaluación Nacional de Logros Académicos en Centros Escolares) and increased the PISA international test coverage nationwide. In those results, between 70% and 79% of students are classified with insufficient outcomes in education. During this period, expenditures on education represented 17% of total public expenditure, the second-highest among OECD members. It represented 5.2% of Mexico’s GDP, which is the average among OECD members.
Nevertheless, the investment in educational infrastructure was quite low compared to other OECD members. In 2010, it also represented 2.6% of total public education expenditure. Most of these resources are spent through a quality schools program (PEC, Programa Escuelas de Calidad). This program focuses on public elementary schools and is funded through federal, state, and municipal resources. The matching grant program establishes that for every peso the state spends on education infrastructure, the Ministry of Education spends three pesos. Schools have administrative autonomy over these resources with the condition of spending at least 50% on didactic materials and equipment and the other 50% on school building improvement and maintenance. According to Acevedo (2001), the PEC program has had a small but positive effect on the reduction of failing rates (0.25%) and dropout rates (0.24%) among elementary schools. After its implementation, evaluations have concluded that this program has improved school administration and families’ involvement in schools’ development (Skoufias and Shapiro, 2006).
After years of analysis, well-documented cases, and a series of corrupt practices, in 2015, the FAEB was replaced by the federal government. In a new education system reform, the government proposed a new fund, the contribution fund for the education payroll and operating system, FONE (Fondo de Aportaciones para la Nómina Educativa y Gasto Operativo). In this fund, the federation takes back control of teachers’ payroll, which accounts for 91% of total expenditure in education. The FONE was introduced as a solution to the corruption problems detected in the use of the FAEB. However, as Fernández-Martínez (2018) points out, “the three-year results of its implementation have shown that the haste and political interests under which the re-structure of the teaching and administrative payroll was carried out, ended up costing the Federation more resources. A situation that reveals the existence of a series of inertias inherited from the FAEB, which they have not yet been able -or wanted- to eradicate”. Our analysis focuses on the period from 2009 to 2011. During those years, the elementary educational system was under higher state-level control, since the FAEB agreement was still ruling. Therefore, this period is ideal for assessing states’ influence on educational performance.
3. Methodology
The empirical analysis proposed consists of a two-stage econometric procedure. In the first stage, we estimate the school’s efficiency scores through stochastic frontier production analysis. In the second stage, we relate the efficiency scores to some state and local variables using pooled Ordinary Least Squares (OLS) regression techniques.
3.1. First stage: School level efficiency scores
To obtain the efficiency scores, we use the stochastic frontier production for panel data following Greene (2005) and Aigner, Lovell, and Schmidt (1977), the basic model can be expressed as:
Where yit denotes the production (ENLACE mean score) at the t-th observation (t = 1, 2, … T) for the i-th unit of production (i = 1, 2, … N). xit is a vector of known inputs of production and other explanatory variables associated with the i-th unit of production at the t-th observation. β′ is a vector of parameters to be estimated. The term μ′zi represents the observable heterogeneity (defined by a vector zi) of variables that are not related to production (inputs), but that capture the specific effects of every production unit. The term vit represents the error term for every production unit in every period. The term uit represents the technical efficiency of every unit of production in a given time, while the sign of s indicates if the model describes a production frontier (+1) or a cost function (-1). The composed error term proposed by Aigner, Lovell, and Schmidt (1977) is defined as the sum of the error term (vit) and the absolute value of the technical inefficiency (uit).
Where both terms follow the traditional assumptions on normality4.
From here, we are interested in the estimation of the technical inefficiency of every production unit. As the technical inefficiency is not directly observable, we use an estimated conditional technical inefficiency (uit) proposed by Jondrow et al. (1982)5. Then, the technical efficiency (TE) of every production unit (i) can be obtained by:
From [3], the term TEjlms can take values from 0 to 1. Where 0 corresponds to an utterly inefficient production unit and 1 to a fully efficient one. Thus, the closer the TEjlms to 1, the closer the production unit to become fully efficient. Using this calculation, we can produce efficiency rankings that allow us to compare the efficiency of production units across the sample.
3.2. Second stage: State-level factors associated with school efficiency
To further investigate the determinants that explain the differences in elementary school efficiency, the individual stochastic frontier efficiency scores are used in a regression analysis to examine the relationship between efficiency and other state and regional variables. Following previous studies (Agasisti, Barra, and Zotti, 2016; Grosskopf et al., 2001; Huguenin, 2015), efficiency scores are regressed over other variables in a model defined as:
Where uit is normally distributed with zero mean and constant variance. scoreit is the efficiency score for every school i, that we obtain from Equation [3]; wit is a vector of factors affecting technical efficiency of school i during the period t, beta is a vector of unknown parameters to be estimated, and uit is the random error term. The purpose is to identify the state-level determinants of school-level efficiency. This relationship is critical to define public policies whose purpose is to increase the efficiency of individual schools. Also, it results fundamental to support inefficient schools while recognizing a series of factors that are not under their control.
4. Data
We construct a panel data from public information sources, the Mexican Ministry of Public Education (Secretaría de Educación Publica, SEP) and from the National Population Council (Consejo Nacional de Población, CONAPO). We use the Sistema Integral de Información Escolar (SIIE) 2009-2011 education database, which covers elementary school characteristics6. For the outcomes in education, we use ENLACE test results (2010-2012). We employ the Censo de Escuelas, Maestros y Alumnos de Educación Básica y Especial (CEMABE) database, which is a census of schools with detailed information about teachers and schools in elementary education. We also use the urban marginalization index for each Áreas Geoestadísticas Básicas (AGEB) from the conapo.
State-level variables come from INEGI Mexico’s National Statistics (Instituto Nacional de Estadística y Geografía) and the Instituto Nacional para la Evaluación de la Educación (INEE).
Our final panel data consist of 48,645 public elementary schools observed annually during the period 2009-2011. All observations within the panel correspond to sixth grade, which is the last year of Mexican elementary school. We choose sixth grade because it provides insight into the final academic competencies developed through all elementary school years. The data have a typical panel data structure with many observations (N = 48,645) observed during short periods (T = 3), and a total of 145,935 observations (N × T). Our balanced panel data covered 49% of the total elementary schools in Mexico as 2012. It represents 58% of the total students in sixth grade and 61.9% of all schools evaluated by ENLACE standardized tests.
The panel data covers 30 Mexican states and excludes two of them: Oaxaca and Mexico City. In the case of Oaxaca, there was insufficient information available for the studied period since the prevalent teacher’s union in the state systematically boycotted ENLACE testing in public schools. The case of Mexico City was excluded considering that during the period of the study, basic public education funding was provided directly by the federal government. Therefore, considering the distinct budgetary constraints, Mexico City was not comparable to the rest of the states.
4.1. First stage variables (inputs and outcomes)
The estimation of the technical efficiency scores through the stochastic frontier analysis of the production approach requires the definition of the inputs that will be transformed into output.
4.1.1. Output measures
A significant part of the literature uses standardized test scores as a proxy of education outcomes. We used standardized ENLACE test results for Mathematics and Spanish subjects. The tests were administered to all students registered in the sixth grade of elementary school. The ENLACE results correspond to the average points obtained for each school in the test for each subject evaluated7. Table 1 presents the ENLACE test descriptive statistics for Spanish and Mathematics.
Table 1 Descriptive statistics
| mean | min | max | s.d. | |
| School-level variables | ||||
| ENLACE mean score Spanish (ENLACE) | 522.206 | 275.000 | 846.390 | 67.963 |
| ENLACE mean score Mathematics (ENLACE) | 534.482 | 269.000 | 918.410 | 82.867 |
| Expenditure per student (EXPENDITURE) | 2.533 | 0.027 | 38.302 | 2.329 |
| The ratio of teachers in a teaching program (TEACHER) | 0.390 | 0.000 | 3.000 | 0.342 |
| Principal without teaching load (PRINCIPAL) | 0.530 | 0.000 | 1.000 | 0.499 |
| The ratio of classrooms in use (OCCUPANCY) | 0.849 | 0.030 | 1.000 | 0.211 |
| Schools enrolled in program PEC (PEC) | 0.140 | 0.000 | 1.000 | 0.347 |
| The indigenous school (INDIGENOUS) | 0.067 | 0.000 | 1.000 | 0.251 |
| State-level variables | ||||
| Marginalization index (MARGINALIZATION) | 2.062 | 0.516 | 9.431 | 1.096 |
| Urban (URBAN) | 0.467 | 0.000 | 1.000 | 0.499 |
| Average expenditure on primary school (AVG_EXP) in million pesos | 2.578 | 0.000 | 6.061 | 0.990 |
| The ratio of capital expenditure to indigenous elementary schools (IND_EXP) | 0.007 | 0.007 | 0.007 | 0.000 |
| Percentage average school grade (GRADE) | 8.581 | 6.538 | 10.611 | 0.841 |
| The ratio of expenditure on primary schools to total state expenditure (STATE_EXP) | 0.014 | 0.000 | 0.025 | 0.004 |
Note: 1/ Normalized to 2010 prices
Source: Authors’ estimations from SIIE and CEMABE databases between 2009 and 2011.
4.1.2. Inputs measures
Expenditure (EXPENDITURE). In Mexico, there are no direct public indicators on the amount a school spends per student. However, using available information at the federal, state, and municipal levels, we constructed a proxy variable that reflects total expenditure per student. We employ the school location (urban or rural); the school categorization (general or indigenous); and the state-level averages of yearly elementary scholar spending (on teachers’ salaries, school infrastructure, current expenditure, etc.) to construct a proxy of public elementary school expenditure that incorporates variation across states, location, categorization, and funding source. Then, we divided the corresponding yearly school averages by the number of students enrolled in the school that year. As far as we know, this proxy is one of the most fine-grained measures of elementary expenditure per student for recent Mexican studies. The expected sign of the coefficient is positive, as the literature suggests that an increment in the school expenditure increases the school outcome in the standardized test (Mizala, Romaguera, and Farren, 2002).
The ratio of teachers in a training program (TEACHER). We have no precise data on teaching quality or experience, but we use a proxy variable for quality in teaching. The variable measures the proportion of working teachers enrolled in Programa Nacional de Carrera Magisterial (PNCM). Condition on taking part in training and accreditations, this program offers incentives (monetary and professional) so that teachers registered can accomplish teaching career promotions.
The proportion of classrooms in use (OCCUPANCY). This variable refers to school occupancy, for which we estimate the ratio of classrooms in use to the number of classrooms available. This ratio is an indicator of the school’s capacity to attract students. We expect that those that have high occupancy rates are more attractive than other schools with empty classrooms.
Schools enrolled in the quality schools program (PEC). The PEC program provides funds to improve scholar materials and infrastructure. As there is no available information related to infrastructure quality in schools, we use a dichotomous variable (PEC) to capture those schools that have enrollment during, at least, three consecutive years, as a proxy.
Principal without teaching load (PRINCIPAL). The characteristics of the school principal are relevant to the school’s outcomes (Masci, Witte, and Agasisti, 2018; Yoshikawa et al., 2007). Although there is no available information about the principal’s experience, we constructed a dichotomous variable that tells us if the principal is engaged full time in the school’s administration or she/he has other responsibilities, such as teaching courses. We expect that schools with a principal who devotes all her/his time to the school’s administration will do better in the standardized test compared to those schools where the principal has administrative and teaching responsibilities.
Urban schools (URBAN). Previous studies suggest that the schools’ location and level of urbanity significantly impact the academic performance through several channels (Sirin, 2005); perhaps the best-studied channel is the social capital (Coleman, 1988). The school location also affects the school’s capability to efficiently produce educational outcomes (Denaux, 2011; Misra, Grimes, and Rogers, 2012) through economies of scale. To control for this effect, we included a dichotomous variable (URBAN) that take the value of 1 if the school is located in an urban area8.
Marginalization index (MARGINALIZATION). The literature provides evidence favoring the claim that socioeconomically deprived schools negatively impact academic performance. Lipsey and Wilson (1993) meta-analysis reviewed more than 300 studies, concluding that both the family and school socio-economic context, show the highest correlations with academic performance. To control for the socio-economic context of the school, we use the deprivation index at the locality level (a less aggregated geographical feature than the municipality). The index is calculated by the conapo and takes values between -2 and 6 points9. The higher the value, the greater the deprivation and poverty in each locality.
4.2. Second stage variables
State-level variables correspond to the regional context in which schools develop. Social structure, different capabilities, and resources may all affect schools’ education outcomes. For instance, INEE (2006) suggests considering population dispersion, given that more than half of the schools in Mexico are located in just eight states. Along these lines, indigenous populations are also not equally distributed.
Other state variables that have a considerable impact on educational outcomes are the amount of own resources that states allocate to education, availability of public services, and economic context. In this study, the available variables included in our empirical model are the following:
a) The ratio of expenditure on the elementary school to total expenditure (STATE_EXP). Instructional spending affects outcomes in education. Hence, the way states allocate public spending in education is expected to have a positive impact on efficiency.
b) Average school expenditure variable (AVG_EXP) refers as well to the government expenditure, yet this is a level variable that captures the magnitude of resources allocated to education across states.
c) Average school grade (GRADE). The percentage of students with severe lagging in academic performance, when compared to the average at a certain age, denotes challenges in the school performance. The higher the average grade in each state, the more likely it is to get better educational outcomes. Hence, the expected sign of GRADE is positive.
d) The ratio of expenditure on indigenous elementary schools (IND_EXP). Indigenous schools usually mix students of different grades in one classroom, under the direction of one teacher. In rural Mexico, this is common not due to the lack of teachers but to the geographical location of schools and dispersion of the indigenous population in some cases (Weiss, 2000). Indigenous schools’ teaching programs are challenging to implement, and pedagogical methodologies may require a different approach (Thomas and Shawn, 1992). States that devote a high proportion to indigenous schools are facing a larger population of indigenous students, so the expected sign is negative.
Since most of the expenditure on education in Mexico is related to teachers’ wages, labor union representation is expected to be a relevant predictor of educational outcomes. According to Hecock (2006), labor union strength is not very useful in the Mexican context since membership is nearly universal among teachers in the National Syndicate of Education Workers (SNTE, Sindicato Nacional de Trabajadores de la Educación). However, there is another regional union that, arguably, has proven to be more radical in its demands to reform the educational system: The CNTE (Bocking, 2019). We have created a dummy variable that indicates if the CNTE has the majority of teachers’ affiliations in each state. We expect that those states with the presence of a more radical teacher’s union will negatively affect efficiency levels in educational outputs.
Regions (REGIONS). The students’ outcomes in education are positively associated with a wide range of economic, social, and demographic phenomena, including educational attainment, intellectual achievement, income, and socio-economic status. Studies have found different regional outcomes in education within nations, pointing to IQ differences just attributed to regional differences in prosperity (Lynn, Fuerst, and Kirkegaard, 2018). Ex-ante, we would expect wealthier regions to be more efficient in educational attainment. To account for regional differences, we use the same regionalization commonly used by the Mexican Central Bank10. Table 1 provides the definition of variables utilized and some basic descriptive statistics for all schools in the sample and all Mexican states from 2009-2011.
5. Results
5.1. Technical efficiency scores (first stage)
We estimate the production function for subjects in Spanish and Mathematics. ENLACE test scores (ENLACE) are identified as the output in the education production function. The scholar inputs we identify are both time-variant and time-invariant variables. In the context of stochastic frontier analysis, heteroscedasticity is usually a problem because of the bias in the inefficiency scores. Kirjavainen (2012) considers that panel data does not cause serious heteroscedasticity problems, but it must be modeled to obtain unbiased frontier estimators.
We use panel data to control for individual heterogeneity and to estimate the production function parameters in the most efficient manner. Following the Cobb-Douglas functional specification in Equations [1] and [2], we estimate the following production function with random effects:
This equation considers the temporal factor that characterizes panel data. The random effect method considers a compound error term of a traditional error u it and a random term that captures unobservable effects. We use the True Random Effects (tre) methodology proposed by Greene (2005), where inefficiency is time-variant. The heteroscedasticity of the term uit can be modeled incorporating exogenous factors in one stage, as Greene (2008) suggests. The characteristics of the industry (such as competition, technology, etc.) should help to model the inefficient technical term (uit), while other exogenous variables; over which the producer has little or no decision power (such as weather, geographic location, etc.) should help to model the traditional error term (vit). In our case, we use the school location (URBAN) and the marginalization index (MARGINALIZATION) to model the traditional error term. To control for the industry effect, we use the same concentration index for the market (HHI) employed by García-Díaz, del Castillo, and Cabral (2016).
In Equation [5], the term zi,p = HHI and zi,e = URBANi; MARGINALIZATIONi. In Table 2, we present the empirical results from our estimations using the tre panel data method for Spanish and Mathematics ENLACE test scores.
Table 2 True Random Effects (TRE) model for Spanish and Mathematics
| Spanish | Mathematics | |
| TRE | TRE | |
| Expenditure per student Ln(EXPENDITURE) | 0.009*** | -0.020*** |
| (0.001) | (0.003) | |
| Ln(TEACHER) | 0.004*** | 0.004*** |
| (0.000) | (0.000) | |
| Ln(OCCUPANCY) | 0.002 | 0.030*** |
| (0.002) | (0.002) | |
| Principal without teaching load | 0.036*** | 0.031*** |
| (0.003) | (0.002) | |
| Schools enrolled in program PEC (PEC) | 0.027*** | 0.038*** |
| (0.004) | (0.002) | |
| Indigenous school (INDIGENOUS) | -0.012*** | -0.065*** |
| (0.002) | (0.001) | |
| Constant | 6.402*** | 6.496*** |
| (0.003) | (0.003) | |
| sigma (u) | ||
| HHI | -4.505*** | -4.101*** |
| sigma (v) | ||
| Marginalization Index | -2.406*** | -2.521*** |
| (0.09) | (0.103) | |
| Urban | -4.992*** | -5.188*** |
| (0.213) | (0.212) | |
| Theta | ||
| Constant | 0.141*** | 0.176*** |
| (0.001) | (0.001) | |
| Log-Likelihood | 30,752.798 | 13,739.173 |
| Bayesian information criterion (bic) | -61,374.8 | -27,347.55 |
| Number of observations | 145,935 | 145,935 |
| Number of schools | 48,645 | 48,645 |
Notes: Robust standard errors in parentheses. Log-likelihood simulated for the tre model.
* Significant at a confidence level of 95%.
** Significant at a confidence level of 99%.
The coefficient for school EXPENDITURE is positive and significant for the case of Spanish and negative and significative for the case of Mathematics. The coefficient size is trivially small, suggesting expenditure in education is not one of the main drivers in school outcomes. We conjecture that school outcomes seem to be related to the way resources are used rather than an increase in resources. This idea reflects on the fact that Mexico increased expenditure per student by 14%, while changes in the PISA test were just marginal (OECD, 2012).
TEACHER, the proportion of students per teacher, is positive and significant. OPERATION is positive and significant, yet its value is low, which is a disappointing result as large amounts of resources are invested in this program. A possible explanation for this poor performance is given by Reyes (2011), who suggests that pervasive institutional arrangements by the teachers’ union play a crucial role in educational outcomes. He advocates that, presumably, PNCM is a program used by the teacher’s union as a political control mechanism and not to improve teaching quality.
Principal not teaching (PRINCIPAL) is positive and significant, suggesting that being devoted to an administrative role helps to organize resources and reach better outcomes. PEC program is positive and significant, suggesting that investment in infrastructure has a small but positive effect on ENLACE results. Being an indigenous school (INDIGENOUS) has a negative and significant impact on both subjects, which reflects the fact that indigenous schools have on average lower results than the rest.
The MARGINALIZATION and concentration indices (HHI) follow a different interpretation. The former variable is an external factor that allows us to model the variance within the normal term (v it ) and to correct for the elasticities in the stochastic frontier estimation. It is a linear relationship between the traditional error term variance and the MARGINALIZATION index. This relationship is negative and significant in both models. Higher levels of marginalization decrease the dispersion of the error term in the frontier. Meanwhile, being in an urban location, rather than a rural one, reduces the dispersion in the error term (v it ).
Finally, the concentration index, HHI, is negative and significant in both subjects suggesting that higher levels of concentration (less competition) decrease technical inefficiency dispersion. This result is different from others found in the literature (Bradley, Johnes, and Millington, 2001; García-Díaz, del Castillo, and Cabral, 2016; Millimet and Collier, 2008). The difference in this result comes from the school sample used in this analysis, as we only consider public schools. It seems that public schools do not compete as much to attract new students compared to private schools. Public schools look for students’ placements in different geographical areas rather than attributes that may make a difference and attract new students.
5.2. Efficiency score estimates
The principal objective of a stochastic frontier analysis is to obtain the efficiency scores of every producing unit in the analysis. We use Equation [3] to estimate the efficiency score for every elementary school in the sample. Table 3 presents the results for both subjects.
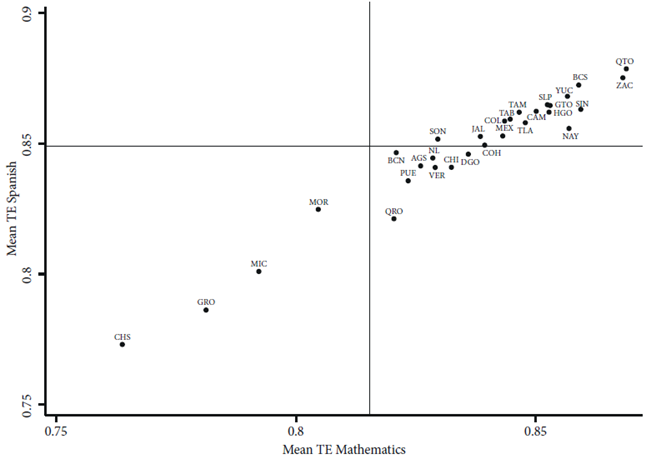
Table 3 shows that average efficiency scores between Mathematics and Spanish are not very different. Both measures present small standard deviations, which is consistent with other TRE models in the literature. Greene (2008) and Kirjavainen (2012) report that this model reduces the standard deviation of the efficiency scores. The former explains that this is due to the modeling of the heterogeneity of the stochastic frontier, since the inefficiency term (u it ) is purged from time-invariant individual effects. This specification is different from others in the literature. In Figure 1, we present a scatter plot of Mathematics efficiency scores in the horizontal axis and Spanish efficiency scores in the vertical one. The straight lines indicate the state-level average efficiency scores for each subject. We observe that the average efficiency score varies across states.
Table 3 Technical efficiency descriptive statistics
| Stochastic frontier model | ||||
| Panel A: Spanish | mean | min | max | s.d. |
| Time variant and exogenous factors (TRE) | 0.8489 | 0.7534 | 0.8871 | 0.0255 |
| Panel B: Mathematics | mean | min | max | s.d. |
| Time variant and exogenous factors (TRE) | 0.8155 | 0.6938 | 0.8689 | 0.0321 |
As we have seen in Table 3, the differences between Mathematics and Spanish are not substantial. We can identify states with high-efficiency scores in both subjects [e.g., Querétaro (QTO), Zacatecas (ZAC), Baja California (BCS) and Sinaloa (SIN)] in the upper right quadrant and states with lower efficiency scores in the bottom left quadrant [e.g., Michoacán (MIC), Guerrero (GRO) and Chiapas (CHS)]. A remarkable result is that the states in the upper right quadrant are not necessarily the wealthiest in the country, pointing to the difference in this analysis that it is not so much about access to more resources, but rather a more efficient use of them to reach better educational outputs. For a detailed description of Figure 1, the states’ acronyms and their regional classification can be consulted in Appendix 1.
5.3. Pooled panel regression analysis across states (second stage)
The states’ efficiency scores show that there is a regional context that may affect schools’ efficiency. To explain this, we need to consider the social composition and marginalization that prevails in certain regions. INEE (2006) points out that population dispersion in certain areas must be considered. Similarly, indigenous populations are not equally distributed across regions. For instance, the indigenous population represents 2% at the national level, while in some states, it represents between 25% to 30%. Thus, we estimate the elementary school efficiency score, at 6th grade, using the Mathematics and Spanish evaluations with data on state and regional variables, according to Equation [6]:
Equation [5], however, ignores the role of students’ characteristics and states’ contribution to education relative to other sources. Data available to measure this effect at the state level allow us to regress first stage efficiency scores for Mathematics and Spanish, SCOREit on the ratio of expenditure in elementary schools relative to public spending in the state, RATIO_EXPit, the average spending on elementary schools in the state, AVG_EXPit, the average IND_EXPit school grade in the state, GRADEit, the ratio of spending on indigenous elementary schools, and four geographical areas, REGIONSi, which measure the fraction of the elementary schools located at the (north) border, northern, central, and southern regions of the country, plus an error term.
This specification follows Agasisti, Barra, and Zotti (2016), Denaux (2011), Huguenin (2015) and Simmons and Alexander (1978), which assumes that changes in environmental variables at the state and regional level result in a parallel shift in the frontier. Other studies have shown that disadvantaged students perform below average. Thus, we anticipate that GRADE will shift the frontier up. On the other hand, coefficients in the state variables may affect the production function, just as the coefficient on the expending variables, yet differences in regions and indigenous demographic composition may affect the efficiency scores. Table 4 presents our results, including two different models of school state efficiency. Model 1 is a simple linear model including indigenous and regional variations in the analysis, and Model 2 explores the role of the CNTE teachers’ union in efficiency outcomes. Since CNTE plays a significant role in indigenous communities in Oaxaca, Chiapas, Guerrero, and Michoacán, the variable shows high multicollinearity with IND_EXPit, and with REGIONSi. Thus, we omit those variables from Model 2. Appendix 2 reports all the necessary tests to validate the models reported in Table 4.
Table 4 Pooled OLS state-level determinants
| Variables | Model 1 | Model 2 | ||
|---|---|---|---|---|
| Mathematics | Spanish | Mathematics | Spanish | |
| The ratio of expenditure in elementary schools to total public expenditure Ln(RATIO_EXP) | -0.209*** | -0.200*** | -0.037 | -0.192*** |
| (0.0700) | (0.0560) | (0.0860) | (0.0410) | |
| Average school expenditure Ln(AVG_EXP) | -0.020*** | -0.016*** | -0.022** | -0.014** |
| (0.0070) | (0.0060) | (0.0100) | (0.0060) | |
| Average school grade Ln(GRADE) | 0.127*** | 0.101** | 0.172*** | 0.036 |
| (0.0470) | (0.0420) | (0.0570) | (0.0340) | |
| The ratio of capital expenditure to indigenous elementary schools Ln(IND_EXP) | -2.797*** | -0.229 | ||
| (0.4040) | (0.3470) | |||
| Presence of the Coordinadora Nacional de Trabajadores de la Educación (CNTE) | -0.038** | -0.034*** | ||
| (0.0160) | (0.0120) | |||
| REGIONS (baseline states at the north border) | ||||
| North-Central | 0.029*** | 0.019*** | ||
| (0.0060) | (0.0050) | |||
| Center | 0.012* | 0.008 | ||
| (0.0070) | (0.0060) | |||
| South | -0.009 | -0.006 | ||
| (0.0080) | (0.0070) | |||
| Constant | 2.540*** | 0.051 | -0.578*** | -0.406*** |
| (0.4680) | (0.3980) | (0.1120) | (0.0710) | |
| Number of observations | 90 | 90 | 90 | 90 |
| R2 | 0.732 | 0.65 | 0.439 | 0.643 |
| Adjusted R2 | 0.71 | 0.62 | 0.413 | 0.626 |
| Residual Sum of Squares (RSS) | 0.039 | 0.03 | 0.082 | 0.03 |
Notes: Robust standard errors in parentheses. Log-likelihood.
* Significant at a confidence level of 95%.
** Significant at a confidence level of 99%.
In Model 1, the elasticities of our two test scores concerning RATIO_EXP -the ratio of expenditure on elementary schools to total public spending- is negative and significant at the 1% level for both subjects. An increase in the ratio of elementary school to total expenditure decreases efficiency by 21% for Mathematics and 20% for the case of Spanish. These results are in line with the average school expenditure, where a 1% increase in average spending decreases elementary school by 2% in Mathematics and 1.6% in Spanish. These results suggest that the amount of resources per se does not explain better efficiency outcomes in Mathematics and Spanish, but the composition of school demographics that elementary school faces does. For instance, average school grade in the state has a positive effect, an increase of 1% in average school grade increases efficiency by 13% in efficiency outcomes in Mathematics and nearly 10% in Spanish.
On the other hand, states that devote higher expenditures on indigenous elementary schools, due to a larger population density of indigenous students, have a significant decrease in efficiency in Mathematics. Hence, we interpret this result as evidence that focusing resources effectively on vulnerable indigenous populations poses a challenge to attain efficiency in educational outcomes.
Regions do matter, presumably due to changes in the demographic composition of families across states. Compared to the (north) border states, living in the northern region of the country enhances efficiency in the case of both Mathematics and Spanish. The central region of Mexico observes higher efficiency, but only the case of Mathematics. No such effect is observed in the southern region.
Model 2 explores the role of the CNTE regional labor union in the efficiency of educational outputs. We can see that fragmentation and regionalization in teachers’ demands may prove damaging for the logic of social order, union cohesion, and states’ control of the schooling system. We can observe that, in states where CNTE is present, there is a negative and significant impact of the union on both Mathematics and Spanish results. These results are in line with those found in Figure 1, where we observe that the states where CNTE prevails, such as Chiapas (CHS), Guerrero (GRO), and Michoacán (MIC), have lower efficiency outcomes in education. Overall, these recent results suggest that other institutional factors, such as transparency and the power relationship between states and the teachers’ union, are also relevant predictors of efficiency.
6. Conclusions and Policy Implications
Despite years of public interventions, Mexico’s outcomes in education have been modest and vary considerably across states. This paper examines the efficiency of elementary schools in Mexico from 2009 to 2011. Unlike previous studies for Mexico, in this paper, we control for school characteristics and state factors that affect efficiency in educational outcomes of public elementary schools. We employ a two-stage approach. In the first stage, we obtain efficiency scores based on the ENLACE test for Spanish and Mathematics. In the second stage, we regress those efficiency scores employing panel data methods.
Our results show that, based on input-output combinations, efficiency scores vary significantly across states, while there is not much variation across subjects. We find that the teachers’ experience, the teaching load for principals and schools’ infrastructure, all improve educational outputs in both test subjects. Expenditure per student has a positive but small effect on educational outcomes. On the other hand, indigenous schools have a negative and significant impact on scholarly outcomes. We also find that less competition decreases technical efficiency among public primary schools. The variables used to model the error term, the marginalization index, and whether schools locate in an urban area, both decrease the dispersion of the error term. In the second stage, the environmental and regional factors that are positively associated with school efficiency are average school grades and school geographically located in the north or central regions. We also observe that expenditure, both as a proportion of total spending and the average spending, negatively affects efficiency outcomes in education. In general, the variation in efficiency seen across states is not necessarily related to access to resources but rather to other institutional factors and political control of school districts. Finally, we observe that fragmentation and regionalization in teachers’ union interests negatively affect the efficiency outcomes in education.
An important policy implication of our analysis is that the more resources spent on indigenous schools relative to states’ total public spending, the lower efficiency attained. This result suggests that special attention is needed in the implementation of educational programs to close the gap between efficiency outcomes in indigenous schools and the average efficiency observed in the rest of the country. Future work in this line of research could improve upon our work by using multilevel analyses that capture differences within and between states and regions. For policymakers, we also note that while differences in efficiency for school characteristics are often reported, an analysis of the structure of power at the state and federal level may also be relevant.

