


 nueva página del texto (beta)
 Inglés (pdf)
 Artículo en XML
 Referencias del artículo
 Enviar artículo por email
 Citado por SciELO
  Similares en
SciELO
Similares en
SciELO 
 Permalink
1. Introduction
After the debt crisis of the 1980s, the reintegration of some developing countries to international financial markets has been a key feature to understand their economic cycles. Medeiros (2008) shows that since the 1990s the economic cycles of peripheral countries, usually correlated to commodity prices, regain a financial aspect related to their integration to international financial markets. The liberalization of capital accounts and the consequent flow of capital became a new source of instability for these countries.
The instability of the 1990s raised a great debate over the main factors that may have explained the inflow of capital to developing economies (Hannan, 2018; Koepke, 2018). Indeed, the inspiration for this debate was the return of developing economies to international markets at the end of the 1980s (Calvo, Leiderman, and Reinhart, 1993). The first findings stressed the central role of external factors related to global liquidity (the so-called “push” factors). This view was reinforced in the 2000s when impressive flows of capital to developing economies were observed again (Rey, 2015).
This article aims to inquire empirically the extent to which push factors linked to global liquidity play a major role (compared to country-specific factors) in the changes in the risk premium for a set of developing or peripheral economies in the period 1999-2019. The empirical motivation for the current investigation is given by Figure 1, which presents a strong correlation between a measure of country-risk spread expressed by the EMBI+ and the specific EMBI Brazil2 risk spread. This apparent strong correlation is remarkable because the EMBI+ is composed of very different countries such as Brazil, Egypt and Malaysia.

We test this connection among country-risk premium indicators by employing the Principal Component Analysis (PCA) as presented in Johnson and Wichern (2002) and Jolliffe (2002). According to this methodology, we try to find the fraction of the total variance of a set of sovereign risk series which can be explained by a subset of one or two principal components. We use the group of countries considered in the EMBI+ index for the period between January 1999 to January 2019. Depending on the size of this fraction, we may show the relative importance of common factors as determinant of the sovereign risk despite the differences in country-specific countries. The original use of this approach is found in Calvo, Leiderman, and Reinhart (1993).
We also note a sharp reduction of both the EMBI+ and the EMBI Brazil risk spreads after 2003 (see Figure 1), despite a spike during the global financial crisis. So, we apply a structural break test in order to estimate changes in the pattern of sovereign risk spreads in the 2000s. Moreover, we provide evidence that the common factors behind our set of country-risk premium can be explained by financial variables, namely the US interest rate, the oil price and the Volatility Index of the S&P 500 prices (VIX).
The country risk premium is a central element to be considered by Central Banks’ decisions of monetary policy under international capital mobility (Serrano and Summa, 2015). Therefore, an empirical exercise on the determinants of the country risk premium may be relevant to assess the level of financial dependency of developing economies. The empirical results for the period 1999-2019 reinforce the view of the push side in the literature and confirm empirically that the expansionary financial cycle in the 2000s (Akyüz, 2017; Medeiros, Serrano, and Freitas, 2016; Serrano, 2013) largely explains the fall in country-risk for selected developing economies.
The paper is organized into four sections. After this introduction, the following section details the debate on pull-push factors on capital flows and the determinants of country-risk spreads; here we also discuss our main findings on country-risk determinants through the PCA. The third section provides an economic interpretation of the previous results. It explores how changes in the selected country-risk premium are related to changes in external financial conditions in the 2000s. The final section concludes the paper.
2. Country risk determinants
2 .1. The pull-push literature
Calvo, Leiderman, and Reinhart (1993) note a broad resumption of the inflow of foreign capital to Latin American countries in the early 1990s, after the interruption in the middle of the previous decade. This fact seemed puzzling for these authors since capitals had returned to flow into different developing countries, not just those which had supposedly adopted the reform agenda advocated in the period3. The amount of capital that flowed into the Latin American countries in the form of direct foreign investments and investments in portfolios reached US$ 670 billion in the period 1990-1994. It was five times the amount that had flowed in the period 1984-1989 (Calvo, Leiderman, and Reinhart, 1996). When analyzing the dynamics of variables such as international reserves, real exchange rate and inflation for ten Latin American countries4, Calvo, Leiderman, and Reinhart (1993) found a common factor to these countries which explained 69% to 88% of the total variation of these indicators. The authors also found a correlation between the co-movement of these factors and the recession of the US economy in the early 1990s. And the reduction in Federal Reserve System (Fed) interest rate initiated in the second half of 1989.
Based on Calvo, Leiderman, and Reinhart (1993) findings, Fernandez-Arias (1996) and Taylor and Sarno (1997) proposed to control the inflow of capital estimation in the emerging economies using variables associated with domestic factors. Calvo, Leiderman, and Reinhart (1993) also inspired several empirical studies that aimed to measure whether external factors tend to prevail upon internal factors (or vice-versa) in explaining the recovery of capital inflows to Latin America in the 1990s -also known as pull-push debate. For those who defended the prevalence of push factors, the reasons for the resumption of the capital flow was the fall of the Fed’s interest rate and the recession in the US economy at the beginning of the 1990s (Koepke, 2018). However, over the same decade, the Fed’s interest rate rose again, and the US economy recovered, but the capital flows to Latin America did not fall. In this context, those who defended the predominance of domestic factors to determine the attraction of capital gained some space, associating this recovery with improvements in the situation of the external accounts, the commercial and financial opening and the adjustment of the public budgets. However, the indiscriminate capital inflows to different Latin American economies throughout the 1990s suggest that domestic factors hardly explain the capital flow on their own (Koepke, 2018). Moreover, throughout the literature, the domestic factors commonly found as being empirically significant are those associated with the situation of the external accounts of each country, which reflect the external vulnerability of these economies. Hannan (2018) lists the domestic factors often put forth by the pull literature: Trade liberalization, international reserves, exchange rate regime, institutional quality, per capita income, capital account opening and financial market development. It is remarkable that none of them are associated with fiscal policy.
In the 2000s, after the international financial crisis and the consequent monetary easing in the US and Europe, the push side regained strength, as seen, for example, in Bruno and Shin (2013) and Rey (2015). For these authors, the monetary policy in the central economies is the main determinant of the global financial cycles. Thus, these studies seek to measure empirically the consequences of interest rate shocks caused by the Fed on global risk perception and international liquidity levels. An initial negative (positive) shock in the US basic interest rate may change the perception of global risk and this movement triggers a wave of capital inflows (outflows) in emerging economies. This type of analysis is strongly connected with the sharp fall of interest rates in the central economies after 2009.
It is worth noting that the pull-push literature was focused not only on the measurement of capital flow determinants, but also on its impact on macroeconomic variables in the analyzed countries. This literature, from Calvo, Leiderman, and Reinhart (1993) to Rey (2015), sought to observe the impact of international capital flows on the series of foreign exchange, reserves, bank credit, asset prices, and stock market performance. Hence this literature tried to evaluate how the global financial cycle could impact the national economies and monetary policy. Rey (2015) argues that the so-called trilemma is, in fact, a dilemma. Given the predominance of global liquidity determining the inflow/outflow of external capitals to/from developing countries, the choice is only between the autonomy of monetary policy or the free mobility of capital, regardless of the exchange rate regime adopted.
The pull-push debate interests us to the extent that the country-risk premium reflects the appetite of non-resident investors to apply their resources in developing economies. Since the country-risk premium (in addition to the foreign interest rate and the expected devaluation of the exchange rate) defines the floor for the domestic interest rate, its variation is central to understand the inflow/outflow of capital to/from developing economies. Therefore, we approach the pull-push controversy through the analysis of the determinants of the country-risk premium.
The literature on the determinants of sovereign risk for Latin American countries is much influenced by Blanchard (2004), which proposes a link between domestic factors (fiscal indicators) and the level of country risk. Gupta, Mati, and Baldacci (2008) recognize that the empirical literature linking country risk to fiscal policy is limited. Still, they try to demonstrate through a panel of thirty countries between 1997 and 2007 that levels of public deficit and public debt indicate the likelihood of default. Thus, the authors try to show that these fiscal variables negatively affect the level of the country-risk spreads. Using panel data from 1998 to 2002 with 66 countries, Canuto, Dos Santos, and de Sá Porto (2012) seek to identify the variables that can explain the risk assessment of rating agencies.5 As a result, the authors find statistical significance in the gross public debt variable as a percentage of the public revenues to explain the country-risk scores.
Some authors find co-movements for different series of country risk in emerging economies, which can be interpreted as push factors for the flow of capital. McGuire and Schrijvers (2003), using the factorial decomposition methodology, found that a single common factor explains around 80% of the common variance of the country-risk premium of a set of 15 countries6. Moreover, these authors observed a negative correlation between the first common factor and interest rates indicators in the US economy and a positive correlation between this factor and a global market volatility indicator. Accordingly, the co-movements of the sovereign risk series are linked to the global financial cycles, as in the push literature. In the same way, Longstaff et al. (2011) conduct a principal component analysis and find that the first three principal components are responsible for more than 50% of the common variance of the Credit Default Swap (CDS) series of a group of 26 countries. After this exercise, the authors run regressions of the monthly variations of the CDS series against local factors and external indicators. The average result is that the local factors chosen (local stock exchange volatility, official reserve variance, and nominal exchange rate variation) explain, on average, one-third of the CDS variation. The remainder would be explained by indicators of the return of stocks and treasuries in the US economy.
The existing empirical evidence on the co-movements of sovereign risk series for developing countries supports the intuition behind our Figure 1. In this work, we examine a set of developing economies between 1999 and 2019 and show the extent to which common (push) factors explain the variation in country-risk spreads. Therefore, we analyze the co-movements of the sovereign risk series of the economies that are part of the JP Morgan’s EMBI+. Before our empirical exercise, we briefly explain the country-risk indexes that we use in this paper.
2.2. EMBI+ and CDS
The EMBI+ is one of the most widespread country risk indexes. It reflects the weighted average of the difference between the daily returns of sovereign debt instruments of emerging countries and the return of US Treasury securities of the same maturity. JP Morgan Chase makes the EMBI index available separately for each country participating in the index. The EMBI index for a given country is usually understood as the country-risk spread. It corresponds to the weighted average of the premiums paid by, for example, Brazilian foreign debt in relation to the US Treasury of the same maturities.
In our empirical study, we consider the EMBI+ country risk series for the following countries: Argentina, Brazil, Bulgaria, Colombia, Egypt, Ecuador, Philippines, Malaysia, Mexico, Panama, Peru, Russia, Venezuela, Ukraine, and Turkey7. The older series available begin in January 1998, but some countries have series starting later, as in the case of Malaysia which has data only starting in July 2010. All series end in January 2019.
In addition to the EMBI index, we provide the PCA based on the CDS. The CDS is a credit derivative and, in theory, it has the function of protecting its buyer in relation to the risk of default. The spread of the CDS corresponds to the premium paid for the derivative of the buyer and its swap occurs only in a situation of “credit events”: Bankruptcy, prepayment obligations, missed payments, default and restructuring (Farhi, 2009). This premium is ultimately equivalent to the country-risk premium because, by arbitrage, the insured’s premium is directly correlated to the implicit risk in the differential of the remuneration between the sovereign debt and the safe asset (treasuries). Thus, it is expected that the trends of the EMBI+ and CDS series will converge.
2.3. Principal component analysis results
We use the PCA to infer the degree of relevance of common factors in explaining the country risk premium variables of different developing countries. These common factors are usually linked to external factors in the push literature (Calvo, Leiderman, and Reinhart, 1993). It is also possible to address the correlation between the main components and the exogenous variables. For example, it is possible to evaluate the correlation between one or more principal components obtained with an indicator such as the Chicago Board Options Exchange (CBOE) Volatility Index (VIX), which measures the volatility of stock options in the S&P 500.
As noted in Figure 2, the trajectories of the country-risk premium curves have in common a sharp decline after 2004 and a rise during the subprime financial crisis. The matrix of simple correlations among the country risk series reinforces the hypothesis that there are common factors to these series.
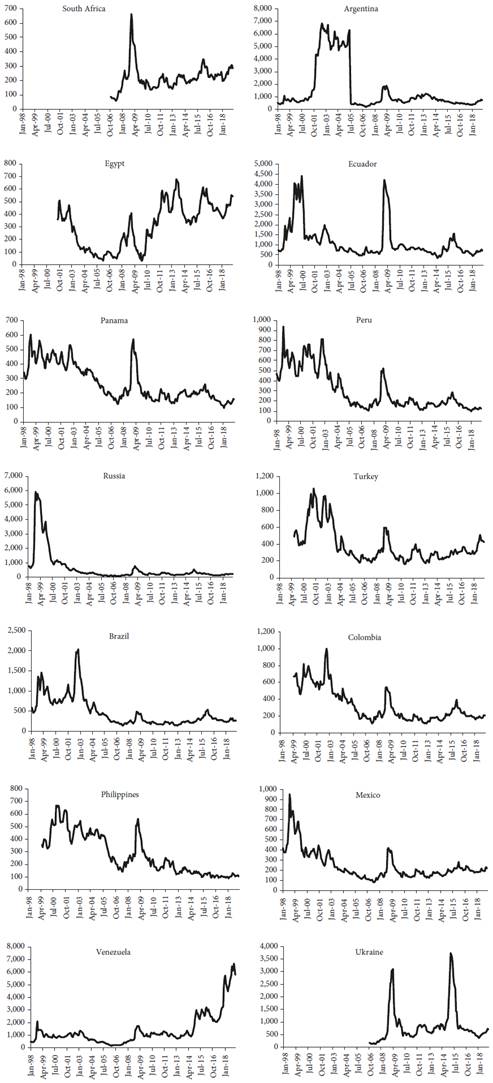
Simple correlations are larger than 0.50 in most cases. Negative correlations are observed in the cases of Egypt and Venezuela. In the case of Egypt, this is due to an abrupt rise of country risk during the Arab Spring, in which the central power was forcibly overthrown, and a new government was established. The increase in the country-risk spread in 2010 was not followed by other countries. In the case of Venezuela, the country-risk spread has raised since 2017, due to the political crisis and recurrent coup threats over these years. Again, this movement was not usually followed by other countries.
When dealing with common factors there is also a possibility of contagion. Extreme situations associated with insolvency in foreign currency, as was the case of Argentina in 2001, can be transmitted to the country-risk spread of other countries. There was a direct contagion, as can be seen in the curves of Latin American countries that seemed to have been affected by the Argentinian shock, as well as by an indirect contagion mediated by the deterioration in the perception of global risk, which would damage the risk spreads of countries such as the Philippines and Turkey.
In addition to correlation, the principal component analysis indicates that it is possible to explain the EMBI+ series of developing economies with a few common factors. We present four different groups of countries in order to verify if the results of the PCA were robust. Although we have chosen to carry out the present analysis using the EMBI+ series, we apply the PCA to two groups of countries using the CDS index. The results are summarized in Figure 3, which shows the cumulative proportion of the global variance explained by the first and second principal components.
As can be seen in Figure 3, except for Group 2 all groups present at least 70% of the global variance explained solely by the first component. Jolliffe (2002) points out that this percentage would be enough to choose only one principal component to summarize the original set of series. When aggregating the second principal component, the explained percentage jumps to 91% in one of the clusters. This indicates, as we shall see, that the consideration of the two main components will be enough for economic interpretation. It is worth noting that results are maintained when the CDS is considered as a country risk indicator. The results found here confirm other works with the same methodology (Longstaff et al., 2011) and are in accordance with the push literature on capital flows. The Annex I to this article presents the individual and cumulative proportions of all the principal components for each group.
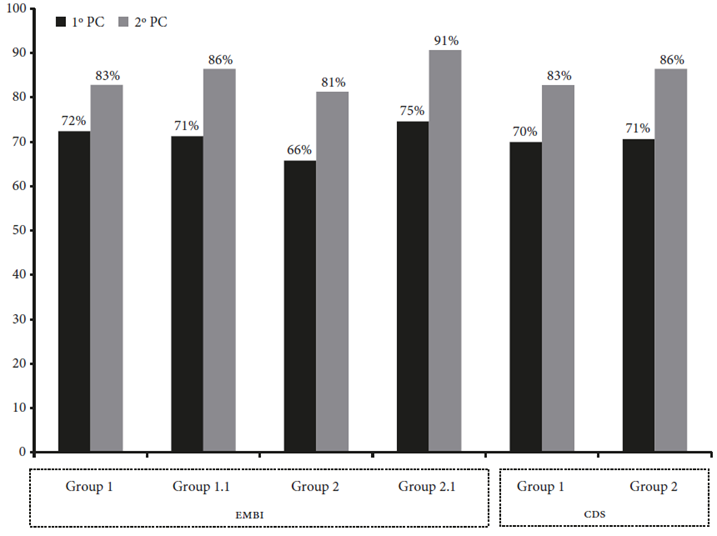
In Group 1, the emerging economies that currently compose the EMBI+ index were included, with the exceptions of Bulgaria, Malaysia, Morocco, Nigeria and Poland due to the unavailability of data in the period considered. Besides, we excluded Egypt and Venezuela due to their extreme political crises, as already mentioned. In Group 1.1 we removed Ukraine from the sample, allowing the analysis to begin in July 1999 and capture, for example, the Argentine crisis of 2001. Group 1 comprises 10 countries with very different realities such as Russia and the Philippines, and the PCA indicates that 86% of the original variance of the risk premium can be explained by two main components (only the first principal component explains 71 %). In Group 2, only Latin American economies were selected, while Group 2.1 excluded Venezuela to control how this country could change the outcome. The objective of applying the PCA to Latin American economies exclusively was to check whether the common factors become more relevant to a subset of economies that may be more subject to the contagion effect. The result indicates that there is a slightly greater relevance of the first two principal components in explaining the original variances of the series.
So far, we showed the relevance of the first and second principal components in explaining the total variance of the original series, which is strong evidence of common factors in determining the country-risk premium. Our results are corroborated by a recent report from the IMF, according to which almost 70% of the emerging markets’ sovereign spread tightening from 2010 to 2019 can be associated with external factors. The study is based on a panel data of 65 economies (IMF, 2019). In the next section, we will evaluate in more detail the economic interpretation of these results.
Table 1 Correlation matrix of the EMBI+ country series
| South Africa | Argentina | Brazil | Colombia | Egypt | Ecuador | Philippines | Mexico | Panama | Peru | Venezuela | Ukraine | Turkey | Russia | |
| South Africa | 1.00 | 0.59 | 0.81 | 0.88 | 0.34 | 0.73 | 0.55 | 0.95 | 0.80 | 0.81 | 0.35 | 0.50 | 0.86 | 0.75 |
| Argentina | 0.59 | 1.00 | 0.21 | 0.47 | 0.20 | 0.67 | 0.66 | 0.57 | 0.70 | 0.65 | 0.18 | 0.48 | 0.46 | 0.71 |
| Brazil | 0.81 | 0.21 | 1.00 | 0.87 | 0.31 | 0.59 | 0.26 | 0.84 | 0.64 | 0.68 | 0.40 | 0.50 | 0.67 | 0.59 |
| Colombia | 0.88 | 0.47 | 0.87 | 1.00 | 0.02 | 0.84 | 0.68 | 0.92 | 0.91 | 0.92 | 0.13 | 0.54 | 0.72 | 0.77 |
| Egypt | 0.34 | 0.20 | 0.31 | 0.02 | 1.00 | -0.10 | -0.36 | 0.27 | -0.08 | -0.02 | 0.42 | 0.10 | 0.26 | 0.06 |
| Ecuador | 0.73 | 0.67 | 0.59 | 0.84 | -0.10 | 1.00 | 0.76 | 0.78 | 0.88 | 0.86 | -0.03 | 0.53 | 0.60 | 0.80 |
| Philippines | 0.55 | 0.66 | 0.26 | 0.68 | -0.36 | 0.76 | 1.00 | 0.56 | 0.85 | 0.84 | -0.38 | 0.31 | 0.50 | 0.68 |
| Mexico | 0.95 | 0.57 | 0.84 | 0.92 | 0.27 | 0.78 | 0.56 | 1.00 | 0.82 | 0.84 | 0.33 | 0.59 | 0.84 | 0.80 |
| Panama | 0.80 | 0.70 | 0.64 | 0.91 | -0.08 | 0.88 | 0.85 | 0.82 | 1.00 | 0.97 | -0.16 | 0.58 | 0.64 | 0.85 |
| Peru | 0.81 | 0.65 | 0.68 | 0.92 | -0.02 | 0.86 | 0.84 | 0.84 | 0.97 | 1.00 | -0.13 | 0.55 | 0.64 | 0.85 |
| Venezuela | 0.35 | -0.18 | 0.40 | 0.13 | 0.42 | -0.03 | -0.38 | 0.33 | -0.16 | -0.13 | 1.00 | 0.13 | 0.45 | 0.07 |
| Ukraine | 0.50 | 0.48 | 0.50 | 0.54 | 0.10 | 0.53 | 0.31 | 0.59 | 0.58 | 0.55 | 0.13 | 1.00 | 0.34 | 0.76 |
| Turkey | 0.86 | 0.46 | 0.67 | 0.72 | 0.26 | 0.60 | 0.50 | 0.84 | 0.64 | 0.64 | 0.45 | 0.34 | 1.00 | 0.61 |
| Russia | 0.75 | 0.71 | 0.59 | 0.77 | 0.06 | 0.80 | 0.68 | 0.80 | 0.85 | 0.85 | 0.07 | 0.76 | 0.61 | 1.00 |
Source: Authors.
3. Interpretation of the Main Component Analysis Results: International Liquidity
3.1. The international liquidity expansion in the 2000s
Medeiros (2008) argues that the reintegration of Latin American countries to the financial markets in the late 1980s and early 1990s preceded an era of financial instabilities associated with commodity price cycles. Crises arising from disruptions to the financial flow were frequent in the 1990s and particularly affected those countries that did not have any effective capital controls. In our PCA, we showed that the country-risk premium, which is an important constraint to the domestic interest rate in terms of external financing, is largely determined by common factors among developing economies. Now we explore the link between the common factors and the international liquidity cycles.
According to Medeiros, Serrano, and Freitas (2016) and Akyüz (2017), in the 1990s the greater integration of the developing world led to a synchronization of cycles. Since 2000, this integration, together with changes in economic policies of a large number of developing countries, contributed to a decoupling of the growth trend of the developing economies relative to the advanced countries. This movement was strongly linked to the change in the external financing pattern of developing economies, expressed both by the large inflow of foreign capital to these countries and by the new trend of a substantial accumulation of international reserves by monetary authorities in the developing world.
According to Serrano (2013) and Medeiros, Serrano, and Freitas (2016), four factors help to explain the changing pattern observed in developing economies since the 2000s: (i) the maintenance of low interest rates in central countries; (ii) the large inflow of foreign capital to peripheral countries; (iii) the increase in the relative prices of the main energy, mineral and agricultural commodities; and (iv) the rapid expansion of the domestic market and imports of the Chinese economy and other large developing economies in the period. Factors (i) and (ii) are strongly associated with the expansion of international liquidity searching for higher yields. Thus, in addition to the low-interest rates, there is a general improvement in risk perception regarding developing economies (Frenkel and Rapetti, 2011).
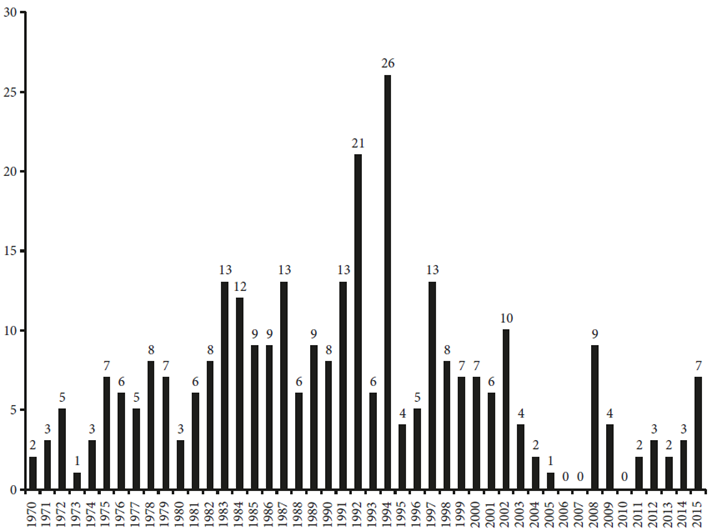
This new pattern of external financing in Latin America, for example, is reflected in Figure 4. As Frenkel and Rappetti (2011) point out, the Latin American economies taken together presented a surplus in the current account between 2003 and 2007. After that, however, deficits in the current accounts resurged again, but the inflow of foreign capital (translated into financial account surpluses) more than compensated it. Serrano (2013) adds that many developing countries took advantage of this window of opportunity and improved the management of their balance of payments (and in particular their financial accounts), something that contributed to this new and more positive external financing scenario. Many of these economies succeeded in paying their official foreign debt stock, accumulated international reserves (see Figure 4) and some established (or increased their assets in) Sovereign Funds. Central Banks also adopted a “dirty” managed floating exchange rate regime, in order to mitigate speculative attacks. These measures made developing countries more resilient to international shocks and allowed growth not to be interrupted by the Balance of Payments constraints. This also led to a tendency to appreciate the exchange rate, except for some Asian countries, in the period from 2004 until the 2008 international crisis, with a resumption of this movement in 2010. The general exchange appreciation movement of commodity exports, in its turn, contributed to the upward trend of commodity prices, exported by developing countries. In this context, Eichengreen (2016) identifies a sharp fall in the number of episodes of exchange rate crisis from 2003 onwards (see Figure 5).

Source: Elaborated by authors based on World Economic Outlook e International Financial Statistics at the FMI.
Figure 4 Balance of Payments: Latin America (US$ billions)
3.2. Structural breaks for the country-risk premium
This changing pattern in global liquidity was translated into a fall of the country-risk premium (EMBI+) from an average of 864 from 1998 to 2002 to a level of around 350 in 2003 onwards. In the case of Brazil, which motivated our present work, the same movement occurred simultaneously at the EMBI Brazil and the CDS Brazil, starting in 2004 (see Figure 6).

This structural change was captured by the Bai and Perron (2003) structural break tests, in its different versions, as shown in Table 2. Additionally, we performed two unit roots with structural breakpoints tests8. These tests are not consensual about the existence of the unit root in this series, but this was not the purpose of the exercise. Our interest is only to corroborate the results of the Bai-Perron test, showing that possible break dates match those found by Bai-Perron test.
Tests indicate an important change for the EMBI Brazil and the EMBI+ series in the second half of 2002. Some tests also suggest a second break, in 2004-2005, when the series settled down to a lower level. In the case of the CDS, whose series started in 2002, tests indicated a break in 2004, agreeing with the previous results (see Figure 6). This empirical analysis reinforces both the claim that external factors prevail in determining country-risk premium and the hypothesis that the change in international liquidity conditions in the 2000s improved the risk assessment and external financing conditions for the most part of the developing world. In other words, the liquidity expansion in advanced economies increased the capital flows to the periphery, which, in addition to the combined effect of faster growth in South-South trade, better terms of trade and the massive accumulation of foreign reserves in a large number of developing countries, contributed to a broad fall in the country-risk premium spreads.
Table 2 Structural breaks tests
| Lee Strazicich* | EMBI Brazil | EMBI+ | CDS Brazil** |
|---|---|---|---|
| One break | 2002 November | 2002 November | 2004 August |
| Two breaks | |||
| 1° break | 2002 September | 2002 November | na |
| 2° break | 2004 August | 2005 May | na |
| Dickey-Fuller minimum t test | 2002 October | 2002 November | 2003 March |
| Bai-Perron (break type:) | |||
| Bai tests of breaks in all recursively determined partitions | 2002 August | 2002 November | 2004 August |
| Fixed number of globally determined breaks | 2002 August | 2002 November | 2004 August |
| Compared information criteria for 0 to M | |||
| Globally determined breaks selected by Schwarz criterion | 2002 August | 2002 November | 2004 August |
| Bai-Perron tests of L+1 versus L sequentially determined breaks | 2002 August | 2002 November | 2004 August |
| Bai-Perron tests of L+1 versus L globally determined breaks | 2002 August | 2002 November | 2004 August |
| Fixed number of sequentially determined breaks | |||
| One Break | 2002 August | 2002 November | 2004 August |
| Two Breaks | |||
| 1° break | 2002 July | 2002 November | na |
| 2° break | 2005 September | 2007 November | na |
Notes: * Maximum lag chosen by Schwert’s (1989) principle.
** Sample from October 2001 to January 2019.
Source: Authors.
3.3. Country risk-premium and the international liquidity variables
Following Calvo, Leiderman, and Reinhart (1993), we look for the explanation of the first principal component in three key variables for determining the global financial cycle (in particular for developing economies): The Federal Funds Rate (FFR), the interest rate corresponding to the 5-year Treasury Notes, the Brent oil barrel price (as a commodity price indicator) and the VIX index as an indicator of risk perception. Due to the lack of consensus regarding unit root tests, and the possibility of structural breaks, we tested the hypothesis of cointegration using the Lütkepohl, Saikkonen, and Trenkler (2003) procedure. The test indicated that these four variables cointegrate as a group. Additionally, the test for the first component and each of one of three variables indicates the rejection of the null hypothesis of no cointegration (see Annex). We then estimated a cointegrated regression considering the first principal component as the dependent variable and assuming as exogeneous the following variables: The Brent Oil price, the VIX and the 5-year T-Note. The method used for estimation was the Dynamic Ordinary Least Square. The estimation confirmed the statistical significance of the explanatory variables (as shown by the p-value for each estimated coefficient) suggested by individual correlations in Equation [1].
The empirical exercise suggests that an increase in the interest rate associated with the 5-year T-Note coincides with a higher perception of risk captured by the first principal component. The same result is observed for the VIX index. It is worth mentioning that the correlation is higher with the 5-year rate and the volatility indicator. A possible explanation for this relationship is the fact that these variables carry the perception of market agents about the possible future trajectory of the US basic rate implicitly. The first principal component for the country-risk spreads is negatively correlated with the oil price. This is an expected result in the push literature, given the relevant share of commodities in developing economies’ exports. In Figure 7, we compare the actual first principal component and our estimation. It seems straightforward from this Figure that our model can explain the main changes in the common component of the country-risk premium since 2003.

The series representing the two main components of Group 1.1 of our study are represented in Figure 89 The first principal component reflects the change in the pattern of external financing observed from 2004 onwards and, as we saw, reacts to the US interest rate, the market volatility and the commodity prices. In other words, the first principal component replicates the observed changes in the global liquidity scenario.
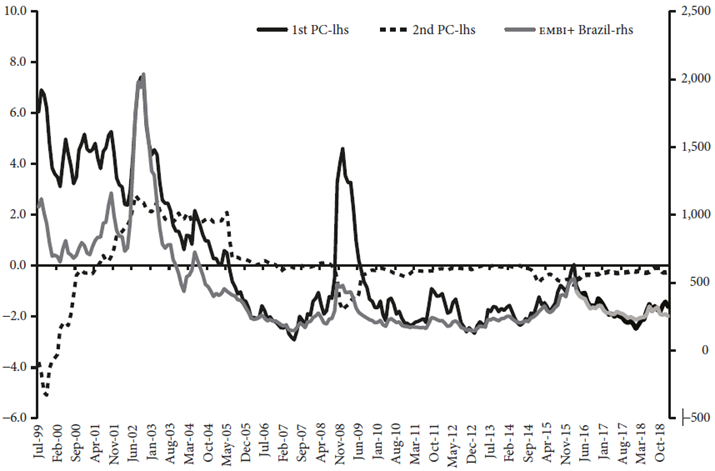
The curve related to the first principal component also highlights two particular moments connected to the deterioration in the risk perception regarding developing economies. The first one refers to the 2008 international financial crisis and, in this case, the curve quickly returns to the previous level. The second one is related to the large increase in the country-risk spreads in 10 emerging economies in 201410. Akyüz (2017) shows that this period was characterized by a strong exchange devaluation in some developing countries, such as South Africa, Brazil, Mexico, and Turkey. The inflow of capital into Latin American countries ceased to grow, although there is no loss of international reserves in the period. The author identifies as the causes of this shift the Euro Crisis and the Fed’s announcement, in 2013, that the cycle of liquidity expansion could be coming to an end. These two factors are highlighted in Figure 9, which shows the increase in the VIX index at the end of 2014 and the 5-year T-Note in May 201311.

Therefore, the rise in country-risk premium during the years 2013-2015 was largely due to a reversal in the international liquidity despite the domestic economic or political factors. In this regard, Naqvi (2018) conducted 41 interviews with participants of the sovereign bond markets in Hong Kong and Singapore between January and April 2013, in parallel with a detailed analysis of the specialized media in the period. She concludes that international liquidity conditions strongly influence the perception of the risk of market players on the domestic fundamentals of the emerging economies.
The rapid reversal of country risk growth, observed in the first half of 2016 in several developing countries is correlated with the fall in the VIX index and the 5-year T-Note interest rates (see Figure 9). The 14% rise in commodity prices in 2017, after falling (40% drop in metal and agricultural commodities measured by the IMF) between 2012 and 2016, also helps to explain the improvement in the external conditions.
4. Final Remarks
This article sought to measure the impact of the financial integration of developing economies within international financial markets by evaluating common determinants of the country-risk spreads. We reappraised the pull-push debate on the determinants of capital inflows in order to contextualize our empirical analysis. Our Principal Component Analysis of the country-risk spread series of ten emerging economies from 1999 to 2019 revealed that 86% of the total variation of the original series can be represented by only two components, suggesting the prevalence of common factors in determining country risk. This evidence, reinforced by the correlation between the first principal component and the global liquidity indicators, corroborates our hypothesis that the country-risk is primarily driven by external factors, in agreement with the push literature. We found oil prices, VIX index and the 5-year T-Note interest rate as relevant global liquidity indicators to the country-risk premium movements.
Our contribution is to strengthen the thesis, expressed in Medeiros (2008), about the subordination of cycles in developing economies to global financial cycles. This imposes an (asymmetric) constraint for the management of domestic monetary policy. In order to avoid capital outflows or successive exchange rate devaluations, the domestic interest rate should not remain lower than the international reference interest rate added to its risk premium and the expected depreciation of the exchange rate (Serrano and Summa, 2015). This constraint, as we have seen, has changed significantly in the 2000s. In the recent expansionary cycle of global liquidity, many developing economies seem to have taken advantage of this window of opportunity to grow more and reduce their external vulnerability simultaneously. These two movements ended up having the combined effect of lowering the collective external fragility of the developing economies (Medeiros, Serrano, and Freitas, 2016; Serrano, 2013).
As a result of this change, developing economies experienced a virtually unprecedented period of reduction of the balance of payments crisis. This favorable scenario led to a once for all structural break at the level of sovereign risk spreads that have fallen significantly after 2003. The country-risk spreads have not risen again to the levels that prevailed in the 1990s, although they continued to react to international financial indicators. The country-risk spreads had risen both during the 2008-2009 world financial crisis and in 2014-2015, when the Fed threatened to raise the interest rate and cut the nonconventional monetary policy mechanisms. But overall developing economies were in a better position to deal with those changes than before 2002. Therefore, although country-risk spreads still vary in response to changes in the global liquidity conditions, they do it around a significantly lower average.

