


 text new page (beta)
 English (pdf)
 Article in xml format
 Article references
 Send this article by e-mail
 Cited by SciELO
  Similars in
SciELO
Similars in
SciELO 
 Permalink
1. Introduction
The structure of intersectoral dependencies in the economy determines the aggregate and sectoral impact of shocks. According to the connectivity of the sectors in this structure, the magnitude of the effect of the shock will be different and it will diffuse to a wider or narrower part of the economy. In this paper, we apply network measures of global centrality and propose a measure of diffusion to identify strategic sectors in an economy’s productive structure. We focus on the link structure among sectors that forms production chains and captures the diffusion of the effect on production of sectoral shocks on final demand.
The structure of the economy is viewed as the components of the macroeconomic aggregates and the patterns of interactions between them (Thakur, 2011). These components are aggregated into economic activities or sectors and are connected through intersectoral linkages. There are different alternative methods to identify key sectors according to the input-output structure. Input-output analysis studies the intersectoral dependencies in an economy and the impact of sectors on the macroeconomy. Traditionally, the tools used in this literature include backward linkages, forward linkages, and multipliers (Miller and Blair, 2009). These measures have been used to identify key sectors as those that generate above average linkages in the economy (Rasmussen, 1956; Chenery and Watanabe, 1958). These sectors are suitable to selective stimulation because they will generate higher effects on growth (Hirschman, 1958; McGilvray, 1977).
After the first introduction of the linkage measures several changes have been proposed; examples include the computation of backward and forward direct and indirect linkages, the computation of forward linkages using the output matrix instead of the input matrix, and the inclusion of imported or domestic intermediate inputs (Jones, 1976). Further alternatives include Dietzenbacher (1992), which shows the eigenvector method for the computation of linkages that incorporates direct and indirect effects weighted according to the sectors they are connected to, where not all connections are of the same importance. Dietzenbacher and van der Linden (1997) provides another method to compute backward and forward linkages based on the hypothetical extraction method at the sector-country level. Furthermore, Dietzenbacher and Romero (2007) analyses the average number of steps needed for a stimulus in final demand of one industry to affect another one defined as the average propagation length. It shows that the average distance between these two industries does not depend on whether the backward of forward perspective is adopted. Temurshoev and Oosterhaven (2010), in turn, propose complementary measures that capture factors beyond the production system such as environmental or resource factors.
Marconi, Rocha, and Magacho (2016) analyze the capacity of commodity exports to generate long-term economic growth in the Brazilian economy. Authors assess the sectors’ performance and their effects on related sectors through the upstream supply chain using input-output tables. Authors computed output multipliers, Hirschman-Rasmussen indices, pure backward linkages normalized (PBLN) indices, and pure forward linkages normalized (PFLN) indices. They found that agricultural and mineral commodities had low effects on the economy because they have the lowest linkages. On the other hand, their analysis showed that sectors related to manufacturing could stimulate other more sophisticated sectors because they have high linkage effects on other sectors.
Related to the input-output literature, one finds the literature on economic dominance and network analysis. Economic dominance uses input-output data to study the structure of the economy as a graph and the dominance of one sector over another or on the whole structure of the graph (Lantner, 1972). Lantner (1976) uses the Leontief model of an open economy to compute the economic dominance of a sector. It defines an influence matrix associated to the productive structure of the economy and measures a general interdependence between sectors from the determinant of the structure. Lantner and Lebert (2013) applies the analysis of economic dominance to the structure of international trade flows for 171 countries and 28 manufactured goods. They construct the influence graph of the productive structure and of the exchange structure as directed graphs. They compute relative and absolute global effects on total output of a change in final demand of a sector by using the technical coefficients and trade coefficients matrices. Moreover, they compute the determinant of the matrix describing the structure and analyze circuits and loops to study dominance and dependence.
A branch of literature on complex network analysis combines input-output data with network analysis to study the productive structure of an economy. Network analysis proposes different measures of centrality, which provide different information. According to the research question at hand, one may choose one measure over the other. For example, degree centrality counts the number of adjacent connections of a node. A more informative measure is the weighted degree, which considers the number and intensity of the adjacent connections. Furthermore, one finds closeness centrality, which measures the average distance from one node to the others; betweenness centrality that measures the property of a node of being on the shortest path from one node to another and that quantifies the number of geodesic paths (Newman, 2010). There are other types of centralities such as eigenvector centrality that acknowledges that not all adjacent connections are of the same quality and, thus, gives a score to each node proportional to the sum of the scores of the adjacent nodes. Finally, authority and hub scores are a generalization of the eigenvector centrality for directed networks and analyze the link structure of the network (Newman, 2010). Importantly, some of the centrality measures in the networks literature have their equivalent, or close concept, in input-output analysis. Examples include direct backward linkages and weighted degree centrality, eigenvector method for computing backward linkages and the eigenvector centrality, and some recent developments such as the generalizations of betweenness centrality for directed graphs with self-loops.
Studies in the literature of network analysis and input-output data include Slater (1978) that uses the 1967 United States input-output table to identify the group of sectors that are dependent or independent of other groups calculating each sector’s degree and strength or weighted degree. Amaral (2007) proposes “quantifying economic complexity as input-output interdependence”. It considers two types of effects: A “network” effect that gives information on the direct and indirect connections, and a “dependency” effect which gives information on the relations of one part of the system to other parts, that is, the autonomy. To measure such types of effects, it considers sub-systems of the system characterized by the technical coefficients matrix A, or the Leontief inverse matrix L, of Organisation for Economic Co-operation and Development (OECD) countries.
García Muñiz, Morillas Raya, and Ramos Carvajal (2006) proposes a set of measures to identify key sectors of an economy based on a sector’s total effect, immediate effect or speed of transmission, and mediative effect. These effects are defined in the cited paper as capturing the influence of exogenous changes and relations between sectors for a reference sector. Total effects are related to the number and length of the paths between sectors through the productive relation. The measure immediate effects captures the idea that “effects are transmitted over lengthy sequences of economic relation have less immediacy than those sectors with short sequences of effects transmission” (García Muñiz et al., 2006, p. 7). To calculate the immediate effects the authors consider the Markov chain associated to the normalized matrix of input-output coefficients that shows the probabilities of passing from one sector to another in a given number of steps. Finally, the mediative effect captures that sectors that are part of many paths connecting other sectors may affect the indirect relations between these sectors. Sánchez-Juárez, García-Ándres, and Revilla (2015) apply the total, immediate, and mediative effects measures of García Muñiz, Morillas Raya, and Ramos Carvajal (2006) to provide a diagnosis of the key sectors of the Mexican economy. Their results suggest that efforts should focus on manufacturing sectors. However, Gurgul and Lach (2018) raised some problems with the interpretations of this set of measures. Authors discuss the García Muñiz, Morillas Raya, and Ramos Carvajal (2006) approach and examine the mathematical premises of their proposition and formal applicability. They show that the algebraic properties of the measures proposed are not applicable to any economic system framed with the input-output model.
Blöchl (2011) studies the structure of OECD economies and identifies the most central sectors by calculating two measures of centrality based on random walks: Random walk centrality, which is a generalization of the closeness concept and is defined as the inverse of the average mean first passage time to a given node; and counting betweenness which is a generalization of Newman’s random walk betweenness for directed networks with self-loops. This measure counts the number of times a given node is visited on first passage walks averaged over all sources-target pairs. Finally, McNerney, Fath, and Silverberg (2012) computes the node through-flow in OECD economies, which measures the size of an industry as a fraction of the money that flows through that industry and identifies the community structure of such economies.
Soyyiğit and Çırpıcı (2017) study the network structure of nine countries in different levels of development including Mexico using input-output data from the World Input-Output Database (WIOD). In the paper, the authors identify core sectors in terms of in and out flows of goods calculating the authority and hub scores of nodes in the network. The authors found that sectors organize in core-periphery structure, and identify which sectors play the role of hubs. They relate this to the degree of development of the economy.
Tomar (2017) studies whether the network structure of intersectoral connections is important for the diffusion of shocks over time. It shows that when time is introduced, the feedback loop that amplifies a sectoral shock no longer completes. Therefore, the linkages between different sectors are no longer contemporary, and aggregate volatility due to sectoral shocks can be insignificant. The author develops a multi-sectoral model where different sectors have different horizons and use inputs from different periods of time.
Tsekeris (2017) uses input-output data to identify key sectors for the Greek economy based on network metrics to measure the centrality and influence of sectors. The author also performs an analysis of clusters and found that the Greek economy is assembled into six groups of sectors: 1) trade and other services; 2) construction and supporting manufacturing sectors; 3) agriculture, food industry and tourism activities; 4) chemical and pharmaceutical industries and health services; 5) transport, and 6) energy. The key sectors the author identified were products and services related to information and communication, construction materials, agricultural products, food and tourism, support transport and water transport services, and electricity production and distribution and mining.
We focus on identifying the strategic sectors that diffuse the effects of shocks on final demand. We relate the sectors that generated the highest aggregate effect and diffusion to the most central sectors. We compute weighted degree centrality or strengths and authority and hub scores. These scores rank the nodes according to their importance in the link structure where they are embedded in. As with the eigenvector method, these measures consider that not all connections are of the same importance. Our contribution is to propose a diffusion measure and to apply this measure to identify key or strategic sectors in an economy. This contribution complements the literature mentioned above, in particular the input-output literature on key sectors.
For our analysis, we use the 2012 Mexican intermediate demand table to calculate the direct input coefficients matrix, the Leontief inverse, and to represent the economy as a network. This network representation is a weighted directed graph with self-loops where sectors are nodes and the economic relationships taking place through the supply and demand of inputs are the links that connected them together. We compute centralities and propose a diffusion measure based on the Herfindahl concentration index (Herfindahl, 1950) to study how the effect of the shock on final demand is heterogeneously distributed and, thus, may affect a few or many sectors according to the sector that originally received the shock. Then, we ranked the sectors according to the resulting scores and diffusion. Results showed that the sectors with the highest ranking can be viewed as strategic sectors because they can diffuse the effects of shocks to a large part of an economy and, at the same time, generate a high aggregate effect. Importantly, these sectors are highly central in the input-output network. The ranking according to the diffusion measure and the aggregate effect can be used as a tool to identify strategic sectors in the economy suited for selective promotion when the government is aiming at a high aggregate impact and a wide diffusion of the effect among sectors, instead of concentrating the effect on a few. Conversely, the ranking of sectors could be used to design policies against a wide diffusion of negative shocks.
The paper is organized as follows. Section two presents data and methods, where we detailed the database we used and the measures we computed for the analysis. Section three presents the results for the Mexican economy. On section four we discuss the results and the final section concludes.
2. Data and methods
We used the 2012 Mexican input-output table provided by the Instituto Nacional de Estadística y Geografía (INEGI) published in 2013. In particular, we used the symmetric domestic table for 259 branches with data in million Mexican pesos in basic prices. This classification of sectors corresponds to the four-digit North American Industry Classification System (NAICS) code.
2.1. Input-output analysis
According to the input-output model, total output of a sector x i is expressed as a function of the demand for the different commodities produced in the economy (Leontief, 1936). Define the technical coefficients as the ratio of input supplied by sector i and bought by sector j over the output of sector j, aij = zij/xj. In matrix form, production is defined as follows:
where x is the n×1 column vector of output, A = [a ij ] is the n×n matrix of direct input coefficients, f is the n×1 column vector of final demand, and L = (I - A)-1 is an n×n matrix known as the Leontief inverse or the total requirements matrix.
We can compute total output of all individual sectors as a function of the direct input coefficients matrix and final demand. The final demand of the exogenous sector is constituted by household consumption, government consumption, exports, and capital formation.
To evaluate the effects of a shock on final demand of a given sector we compute the change in production of each sector that is needed to compensate an increase in final demand of sector i. We normalized the effect of a change in final demand by the size of the change to compare across sectors. The total effect of a shock on final demand is computed as the i-th column sum of the L matrix, as if the shock was equal to one. This aggregate effect is equivalent to the output multiplier well known in input-output analysis (Miller and Blair, 2009). Nevertheless, this is an aggregated measure. Therefore, we propose a measure that shows how this aggregated effect is distributed across sectors according to the sector that originally received the shock.
2.2. Measure of diffusion
We are interested in studying how the effect of a sectoral shock is distributed heterogeneously across sectors. According to the sector that originally received the shock, the effect may concentrate on one or a few sectors, or it may be diffused over many sectors. With the information contained in the Leontief inverse matrix, we propose to compute a measure of the diffusion properties of a sector based on the Herfindahl concentration index ( Herfindahl, 1950). This index for the input-output network is defined as follows:
where s i is the fraction of the effect of the shock absorbed by sector i in each case, l ik is the ik-th entry of the Leontief inverse, and n is the number of sectors in the economy. To capture the diffusion properties of sectors, we compute d i = (1 - h i ) for each sector, where a high d i means good diffusion properties or low concentration of the effect. Conversely, a low d i means bad diffusion or a high concentration of the effect on one or a few sectors.
We simulate a sector receiving a shock on final demand and calculate the aggregate effect and its diffusion. We perform one simulation for each sector, so we execute as many simulations as sectors in the economy, where a sector receives a shock only once. Therefore, we obtain a set of 259 scenarios and compare. We then rank sectors according to the results of each scenario. At the top of the ranking we will find the sector that generated the highest aggregate effect and the highest diffusion.
2.3. The input-output network and its structural properties
We compute a set of measures to relate those sectors that generated the highest aggregate effect and diffusion to the structural properties of the network. The measures we compute are centrality measures for the input-output network.
A network is a set of nodes or vertices i∈N connected by edges or links (ij)∈E. The direct input coefficients matrix, A, gives rise to a weighted directed graph with self-loops. This graph is the network representation of the economy with the A matrix as the weighted adjacency matrix. Figure 1 shows how to represent the economy as the input-output network. Every row of the input-output table is a node in the network and every cell represents a weighted link between nodes. Values of the diagonal of the A matrix represent self-loops and capture a sector using its own output as input (see Figure1).
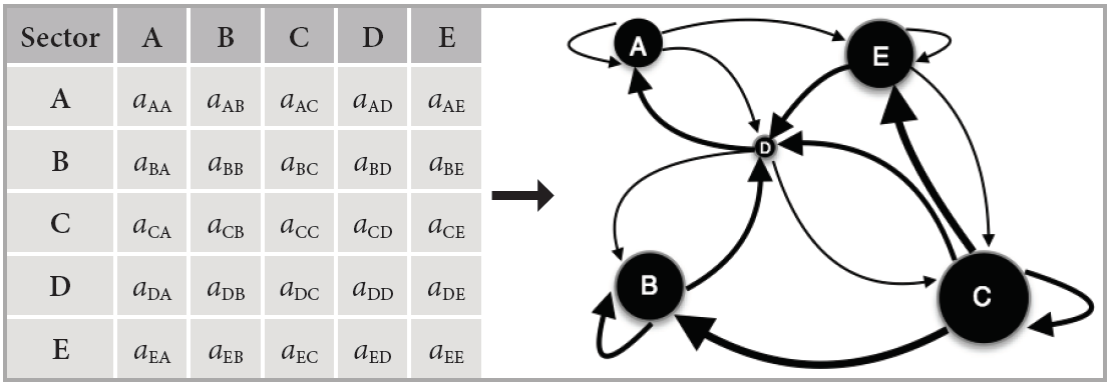
The adjacency matrix A has entries a ij > 0 when sector i is connected to sector j, where a ij is the ij-th element of the direct input coefficients matrix. When a ii > 0 sector i has a self-loop of magnitude a ii . Since the network is directed, the adjacency matrix is asymmetric therefore we have a ij >a ji . A directed and weighted network, such as the input-output network, is by definition represented by an asymmetric adjacency matrix where a ij ≠ a ji . If a ij ≠a ji , the network would not be directed. Even though there might be some special cases in the input-output network where a ij ≠ a ji , that is, when sales from i to j are of the same amount as the sales from j to i, this is not generally the case.
We consider all links between nodes, that is, all the coefficients of the matrix. Therefore, we do not impose a threshold on the magnitude of the links. When considering the diffusion of shocks, even the smallest coefficients that represent the weakest links could be important to diffuse the effect of a shock from one part of the economy to another one that was relatively isolated.
To study the structural properties of the sectors in the network we compute centrality measures. There are several different centrality measures in the literature. One finds two measures that evaluate the number and magnitude of the connections between nodes: Instrength and outstrength. These are computed as the row and column sum of the weighted adjacency matrix. Therefore, these measures are equivalent to the direct backward and forward linkages, computed by the column and row sum of the direct inputs coefficients matrix respectively. A more informative measure is one that considers direct and indirect connections such as the total linkage measures found in the input-output analysis. But total linkages are not considering that not all connections are of the same quality, where a node with a smaller number of links of high quality may outrank one with a larger number of mediocre links (Newman, 2010).
In the input-output literature, Dietzenbacher (1992) proposed the eigenvector method to measure linkages considering the fact that connections should be weighted according to their importance, where “inputs from a sector with high linkages receive a larger weight than inputs from a sector with lower linkages” (Dietzenbacher, 1992, p. 420). Backward linkages are the dominant eigenvector of the input coefficients matrix A, and forward linkages are the dominant eigenvector of the output matrix G. The linkages computed with the eigenvector method involve an iterative process, with A k and G k where k → ∞.. As other linkages measures, this process considers direct and indirect interactions, although with the eigenvector method the interactions are appropriately weighted to account for connections of different importance. For more information see Midmore, Munday, Roberts (2006), who highlight the different ranking of key sectors obtained using the eigenvector method compared to other more conventional approaches.
Backward linkages computed with the eigenvector method are related to the eigenvector centrality in network analysis. This centrality satisfies Ax = λx, where A is the adjacency matrix and the input coefficient matrix in input-output analysis, and λ is the largest eigenvalue. Eigenvector centrality was first proposed by Bonacich (1987) as a power measure in social networks. Another interpretation of the eigenvector centrality is given in Borgatti (2005), where it can be interpreted as an accessibility index. Finally, McNerney (2009) adapted the eigenvector centrality to the input-output network to measure the likelihood of finding a random dollar in each particular sector. The eigenvector centrality of node i, x i , is proportional to the sum of the centralities of i’s neighbors (sectors directly connected to i) in the following form:
According to the directionality of the connection of a node, one can compute the right and the left largest eigenvector of the adjacency matrix. However, eigenvector centrality for directed networks, which have an asymmetric adjacency matrix such as the one we are studying, has problems for computing the centrality of nodes outside strongly connected components, which receive scores of zero (Newman, 2010). A strongly connected component is “a maximal subset of vertices such that there is a directed path in both directions between every pair in the subset” (Newman, 2010, p. 144). Dietzenbacher (1992) discusses the issues of the eigenvector method and notes that one of the issues is “(…) the eigenvector method is capable of detecting the presence of clustered sectors. Whenever this applies, it is likely that the size of the indicator is magnified for some sectors, while it is reduced for some other sectors. (…) the rankings and the global pattern of the indicators present very plausible results, also as they do in the case where the sizes of the indicators seem sketch an extreme picture” (Dietzenbacher, 1992, p. 436). This issue is related to the problems of the eigenvector centrality raised by Newman. Thus, it is interesting and relevant to consider a measure that can correct these under- and over-estimations of the size of the indicator. Nodes that are highly independent from other nodes would have a centrality of zero even if these sectors are connected to other sectors. To get around this problem Kleinberg (1999) proposed to compute authority and hub scores for directed networks. Authority and hub scores were originally applied to study the link structure of web pages through the hypertext induced topic selection (HITS) algorithm. These scores are also considering that not all connections are of the same importance and are weighted accordingly. Specifically, they are based on the idea that important hubs in the network have a directed link pointing towards an important authority and an important authority has a directed link coming from an important hub. There is, thus, a circular definition which is turned into an iterative computation, where initially the scores of each node i are h i = a i = 1. Then, the iteration process updates the scores according to:
where b ij is an element of the binary adjacency matrix B with elements if b ij = 1 there exists a directed link from node i to node j, that is if a ij ≠ 0, and b ij = 0 otherwise, h i is the hub centrality of node i and a i is the authority centrality of node i. In matrix form we have:
where B T is the transpose of B, h is the vector of hub centralities, and a is the vector of authority centralities.
The authority and hub scores for all nodes update in each round, incorporating the new weights, where nodes that are pointed by other nodes with high scores or that point to nodes with high scores get a high score as well (Kleinberg, 1999). The process is iterated k number of times, where k → ∞, to take into account all possible rounds. The authority centrality of a node is, then, proportional to the sum of the hub centralities of the nodes that point to it, and the hub centrality of a node is proportional to the authority centrality of the nodes it points to (Newman, 2010). Until convergence, we perform:
These equations can be simplified by substitution as follows:
The BB T and B T B matrices are symmetric, positive semidefinite and nonnegative. The iterative algorithm that one applies for the computation of the scores is the power method for computing the dominant eigenvector for the matrices BB T and B T B (Langville and Meyer, 2005). The authority and hub scores are given by the eigenvector of BB T and B T B with the same eigenvalue. As in the case for the eigenvector centrality, the centralities are given by the eigenvector corresponding to the largest eigenvalue. The authority and hub scores are characterized by the following equations (Kleinberg, 1999):
where I is the identity matrix, λ is the largest eigenvalue, and 1 is a column vector of ones.
Authority and hub scores provide a ranking of sectors based on the link structure between input buyers and suppliers. Nevertheless, they are not computing the amount of input needed to produce or the amounts of output re-used in the production process. Therefore, the relevant information we obtain is an ordering of sectors. The scores are not computing the cumulative magnitude of the effect. Magnitudes are considered in the aggregate effect and the diffusion measure we propose.
A sector with a high hub score (a good hub) supplies inputs to other sectors, directly or via intermediary sectors that use the product of sectors on a previous position of the production chain as input. This good hub need not be the one with most connections in the production network (universal input supplier) but has important ones. At the same time, it supplies inputs to sectors with high authority scores (good authorities). These sectors are important buyers of inputs; these inputs may have incorporated outputs of intermediary sectors. Through these input-output connections, if a sector receives a shock on final demand, the effects of such a shock are channeled from one sector to others, up and down production chains. If the effect reaches a good hub, this sector can diffuse the effect to sectors it supplies inputs to, and one of these sectors could be a good authority. Consequently, the effect of a shock may not travel linearly in only one direction of a production chain but may go from one production chain to another through these good hubs and authorities. As a result, the ranking of sectors acknowledges that there are positive feedback effects in the production network.
The characteristic structure analysis in the input-output literature imposes a threshold above which they consider the existence of a link between two sectors (Miller and Blair, 2009; Aroche-Reyes, 2002). Distinctively, the structural properties analyzed with the computation of authority and hub scores do not require imposing any thresholds.
3. Results
The Mexican 2012 input-output network has 259 sectors and 19,800 interactions that represent a network density of 0.25. We measure the performance of a sector as its production value in million Euros, which defines the sectors’ size. The distribution of sector’s size in the year under study is highly positively skewed, meaning that in the economy predominate small sectors (see Figure 2). The top ten sectors according to size are in order: Wholesale trade of food and groceries, real estate without intermediation, oil and gas extraction, oil and carbon derivatives manufacturing, residential construction, freight motor transport and automobile manufacturing, freight motor transport in general manufacturing, motor vehicles’ parts manufacturing, nonresidential construction, Schools for basic, middle, and special needs education.
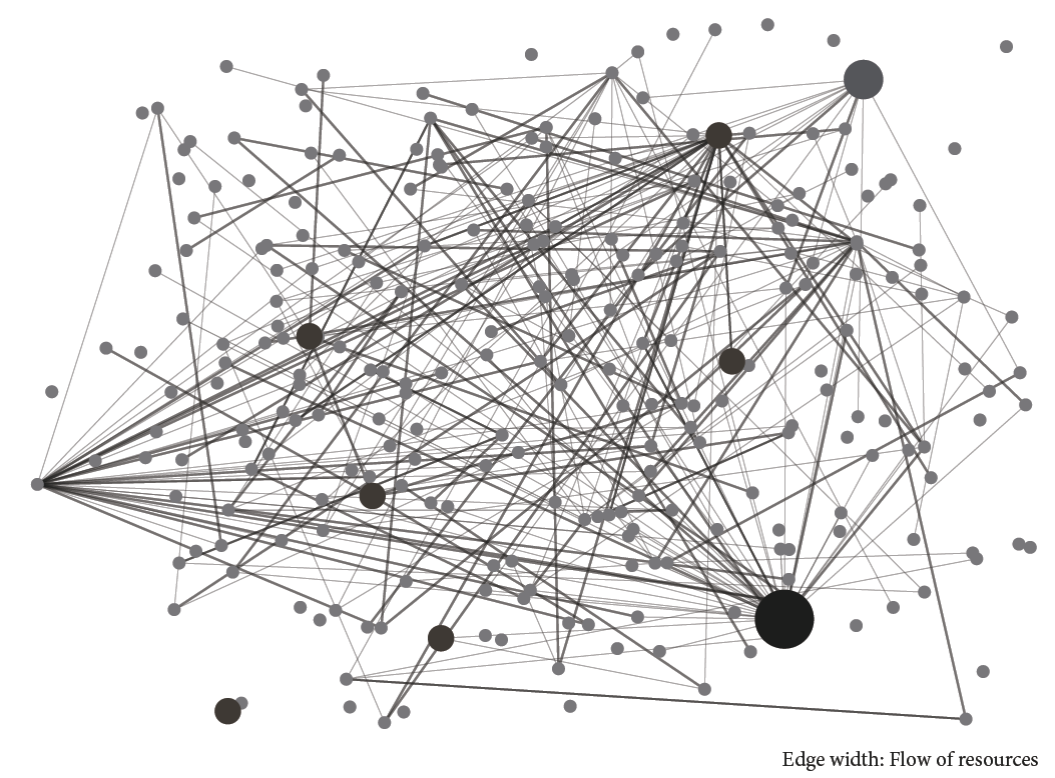
Note: nodes are sectors, node size represents production level, and links are technological relationships connecting the sectors. We included in the figure only the strongest connections for illustration purposes.
Figure 2 Network representation of the Mexican economy in 2012
The structure of the Mexican economy is highly asymmetrical having skewed distributions of both the number and the intensities of the interactions among sectors (see Figure 2). Most of the sectors have many weak connections and a few strong ones. The strongest connections are among the following couple of sectors: Oil and carbon derivatives manufacturing and collective foreign passenger transport of fixed route; food and groceries wholesale trade and collective foreign passenger transport of fixed route; slaughter, packing, and process of cattle meat, fowl and other animals and self-service restaurants, fast food and other limited services restaurants; oil and carbon derivatives manufacturing and services related to water transport; employment services and services related to water transport; rent without real estate intermediation and services related to water transport; motor vehicle parts manufacturing and collective foreign passenger transport of fixed route; accounting, audit and related services and collective foreign passenger transport of fixed route.
Table 1 shows the top ten ranked sectors according to the strength and the authority and hub scores, where the number one is the top ranked sector. The ranking of sectors according to the two types of measures is different. Nevertheless, there are at least five sectors that appear in the ranking of both types of measures although in different order. According to the ranking, there are only a few sectors having very high scores. This allowed us to identify the most central sectors in the Mexican economy.
Table 1 The top 10 most central sectors in the Mexican economy according to different measures
| Instrength | Outstrength | Authority scores | Hub scores | |
|---|---|---|---|---|
| 1 | Collective foreign passenger transport of fixed route | Petroleum and carbon derivatives manufacturing | Fertilizers pesticides and other agrochemicals | Collective foreign passenger transport of fixed route |
| 2 | Services related to water transport | Food and groceries wholesale trade | Railway transport | Services related to water transport |
| 3 | Self-service restaurants, fast food and other limited services restaurants | Employment services | Research protection and security services | Self-service restaurants, fast food and other limited service restaurants |
| 4 | Food and groceries wholesale trade | Leasing without real estate intermediation | Pharmaceutical product manufacturing | Wired telecommunication operators |
| 5 | Wired telecommunication operators | Accounting and audit and related services | Generation transmission and distribution of electric energy | Leasing without real estate intermediation |
| 6 | Leasing without real estate intermediation | Slaughter, packing, and process of cattle meat, fowl and other animals | Computer systems design and related services | Groceries and food wholesale |
| 7 | Hospitals of other medical specialties | Generation, transmission and distribution of electric energy | Car, truck and other rental | Freight motor transport |
| 8 | Athletes and professional sports teams | Motor vehicles parts manufacturing | Mold of melted metallic pieces | Athletes and professional sport teams |
| 9 | Multiple Banking | Business management services | Paint, covering and adhesives manufacturing | Hospitals of other specialties |
| 10 | Medical offices | Corporations | Nonferrous metals industry except aluminum | Collective urban and suburban passenger transport of fixed route |
To reveal the relation between the structural properties of the economy and the effects of a shock, we computed the aggregate effect of a shock on final demand and its diffusion among sectors throughout the economy. We, then, classified sectors with the highest effect on production and with the widest diffusion of the effects of a shock and compared this classification to the sectors with the highest centralities.
The top ten sectors with the highest aggregate effect on production were (aggregate effect in parenthesis): International and extraterritorial organisms (2.15), slaughter, packing, and process of cattle meat, fowl and other animals (2.13), tanning and leather (2.09), regular air transport (2.07), metallic covering and finishing (2.06), other passenger land transport (1.96), insurance and finance institutions (1.94), fish and seafood preparation and packing (1.90), dairy product manufacturing (1.89), laminated and agglutinated wood manufacturing (1.86). Comparably, the sectors with the lowest aggregate effect were: Computers and periphery equipment manufacturing, audio and video equipment manufacturing, independent artists, writers and technicians, and homes with domestic workers.
The top ten sectors with the best diffusion were (diffusion measure in parenthesis): International and extraterritorial organisms (0.770), tanning and leather (0.729), slaughter, packing, and process of cattle meat, fowl and other animals (0.727), metallic covering and finishing (0.722), regular air transport (0.704), insurance and finance institutions (0.698), laminated and agglutinated wood manufacturing (0.682), Non regular air transport (0.672), other passenger land transport (0.666), animals food manufacturing (0.665). On the contrary, the sectors with the worst diffusion were the sectors audio and video equipment manufacturing and homes with domestic workers.
To further study the relation between a high aggregate effect and a good diffusion of this effect we made a scatterplot. Figure 3 displays the scatterplot of sectors according to the magnitude of the aggregate effect on the x-axis and the diffusion of effects on the y-axis. The Spearman correlation coefficient is 0.9658 with a p-value=1.1458486466950524e-152;1 this is evidence of a very strong (monotonic increasing) relation between the two measures. Figure 3 shows a non-linear relationship between the two measures. This suggests that a higher aggregate effect comes with a more than proportionate increase in diffusion. Consequently, the sectors that generate a high aggregate effect will also diffuse this effect to a wide part of the economy. Input-output analysis tells us that sectors that could be targeted in a development strategy are those with above average total linkages. We complement this strategy and argue that one should choose those sectors that are at the top of the ranking according to diffusion; these will also have a high aggregate effect on production.
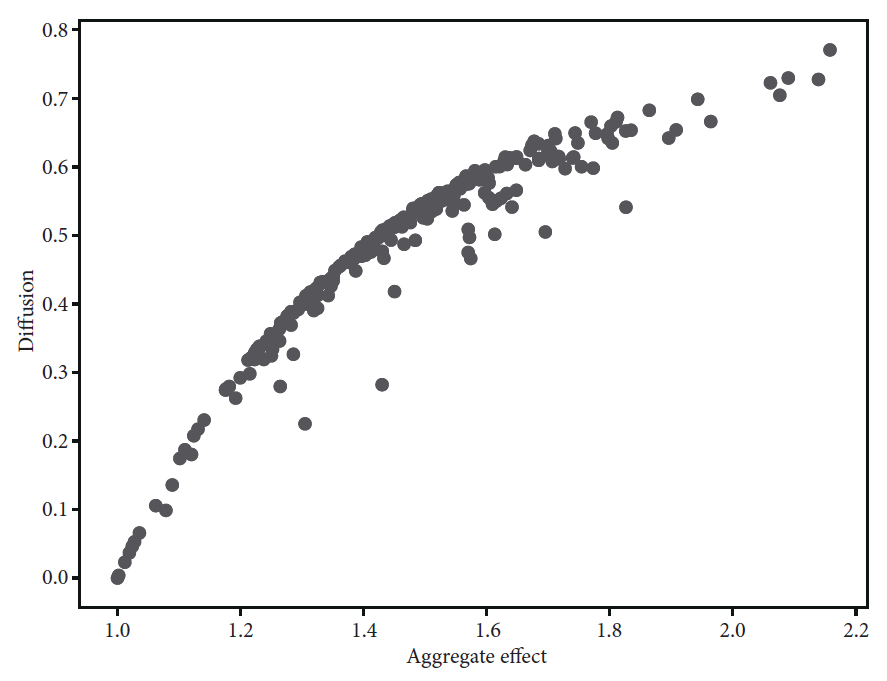
At the top right corner of Figure 3 we find 5 sectors with the highest aggregate effect and the best diffusion. Due to these properties, these sectors will be identified as strategic sectors that could be targeted in an industrial policy. By having the highest diffusion these sectors do not concentrate the effect of a shock on one or a few sectors, but diffuse or distribute de effect to many other sectors. The top five sectors of the ranking are: International and extraterritorial organisms; slaughter, packing, and process of cattle meat, fowl and other animals; tanning and leather; regular air transport; and metallic covering and finishing. We further analyze each case in the following lines.
The first case is international and extraterritorial organisms. There are 5 sectors that had the largest effect when international and extraterritorial organisms receive a shock on final demand: The latter had a strong self-loop and absorbed 46% of the effect of the shock; the sector petroleum and carbon derivatives manufacturing absorbed 6% of the shock; the sector financial institutions for economic promotion absorbed 5.2% of the effect; the sector generation transmission and distribution of electric energy absorbed 4% of the effect; and the sector treatment and supply of water absorbed 1% of the effect. Besides the self-loop, almost 40% of the effect was more evenly diffused across the other sectors in the economy. The sector international and extraterritorial organisms is not a highly central sector, but it interacts with sectors that are central in the input-output network such as petroleum and carbon derivatives manufacturing, and with the sector generation transmission and distribution of electric energy.
The second case is the sector tanning and leather. Itself absorbed 48% of the shock through a self-loop; the sector slaughter, packing, and process of cattle meat, fowl and other animals absorbed 15.7% of the effect; the sector wholesale trade of food and groceries absorbed 8.2% of the effect; the sector employment services that received 4.1% of the effect. The other 24% of the effect was diffuse to the other sectors. The tanning and leather sector is not in the top ten central sectors, but it is connected to highly central sectors such as slaughter, packing, and process of cattle meat, fowl and other animals, to wholesale trade of food and groceries, and to employment services. These connections represent channels of feedback effects that amplify the effects of a shock.
The third case is slaughter, packing, and process of cattle meat, fowl and other animals. After receiving a shock on final demand, the most affected sectors were: Itself with a self-loop that absorbed 49% of the effect of the shock; sector fowl exploitation that received 8.5% of the shock; sector cattle exploitation that absorbed 7.9% of the effect; sector wholesale trade of food and groceries that absorbed 7.5% of the effect; and sector seeds, oilseeds, legumes and cereals crops that had 3.1% of the shock. The other 24% of the effect diffuse more evenly among the other sectors. The sector slaughter, packing, and process of cattle meat, fowl and other animals is among the most central sectors according to the in-strength measure. By being a highly central sector, it has strong connections to other sectors and can diffuse the effect. Moreover, it is connected to other highly central sectors such as wholesale trade of food and groceries, and indirectly to self-services restaurants, fast food, and other limited service restaurants.
The fourth case is the sector metallic covering and finishing. When this sector experienced a shock on final demand, the following sectors received the highest effects: Metallic covering and finishing itself with a self-loop that absorbed 49.2% of the effect; steel and iron products manufacturing absorbed 13.8% of the effect; nonferrous metals except aluminum industry received 6.8% of the effect; metallic minerals mining absorbed 4.5% of the effect; generation, transmission and distribution of electric energy received 2.1% of the effect. 23% of the rest of the effect was more evenly diffuse across the rest of the sectors. The sector metallic covering and finishing is connected to the sector non-ferrous metals except aluminum industry and to the sector generation, transmission and distribution of electric energy that have high centralities.
Finally, the fifth case is when the sector wholesale trade of food and groceries received the shock on final demand. In this scenario, the most affected sectors were: Wholesale trade of food and groceries itself with a self-loop absorbed 80.7% of the effect of the shock; employment services absorbed 3.7% of the effect; 2.6% went to sector rent without real estate intermediation and sector generation, transmission and distribution of electric energy absorbed 1% of the effect. The rest of the effect, 12%, was more evenly diffused among the other sectors. Wholesale trade of food and groceries is among the most central sectors in the Mexican economy.
As we showed with the five cases described above, a shock on final demand of one sector may affect several different sectors further away. The most affected sectors vary widely according to the sector that originally received the shock on final demand. However, the sectors with high aggregate effect and diffusion appear as the most affected ones in most scenarios. We identify the sectors with these properties as strategic sectors.
The sectors at the bottom left corner of Figure 3 have the lowest diffusion and lowest aggregate effect, thus when they receive a shock the effect does not affect many other sectors. Examples of this situation are: The sector audio and video manufacturing that concentrated 99.8% of the effect of the shock; the sector artist writers and technicians absorbed 98.8% of the effect and home with domestic workers that concentrated 100% of the shock.
These cases and examples just described will have very different centrality measures. The sectors presented in the five cases are generally ranked in the top ten sectors according to the centrality measures. Additionally, some of these five sectors that have high aggregate effect and diffusion have direct and indirect connections to highly central sectors. For example, slaughter, packing, and process of cattle meat, fowl and other animals is connected to wholesale trade of food and groceries and to the sector self-service restaurants, fast food and other limited services restaurants.
4. Discussion
In this paper we used input-output data and proposed a diffusion measure to capture the linkage effects of a sectoral shock. We computed centrality measures to study the diffusion properties of sectors. The measures we computed uncovered the complex structure of the Mexican input-output network. This network has low density; thus, it is not highly connected. It displayed an asymmetrical structure where sectors have different roles and are organized in a hierarchy. The sectors with access to a wider part of the system, together with the sectors that can be reached by a wider set of other sectors, are at the top of the organization. Importantly, the ranking of sectors given by the strengths and authority and hub scores are not the same.
The relation between the aggregate effect of a shock and its diffusion across sectors revealed a few strategic sectors in the Mexican economy. These strategic sectors are generally the most central ones and, congruently, they interact with highly central sectors. These strategic sectors are connected to central ones through production chains that create channels to amplify the effects of shocks.
The relation between the rankings obtained with the aggregate effect, the diffusion measure and the centralities give insights about the structural properties of the economy. This information can be used in the policy making process to design a government intervention aiming at a high aggregate impact and wide diffusion of the resources among sectors, while facing a tight budget.
By computing different measures, we were able to identify strategic sectors that can diffuse the effects of a shock the widest and generate a high aggregate impact. We found that the Mexican network has only a few very central sectors. The existence of only a few very important nodes is a universal characteristic of all complex networks. These nodes greatly affect the network’s overall behavior because they make the network robust against accidental failures but vulnerable to coordinated or targeted shocks (Barabási, 2007). Such a structure allows targeted shocks to propagate from one sector to another making the economy fragile, such that a local shock could diffuse and cause a systemic-wide effect (Harmon, 2010). But this structure also allows good hubs and authorities to be good candidates for selective promotion because the effects of a stimulus will diffuse widely throughout the economic system.
According to the research question and the properties of the system, one may choose from the wide range of measures found in the literature, including direct or total linkages, linkages computed with the eigenvector method and network measures of centrality such as betweenness, closeness and eigenvector centrality. The diffusion measures we proposed complements this literature.
5. Conclusions
Our results showed that there are five key sectors in the Mexican economy in terms of diffusion and aggregate effect: International and extraterritorial organisms, slaughter, packing, and process of cattle meat, fowl and other animals, tanning and leather, regular air transport, metallic covering and finishing. This result highlights the importance of sectors not particularly associated to exports in the Mexican economy that could generate positive effects on economic growth. We also emphasize their different position and nature in the production system: Some are services and some are manufacturing.
The analysis of the diffusion properties of sectors showed that a development strategy should be associated with an industrial policy that develops a production structure through the stimulation of key sectors that have the best diffusion properties. Our investigation complements the existing literature on the identification of key sectors of an economic system. There are different extensions to our investigation. The analysis of diffusion of shocks can be further improved by exploring different types of shocks, shocks affecting only one of the components of the final demand and different centrality measures. Furthermore, a dynamic perspective, where changes in the technological relationships are explicitly modeled could further improve our understanding of the underlying mechanisms behind the network structure of an economy and its dynamics.

