


 nueva página del texto (beta)
 Inglés (pdf)
 Artículo en XML
 Referencias del artículo
 Enviar artículo por email
 Citado por SciELO
  Similares en
SciELO
Similares en
SciELO 
 Permalink
1. Introduction
Although the world has witnessed many monetary unification1 arrangements (Gros and Thygesen, 1998), the European Monetary Union (EMU) has attracted more attention than others, particularly when the Euro was created in 2002. The EMU is a union of 19 out of 28 members of the European Union. The EMU members met certain convergence criteria adopted in the Maastricht Treaty signed in February, 1992. Chown (2003) provides a detailed history of monetary arrangements in the world. One of the regional organizations that follow the footsteps of the European Union in terms of structure and operation is the Economic Community of West African States (ECOWAS)2. Established by the Treaty of Lagos on 28th May, 1975, ECOWAS members have undergone series of deliberations, meetings, and policies that would lead to creating a single currency to be called Eco, similar to Euro, among its members. One of the main purposes for its establishment is to have a common currency across all the members. The designated date for actualizing this vision is 2020. As the date is fast approaching, scholars and policymakers/advisors assess the level of preparedness of the member countries for the Monetary Union (MU). For example, the ECOWAS conducts a convergence survey every year in the form of Convergence Report. The report evaluates the members based on the convergence criteria adopted that are similar to those of the European Union.
Monetary unification entails three basic arrangements; common currency, common central bank, and hence common monetary policy (Plasmans et al., 2006). The theory that is often used in the monetary unification literature is the Optimum Currency Areas (OCAs), the development of which is attributable to Mundell (1961), McKinnon (1963) and Kenen (1969). OCA is one of the theories used to assess the costs and benefits of forming or joining a MU (Plasmans et al., 2006; Bayoumi and Eichengreen, 1997; Eichengreen and Bayoumi, 1996; Capie and Wood, 2003), or the nature of macroeconomic shocks among the members of a MU (De Grauwe, 2000; Khamfula and Huizinga, 2004; Chow and Kim, 2003; Zhao and Kim, 2009; Lee and Azali, 2012; Regmi, Nikolsko-Rzhevskyy and Thornton, 2015; Legrand, 2014).
Monetary unification comes with both benefits and costs. Members benefit from reduced transaction costs, end of the beggar-thy-neighbor policies, the elimination of exchange rate uncertainty, and more transparent price among other things (De Grauwe, 2000). A monetary union that meets OCA criteria tends to be beneficial to all members, otherwise, it is costly. Loss of country’s sovereignty over monetary policy, especially loss of control over monetary policy instruments/shock absorbers such as exchange rate and interest rate, is one of the major potential costs for the membership of MU. The magnitude of this cost is largely explained by the frequency, nature, and transmission of the shocks which impact the MU. If the nature of the shocks is asymmetric, the cost of joining an MU is substantial (Plasmans et al., 2006).
Despite the effort towards realizing the common currency among the ECOWAS region, very few empirical studies were conducted to assess the level of members’ preparedness. Moreover, these studies employ other methodologies than the Blanchard-Quah (BQ) decomposition and focus on CFA Franc Zone (CFZ)3 and West African Monetary Zone (WAMZ); see for example Hefeker (2010), Tsangarides and Qureshi (2008), Masson and Pattillo (2001), and Fielding and Shields (2005). This study joins other studies conducted to assess the fit of various established monetary unions such as the EMU, CFZ, and other proposed unions such as WAMZ, Association of Southeast Asian Nations (ASEANS) and pan-ECOWAS monetary union. It is devoted to assessing the suitability of forming an MU among the members of ECOWAS. It differs from other similar studies in terms of methodology, variables, data frequency and sample size. This paper investigates how ECOWAS countries respond to inflationary shocks as well as to output shocks using BQ decomposition in comparison to EMU. Following the OCA, this paper will evaluate the ECOWAS bloc in terms of symmetry of inflationary shocks and business cycle synchronization. It is expected that the outcome of this study will contribute to the current debate about the feasibility of creating the ECOWAS single currency, or/and at least guide the policymakers and governments of the ECOWAS members about the decision to join the MU. Furthermore, the outcome can help the governments of ECOWAS members determine their position on the cost-benefit ladder.
2. Overview of ECOWAS
The organization currently comprises fifteen member countries. They include Benin (BEN), Burkina Faso (BFA), Cote d’Ivoire (CIV), Guinea Bissau (GNB), Mali (MLI), Niger (NER), Senegal (SEN), Togo (TGO), Gambia (GMB), Ghana (GHA), Guinea (GUI), Nigeria (NGA), Sierra Leone (SLE), Cabo Verde (CPV) and Liberia (LBR) (see Masson and Pattillo, 2001). The West African Economic and Monetary Union (WAEMU) is made up of the first eight members, while the last two are not part of any monetary union. The remaining members comprise the WAMZ4. Some economic criteria known as convergence criteria, similar to Maastricht Treaty of the EMU, were adopted in the name of Decision A/DEC.17/12/01 in December, 2001. These criteria were modified in Supplementary Act A/SA/4/06/12 of 29 June, 2012 on convergence agreement and macroeconomic stability between ECOWAS Member States (ECOWAS, 2017).
The convergence criteria contain two categories, primary criteria and secondary criteria. The primary criteria stipulate that deficit-Gross Domestic Product (GDP) ratio should be less than 3 per cent, annual average inflation rate less than 10 per cent, gross external reserves greater than 3 months of imports. Only three member States, namely Guinea, Liberia and Nigeria met the first primary criterion as opposed to six in 2015, which were Benin (6.2%), Gambia (9.5%), Ghana (10.9%), Niger (6.1%), Sierra Leone (6.4%) and Togo (8.5%). As for the second primary criterion, only Ghana, Nigeria, and Sierra Leone recorded an inflation rate of more than 10% in 2016. In 2015, all ECOWAS members other than Ghana recorded an inflation rate of less than 10%. The Anglophone countries recorded higher inflation rates. The higher inflation rates could be attributable to the depreciation of the currencies of these members in 2015 and 2016. The target of the third primary criterion was previously six months of imports, but was reduced to three months of imports in 2015. In 2016, only Gambia (2.4 months), Ghana (2.8 months) and Guinea (1.4 months) did not meet this criterion. Nigeria (6.5 months) and Cabo Verde (6.4 months) had the largest coverage of imports in both 2015 and 2016 (ECOWAS, 2017).
The secondary criteria require debt-GDP ratio to be lower than 70 per cent, Central bank financing of the budget deficit should not be above 10 per cent of the previous year’s tax revenue, and variation of nominal exchange rate to be within the band of ±10 per cent. Only Cabo Verde (128.6%), Gambia (117.3%) and Togo (79.4%) have not met the first secondary criterion. Guinea, Nigeria, Gambia and Sierra Leone did not meet the second criterion. Regarding the third secondary criterion, three currencies in 2016, compared to two in 2015, experienced an average variation outside the ±10% band. The affected currencies are Guinea franc (16.4%), Nigerian naira (23.5%) and Sierra Leone leone (19.1%) as reported by ECOWAS (2017).
3. Literature review
This section reviews the existing literature about the theory and methodology employed to analyze the level of preparedness of members of economic blocs that aim to form an MU. As mentioned earlier, OCA is the most common theory used to investigate the suitability of forming an MU among countries. The preconditions of forming an MU guided by the OCA include that the shocks across countries have to be symmetric (Mundell, 1961), the economies need to be open (McKinnon, 1963) as well as well-diversified (Kenen, 1969). Furthermore, Plasmans et al. (2006) suggest that fiscal integration plays an important role in actualizing an MU. Regmi, Nikolsko-Rzhevskyy and Thornton (2015) and Hsu (2010) listed the major empirical methodologies for operationalizing the OCA: assessing the convergence criteria of the MU candidates (Agbeyegbe, 2008), assessing the (a)symmetric nature of macroeconomic shocks (Chow and Kim, 2003), analyzing the correlation of macroeconomic variables of the potential MU members (see, for example, Rana, 2007).
Employing fractional integration and cointegration as econometric methodology, Alagidede, Coleman, and Cuestas (2012) find the existence of significant heterogeneity in the behavior of inflation among the WAMZ countries. They suggested that policy coordination should be enhanced among the members’ central banks before embarking on an MU. Debrun, Masson and Patillo (2005) develop and calibrate a model in which the incentives to join an MU is provided by the negative spillover from the independent monetary policy. They conclude that lack of fiscal convergence is the main obstacle to forming an MU in West Africa. Their conclusion contradicts the findings of other studies that asymmetric shocks or low level of regional trade are the main obstacles for creating the MU. Fielding, Lee, and Shields (2004) use correlation analysis to argue that monetary integration among the members of CFA Franc Zone foster the extent of macroeconomic integration. Tsangarides and Qureshi (2008) apply both soft and hard clustering algorithms on some variables, selected based on OCA and convergence criteria, in order to investigate the suitability of an MU among WAMZ as well as ECOWAS countries. Their cluster analysis shows significant dissimilarities among the MU candidates, especially the WAMZ countries. They further question the feasibility of including Ghana and Nigeria in WAMZ as they appear to be singletons, while other member countries tend to group together. Hefeker (2010) investigates the interactions of fiscal policy, structural reform, and monetary union. He proved that symmetric monetary policy causes fiscal authorities to adopt a distortionary fiscal policy, hence reducing their structural reform effort. He further argues that asymmetric monetary union causes further polarization among the member countries. Kunroo (2015) provides a comprehensive survey on OCA literature.
Houssa (2008) examines the asymmetric shocks of monetary union in West Africa. Based on a dynamic factor model, the outcome of the study reveals that correlations of supply shocks among West African countries are negative and low, and that correlations of demand shocks are more similar among the Francophone countries of the region. Chuku (2012) investigates whether West Africa should proceed with creating a common currency. The results of the structural vector autoregressive (VAR) indicate that symmetry in the responses of economies to external shocks is high and that correlations of their demand, supply and monetary shocks are asymmetric. Usman and Ibrahim (2012) examine how ECOWAS can benefit from foreign direct investment (FDI) based on European Union experience. The study shows that the main factors that have been contributing to FDI flows within the euro-zone include single currency, research and development, trades and exchange rate stability.
In the light of the foregoing literature review, it could be safe to argue that no study employs BQ decomposition to analyze the level of preparedness of the ECOWAS members based on inflationary and output shocks. The studies that utilize this methodology mostly focus on the Asian countries (see Lee and Azali, 2012; Chow and Kim, 2003; Hsu, 2010) and the European countries (see Legrand, 2014; Boivin, Giannoni, and Mojon, 2008; Eichengreen and Bayoumi, 1996). Although Chuku (2012) uses structural VAR, the study focuses on other forms of shocks than inflationary shocks. It is believed that employing BQ decomposition can provide further insight into the suitability of the ECOWAS members to form a full-fledged MU.
4. Data and methodology
International Financial Statistics (IFS) provides the monthly series of Consumer Price Index (CPI)5, which is used to calculate the inflation rate. GDP at constant 2010 dollars6 is obtained from the database of World Development Indicators (WDI) of the World Bank, while GDP measures output; annual percentage change in CPI measures the inflation level. As quarterly series of GDP is not available, this study employs its annual series for the analysis.
The measure of output is similar to Hsu (2010) and Regmi, Nikolsko-Rzhevskyy and Thornton (2015). This paper follows Mallick and Mohsin (2016) and Alagidede, Coleman, and Cuestas (2012) for the calculation of the inflation rate. The CPI monthly series is available from January 1988 to December 2017, and the GDP series covers the period 1967 to 2016. Specifically, inflation is calculated as the twelfth lag difference of natural logarithm of CPI, similar to Mallick and Mohsin (2016) 7.
Global inflation (GI) and regional inflation (RI)8 are calculated from the global CPI (RGCPI) and regional CPI (RCPI) respectively. The United States of America (USA) and the United Kingdom (UK) are taken as global economies, as they are considered to be the dominant players in the international arena. Some studies consider the USA to represent the global economy (see for example Chow and Kim, 2003; Regmi, Nikolsko-Rzhevskyy and Thornton, 2015). However, in this study, UK is included as part of the global economy due to its influence on the Anglophone West African countries as members of Commonwealth. France, even though is influential on Francophone West African countries, is not included as part of the global economy, because it is one of the EMU members. Due to a lack of CPI data, only eight ECOWAS countries and ten EMU countries are considered. In terms of the ECOWAS, the countries include Cote d’Ivoire (CIV), Nigeria (NGA), Burkina Faso (BFA), Niger (NER), Senegal (SEN), Gambia (GMB), Ghana (GHA) and Guinea Bissau (GNB). For the EMU, the countries are Austria (AUS), Belgium (BEL), Cyprus (CYP), Finland (FIN), France (FRA), Greece (GRE), Italy (ITA), Malta (MLT), Luxemburg (LUX) and Portugal (POR).
Global output (GO) is represented by the world GDP9 obtained from the WDI. For the ECOWAS GDP data, four new countries [Benin (BEN), Liberia (LBR), Sierra Leone (SLE) and Togo (TOG)] are introduced, but Nigeria is dropped because its GDP serves as the regional output (RO). For the EMU GDP data, two countries (Cyprus and Malta) are dropped due to the lack of data. The GDP of the Euro Area is used as a proxy for EMU regional GDP10. Therefore, the GDP of eleven countries and ten countries are considered for ECOWAS and EMU respectively.
For the data analysis and estimation, this study uses long-run restrictions to identify the structural global shocks (GS), regional shocks (RS) and domestic shocks (DS). This form of identification is based on the Blanchard and Quah (1989) decomposition which is also adopted by Chow and Kim (2003), Hsu (2010) and Regmi, Nikolsko-Rzhevskyy and Thornton (2015). Specifically, the model involves estimating the following equation:
where ξ ij represent the coefficients of the endogenous variables, specifically global inflation (GI), regional inflation (RI) and domestic inflation (DI); λ ij (L) is the coefficient matrix of lagged endogenous variables, λ ii are the coefficients for the dummy variables d it and ε it is the white-noise error term.
Equation [1] can be represented compactly as:
where Ξ represents the matrix of coefficients of the endogenous variables, Λ is the matrix of coefficients of the lagged endogenous variables, and Γ is the matrix of coefficients of the dummy variables.
Or in reduced form:
where ψ =
Equation [2] is a stationary and stable VAR with vector X t containing the endogenous variables. The set of dummy variables is represented by D t , which captures the break dates for GI, RI and DI. The Greek letters Ξ and Λ are ℝ n(n matrices of parameters. Hence each of GI, RI, and DI depends on its own lag(s) and the lag(s) of other endogenous variables. Similarly, ε t is a vector containing the inflationary shocks, GS, RS and DS. A similar explanation holds when global, regional and domestic GDPs are used as the endogenous variables, but D t = 0 as there are no structural breaks in the output series. Equation [2] provides the compact representation of equation [1] and Equation [3 ] is the reduced form VAR. Three restrictions11 need to be imposed in order to identify Equation [1] using Cholesky decomposition, hence ξ12 = ξ13 = ξ23 = 0. After estimating Equation [2] in the form of vector moving average (VMA) expressed in Equation [4], long-run restrictions can be imposed on the impulse responses to identify the system:
where C ij = Ω(L) is a lag operator polynomial; therefore, Equation [4] can be represented compactly as:
For Equations [4] and [5] to be valid, the endogenous variables have to be stationary and the structural shocks have unit variance and are uncorrelated (Enders, 2015; Juselius, 2006; Lütkepohl and Krätzig, 2004). The additional restrictions needed for identifying this system of equations involve the following assumptions12: 1) Domestic economies are small open economies; 2) idiosyncratic shocks of domestic economies have zero long-run effects on both regional and global economies, and 3) regional shocks have no long-run impact on the global economy. Hence, three additional restrictions such that C 12 = C 13 = C 23 = 0 are required to recover the shocks in Equation [4]. This form of restriction corresponds with the long-un restrictions suggested by Blanchard and Quah (1989). For a detailed explanation about the BQ decomposition see Blanchard and Quah (1989) and Enders (2015).
5. Empirical results
All the inflation variables (GI, RI and DI) for both ECOWAS and EMU appear to be I(1), based on formal unit root tests developed by Phillips and Perron (1988) and Dickey and Fuller (1979). However, when structural breaks (SB) are taken into account, all the variables become stationary. The SB occurs at various dates, so a dummy variable is generated to capture each break date for each inflation variable. Each dummy series is equal to 1 for the specific break date and 0 otherwise. Formally D it = 1 for t = i and D it = 0 for t ≠( i. Table 1 reports the break date for each variable and its corresponding country or region. A VAR with two lags is estimated for the inflation model and one lag13 for the output model, both in the form of Equation [3]. Since inflation is I(0) for all the countries, its level is used for the estimation. However, the GDP for each country is I(1), but its logarithmic change is I(0), so the stationary variable is used for the estimation of the output model similar to Hsu (2010). All the VAR models meet the diagnostic requirements of homoscedasticity, non-autocorrelation and stability14.
Table 1 Inflation variables and their break dates
| ECOWAS | Break date | EMU | Break date |
|---|---|---|---|
| Burkina Faso | 1996M01 | Austria | 1993M12 |
| Cote d’Ivoire | 1995M04 | Belgium | 2012M08 |
| Guinea Bissau | 1997M08 | Cyprus | 1995M05 |
| Niger | 1992M11 | Finland | 1991M02 |
| Senegal | 1995M08 | France | 1991M11 |
| Gambia | 2004M07 | Greece | 1993M05 |
| Ghana | 2004M02 | Italy | 1995M06 |
| Nigeria | 1995M04 | Luxemburg | 1990M01 |
| ECOWAS | 1996M12 | Portugal | 1990M10 |
| Global inflation | 1991M12 |
Source: Authors’ computation. M stands for month, for example, M01 is January.
The main tools of econometric analysis in this article are impulse response, variance decomposition and correlations of shocks. The former is used to observe the behavior of domestic responses to regional and global shocks. If the responses have the similar pattern, then an MU is beneficial, and vice versa. Variance decomposition helps in isolating the magnitude of shocks for and from each of the endogenous variables. Both impulse response and variance decomposition are generated after imposition of the long run restrictions.
5.1. The impulse response of domestic inflation
The purpose of this section is to observe how domestic inflation responds to both RS and GS. The paper follows Regmi, Nikolsko-Rzhevskyy and Thornton (2015) to report the temporary shocks and Hsu (2010) in order to perform sensitivity analysis based on observing the permanent shocks. If the members of a monetary union respond to a given shock in a similar way, then common monetary policy could be used to address the consequence of the shocks, otherwise each member country has to use its own monetary policy to address the shock. In essence, if the members’ responses to a given shock are similar, then monetary unification is beneficial, otherwise it is costly.
Figure 1 presents the temporary response of domestic shocks to regional inflationary shocks. The top panel is for the ECOWAS countries and the bottom panel for the EMU members. It is not surprising to see that Niger, Cote d’Ivoire, Senegal and Burkina Faso have similar paths of temporary response, though with different magnitude, to the regional inflationary shocks; they are all Francophone countries with a common currency, West African CFA (XOF). Although the response of Ghana is much lower than that of Nigeria, their paths of response are very similar. The path of response of Guinea Bissau lies in-between the paths of Francophone and Anglophone countries. However, it is closer to the paths of its fellow WAEMU members. The Gambian path of response is unique, regional shocks cause its inflation to fall. This could be ascribed to the fact that the Gambian Currency, the Gambian dalasi (GMD), is stronger than other currencies in the region, except for the Ghanaian Cedi (GHS). The paths of most of EMU countries are similar, except for Finland and Malta. The reason for this is that both the countries are service-based economies (Böwer, Salas, and Ugazio, 2018) and the latter joined EMU in January 2008.

Figure 2 presents the temporary response of the ECOWAS and EMU members to global inflationary shocks, in the top and bottom panel of the figure respectively. From the top panel, the paths of Nigeria, Ghana and Gambia rise and fall together, because they are all Anglophone West African countries. The paths of their Francophone counterparts show a similar response to the global inflationary shocks. The path of Guinea Bissau is unique, possibly because it is the only Lusophone ECOWAS country, hence the low level of integration with the region. A Global inflationary shock leads to an increase in inflation in the Anglophone West African countries, but causes the opposite in the Francophone countries. Looking at the bottom panel, it can be seen that all the EMU countries show a similar pattern of response to global inflationary shocks, except for Greece, Portugal, Italy, Cyprus, and Malta. The first four behave this way due to the debt crisis, while the response of Malta could be attributable to its service-dominated economy.

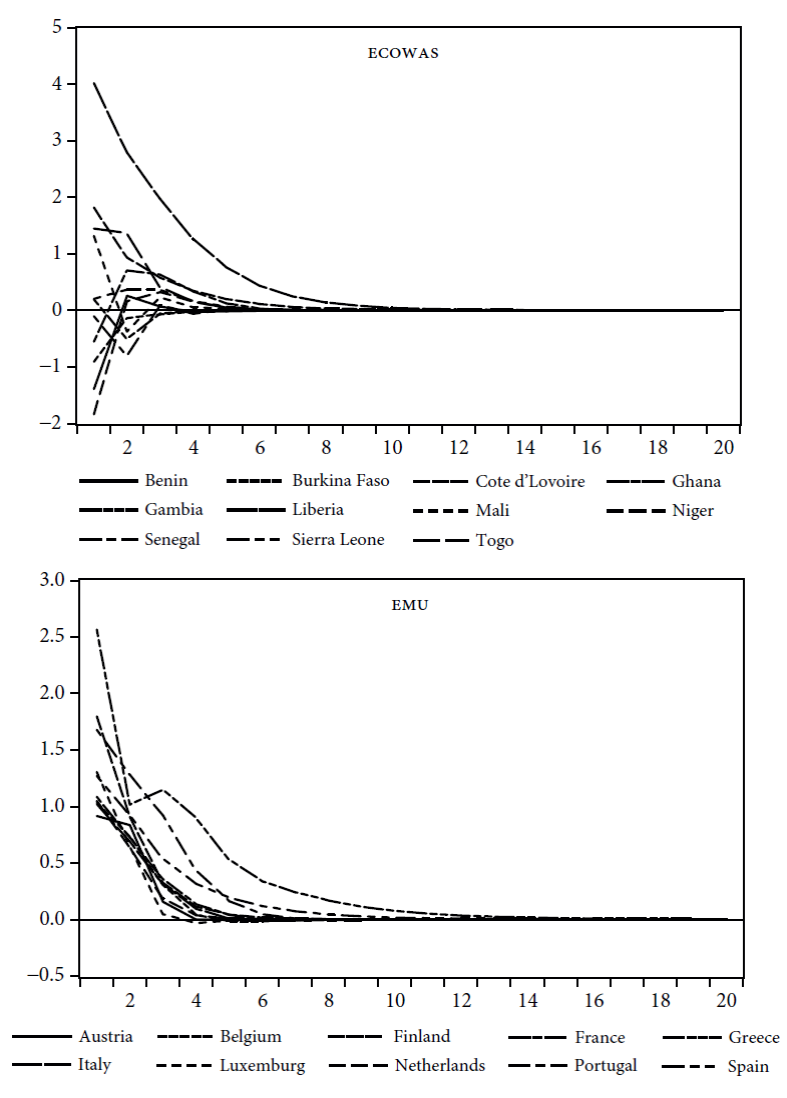
5.2. The impulse response of domestic output
For the sake of sensitivity analysis, this study performs a similar examination using GDP as the variable and Figure 3 presents the response of domestic shocks to regional and global shocks respectively. Sierra Leone, Cote d’Ivoire, Ghana, Niger, Gambia, Mali, Togo, and Senegal have analogous response to regional shocks, with the last three showing strong similarity. However, Burkina Faso appears to be unaffected by regional shocks. Liberia has exceptional response paths, largely due to its political instability. Benin shows a negative response to regional shocks partly due to Nigeria’s restriction on car import through its land borders. The bottom panel of Figure 3 describes how EMU countries respond to regional shocks. All countries show a similar response, except for Luxemburg and Finland. Greece’s response is larger than that of other countries because of its debt crisis.

The response of countries to global output is represented by Figure 4, with the top panel for ECOWAS and the bottom panel for EMU. Niger, Benin and Ghana have similar paths of response to global shocks, as do Senegal, Gambia, and Burkina Faso. The paths of Togo and Cote d’Ivoire rise and fall together. The path of Liberia is unique and so are the paths of Sierra Leone and Mali. As for the EMU countries, all the countries show similar paths of responses to global shocks.
Based on the foregoing analysis of inflation and output impulse responses, it is safe to admit that ECOWAS countries face asymmetric inflationary and output shocks. All the EMU countries have a symmetric response to global output shocks, but their responses to other shocks are asymmetric. Despite the asymmetry and various magnitudes of responses, EMU economies exhibit a better tendency towards OCA than the ECOWAS economies.
5.3. Variance decomposition of inflation
Tables 2 and 3 report the 2-month-ahead and 24-month-ahead variance forecast error of the inflation models. The idea is that a country should join an MU if regional shocks dominate, opt for autonomous monetary policy if the shocks are idiosyncratic, or peg its currency against the global currency if the forecast error variance is dominated by regional shocks (Regmi, Nikolsko-Rzhevskyy and Thornton, 2015; Chow and Kim, 2003). Table 2 reveals that, in the short horizon, the Francophone countries Burkina Faso, Cote d’Ivoire, Niger and Senegal are RS-dominated, where each has RS contributing more than 50 percent of its variability. On the other hand, the Anglophone countries Nigeria, Ghana, Gambia and the Lusophone country Guinea Bissau are DS-dominated, even though Nigeria has RS contributing about 43.17 percent of its variability. In the longer 24-month horizon, the Francophone countries and Nigeria are RS-dominated. However, GS contribute a very little percentage to the variability of the forecast error of all the ECOWAS countries. The interesting outcome is that the Francophone countries and Nigeria could be suitable for an MU, while the other members of ECOWAS should have an independent monetary authority.
Table 2 Variance decomposition of inflation, ECOWAS
| Country | 2-month horizon | 24-month horizon | ||||
|---|---|---|---|---|---|---|
| GS | RS | DS | GS | RS | DS | |
| Burkina Faso | 4.84 | 57.71 | 37.44 | 2.71 | 80.09 | 17.21 |
| Cote d’Ivoire | 3.31 | 58.88 | 37.81 | 2.17 | 83 | 14.83 |
| Guinea Bissau | 2.15 | 15.13 | 82.73 | 28.96 | 17.39 | 53.65 |
| Niger | 1.91 | 65.8 | 32.29 | 5.29 | 82.83 | 11.88 |
| Senegal | 1.32 | 82.33 | 16.35 | 2.02 | 86.01 | 11.97 |
| Gambia | 5.92 | 16.7 | 77.38 | 9.92 | 14.45 | 75.63 |
| Ghana | 9.79 | 0.41 | 89.8 | 7.46 | 25.3 | 67.24 |
| Nigeria | 1.57 | 43.17 | 55.26 | 0.89 | 65.77 | 33.34 |
Table 3 Variance decomposition of inflation, EMU
| Country | 2-month horizon | 24-month horizon | ||||
|---|---|---|---|---|---|---|
| GS | RS | DS | GS | RS | DS | |
| Austria | 7.3 | 12.39 | 80.31 | 29.41 | 12.26 | 58.33 |
| Belgium | 14.53 | 0.31 | 85.16 | 29.08 | 0.17 | 70.74 |
| Cyprus | 9.35 | 34.51 | 56.14 | 43.98 | 27.01 | 29.01 |
| Finland | 56.49 | 1.08 | 42.43 | 69.85 | 1.37 | 28.78 |
| France | 60.05 | 1.62 | 38.33 | 77.76 | 1.92 | 20.32 |
| Greece | 84.04 | 15.59 | 0.37 | 89.54 | 10 | 0.46 |
| Italy | 60.2 | 0.15 | 39.64 | 87.69 | 2.1 | 10.21 |
| Luxemburg | 43.3 | 4.22 | 52.48 | 63.26 | 7.38 | 29.36 |
| Portugal | 83.49 | 12.98 | 3.53 | 88.41 | 7.52 | 4.08 |
| Malta | 17.11 | 2.24 | 80.65 | 13.22 | 7.34 | 79.44 |
Table 3 reports the 2-month and 24-month variance forecast error of the inflation model for EMU. It is observable that Finland, France, Greece, Italy, and Portugal are GS-dominated, while Austria, Belgium, Cyprus, Luxembourg, and Malta are DS-dominated both in the short and long horizons. None of the EMU countries is dominated by RS.
5.4. Variance decomposition of output
Table 4 and Table 5 report the 2-year-ahead and 10-year-ahead variance forecast error of the output models. In Table 4, it is discernible that all the ECOWAS countries are DS-dominated, both in the short and long horizons.
Table 4 Variance decomposition of output, ECOWAS
| Country | 2-year horizon | 10-year horizon | ||||
|---|---|---|---|---|---|---|
| GS | RS | DS | GS | RS | DS | |
| Benin | 20.65 | 2.73 | 76.62 | 20.64 | 2.85 | 76.5 |
| Burkina Faso | 8.65 | 0.05 | 91.3 | 8.7 | 0.05 | 91.24 |
| Cote d’Ivoire | 19.6 | 5.3 | 75.1 | 20.47 | 6.05 | 73.48 |
| Ghana | 3.86 | 11.89 | 84.25 | 6.12 | 11.76 | 82.13 |
| Gambia | 2.6 | 6.36 | 91.04 | 2.63 | 6.38 | 90.99 |
| Liberia | 6.02 | 3.31 | 90.67 | 6.84 | 3.03 | 90.13 |
| Mali | 7.31 | 2.8 | 89.89 | 7.5 | 2.8 | 89.7 |
| Niger | 8.34 | 1.87 | 89.78 | 8.62 | 1.98 | 89.39 |
| Senegal | 4.63 | 3.57 | 91.8 | 4.66 | 3.56 | 91.78 |
| Sierra Leone | 0.27 | 18.6 | 81.13 | 0.52 | 18.61 | 80.86 |
| Togo | 12.65 | 0.48 | 86.87 | 13.17 | 0.49 | 86.34 |
Table 5 Variance decomposition of output, EMU
| Country | 2-year horizon | 10-year horizon | ||||
|---|---|---|---|---|---|---|
| GS | RS | DS | GS | RS | DS | |
| Austria | 41.04 | 9.86 | 49.1 | 41.23 | 9.82 | 48.95 |
| Belgium | 45.95 | 1.83 | 52.23 | 47.19 | 1.8 | 51.01 |
| Finland | 41.16 | 0.15 | 58.69 | 41.14 | 0.16 | 58.69 |
| France | 56.91 | 0.02 | 43.07 | 58.77 | 0.02 | 41.21 |
| Greece | 52.7 | 4.87 | 42.43 | 58.38 | 5.13 | 36.49 |
| Italy | 26.52 | 0.68 | 72.81 | 27.81 | 0.67 | 71.52 |
| Luxemburg | 18.45 | 5.23 | 76.32 | 18.47 | 5.23 | 76.29 |
| Netherlands | 42.65 | 2.7 | 54.65 | 42.39 | 2.63 | 54.98 |
| Portugal | 39.23 | 0.42 | 60.36 | 44.1 | 0.4 | 55.51 |
| Spain | 52.99 | 1.42 | 45.59 | 53.09 | 1.32 | 45.59 |
For the EMU, Table 5 shows that only Greece, France and Spain are GS-dominated in both the short and long horizons. On the other hand, Belgium, Finland, Italy, Luxembourg, Netherlands, and Portugal are DS-dominated, with Austria indicating a blend of GS and DS domination.
Instead of relying on BQ decomposition to recover the shocks, we also considered the Cholesky decomposition15 for sensitivity analysis. The impulse responses of both inflation and output models for both ECOWAS and EMU seem to have very similar paths to those generated from the structural VAR. Moreover, the paths of response to permanent16 output and inflationary shocks reveal information similar to the ones reported in this paper. Even though there is a little conflict between forecast error variances from the Cholesky decomposition model and those of the BQ model, the latter supersedes because the structural shocks are recovered based on economic intuitions. Moreover, the observation of forecast error variances at longer horizons does not contradict the results reported in Tables 2, 3, 4 and 5.
5.5. Correlation of the inflationary shocks
This section employs correlation to determine the symmetry or otherwise of inflationary and output shocks. The variables considered in this section of the study are the residuals from the structural VAR for each country. These residuals are taken to be the shocks; DS, RS and GS. If the correlation is zero, negative or small, then the shocks are asymmetric, but if they are strongly positive, then they are said to be symmetric (Hsu, 2010).
Panel A from Table 6 provides the correlation of domestic inflationary shocks for ECOWAS members. It is not surprising to see that the correlation of domestic inflationary shocks is small, zero and negative. This shows that different factors cause inflation across the ECOWAS countries. Correlation of regional inflationary shocks for ECOWAS is presented in panel B of Table 6. It can be seen that all the correlations are strongly positive and statistically significant. Therefore, the inflationary shocks across all ECOWAS countries are symmetric. Panel C of the same table contains the correlation of global inflationary shocks. It is also evident that the shocks are symmetric across all the ECOWAS countries, as the correlations are positive and strong.
Table 6 Correlation of inflationary shocks, ECOWAS
| Panel A: Correlation of domestic inflationary shocks | ||||||||
|---|---|---|---|---|---|---|---|---|
| Country | CIV | NGA | BFA | NER | SEN | GMB | GHA | GNB |
| CIV | 1 | |||||||
| NGA | 0.15 | 1 | ||||||
| BFA | -0.05 | 0.01 | 1 | |||||
| NER | 0.07 | 0.04 | -0.15 | 1 | ||||
| SEN | 0.09 | 0.18 | -0.06 | -0.07 | 1 | |||
| GMB | -0.17 | -0.21 | -0.24 | -0.14 | -0.22 | 1 | ||
| GHA | -0.08 | 0.04 | -0.14 | 0.13 | 0.01 | 0.11 | 1 | |
| GNB | -0.2 | -0.05 | -0.24 | -0.26 | -0.3 | 0.07 | 0 | 1 |
| Panel B: Correlation of regional inflationary shocks | ||||||||
| Country | CIV | NGA | BFA | NER | SEN | GMB | GHA | GNB |
| CIV | 1 | |||||||
| NGA | 0.77 | 1 | ||||||
| BFA | 0.93 | 0.81 | 1 | |||||
| NER | 0.94 | 0.82 | 0.98 | 1 | ||||
| SEN | 0.84 | 0.73 | 0.89 | 0.89 | 1 | |||
| GMB | 0.85 | 0.74 | 0.9 | 0.91 | 0.85 | 1 | ||
| GHA | 0.93 | 0.83 | 0.98 | 0.98 | 0.88 | 0.89 | 1 | |
| GNB | 0.91 | 0.8 | 0.94 | 0.95 | 0.86 | 0.85 | 0.95 | 1 |
| Panel C: Correlation of global inflationary shocks | ||||||||
| Country | CIV | NGA | BFA | NER | SEN | GMB | GHA | GNB |
| CIV | 1 | |||||||
| NGA | 0.98 | 1 | ||||||
| BFA | 0.98 | 0.98 | 1 | |||||
| NER | 0.98 | 0.98 | 0.97 | 1 | ||||
| SEN | 0.95 | 0.94 | 0.94 | 0.96 | 1 | |||
| GMB | 0.94 | 0.94 | 0.94 | 0.93 | 0.88 | 1 | ||
| GHA | 0.95 | 0.94 | 0.94 | 0.94 | 0.9 | 0.91 | 1 | |
| GNB | 0.98 | 0.97 | 0.97 | 0.96 | 0.91 | 0.93 | 0.93 | 1 |
Panels A, B and C of Table 7 summarize the correlations of inflationary shocks for EMU. The table reveals that the nature of the shocks for the EMU is similar to that of the ECOWAS; asymmetry of domestic inflationary shocks and symmetry of regional and global inflationary shocks. However, it is not surprising to see the strong positive correlation (0.65) of domestic inflationary shocks between Portugal and Greece, due to the fact that inflation in both countries could be associated with the debt crisis.
Table 7 Correlation of inflationary shocks, EMU
| Panel A: Correlation of domestic inflationary shocks | ||||||||||
|---|---|---|---|---|---|---|---|---|---|---|
| Country | AUS | BEL | CYP | FIN | FRA | GRE | ITA | LUX | MLT | POR |
| AUS | 1 | |||||||||
| BEL | 0.23 | 1 | ||||||||
| CYP | 0.01 | -0.22 | 1 | |||||||
| FIN | -0.3 | 0.09 | -0.28 | 1 | ||||||
| FRA | 0.1 | 0.28 | -0.18 | -0.05 | 1 | |||||
| GRE | -0.33 | -0.43 | -0.14 | 0.05 | -0.08 | 1 | ||||
| ITA | -0.07 | -0.16 | -0.06 | -0.01 | 0.02 | 0.11 | 1 | |||
| LUX | 0.19 | -0.02 | -0.27 | -0.07 | 0.06 | -0.15 | 0.06 | 1 | ||
| MLT | -0.1 | 0.16 | -0.2 | 0.01 | -0.16 | -0.57 | -0.28 | -0.1 | 1 | |
| POR | -0.35 | -0.33 | -0.25 | 0.12 | -0.02 | 0.65 | 0.25 | -0.02 | -0.56 | 1 |
| Panel B: Correlation of regional inflationary shocks | ||||||||||
| Country | AUS | BEL | CYP | FIN | FRA | GRE | ITA | LUX | MLT | POR |
| AUS | 1 | |||||||||
| BEL | 0.89 | 1 | ||||||||
| CYP | 0.84 | 0.94 | 1 | |||||||
| FIN | 0.83 | 0.88 | 0.87 | 1 | ||||||
| FRA | 0.9 | 0.98 | 0.93 | 0.88 | 1 | |||||
| GRE | 0.86 | 0.93 | 0.88 | 0.85 | 0.92 | 1 | ||||
| ITA | 0.9 | 0.98 | 0.93 | 0.87 | 0.98 | 0.93 | 1 | |||
| LUX | 0.91 | 0.98 | 0.93 | 0.88 | 0.98 | 0.92 | 0.98 | 1 | ||
| MLT | 0.81 | 0.81 | 0.81 | 0.69 | 0.84 | 0.77 | 0.84 | 0.83 | 1 | |
| POR | 0.91 | 0.96 | 0.92 | 0.88 | 0.97 | 0.92 | 0.96 | 0.97 | 0.81 | 1 |
| Panel C: Correlation of global inflationary shocks | ||||||||||
| Country | AUS | BEL | CYP | FIN | FRA | GRE | ITA | LUX | MLT | POR |
| AUS | 1 | |||||||||
| BEL | 0.83 | 1 | ||||||||
| CYP | 0.87 | 0.87 | 1 | |||||||
| FIN | 0.88 | 0.87 | 0.96 | 1 | ||||||
| FRA | 0.9 | 0.9 | 0.98 | 0.97 | 1 | |||||
| GRE | 0.46 | 0.53 | 0.53 | 0.48 | 0.51 | 1 | ||||
| ITA | 0.86 | 0.88 | 0.94 | 0.93 | 0.96 | 0.43 | 1 | |||
| LUX | 0.9 | 0.89 | 0.97 | 0.96 | 0.99 | 0.52 | 0.95 | 1 | ||
| MLT | 0.6 | 0.64 | 0.73 | 0.77 | 0.76 | 0.45 | 0.76 | 0.76 | 1 | |
| POR | 0.49 | 0.51 | 0.58 | 0.54 | 0.56 | 0.27 | 0.54 | 0.56 | 0.58 | 1 |
5.6. Correlations of output shocks
Table 8 presents the correlations of domestic output shocks, regional output shocks and global output shocks in panels A, B and C respectively. The only strong positive correlations in panel A include 0.55 between Niger and Burkina Faso, 0.45 between Senegal and Burkina Faso, 0.40 between Senegal and Mali, and 0.39 between Mali and Burkina Faso. This indicates symmetry of domestic output shocks among the Francophone countries. Panels B and C show that the regional and global shocks are symmetric across all the ECOWAS countries. On the other hand, Table 9 is the summary of the correlations of output shocks for the EMU. Panel A shows that domestic output shocks are symmetric across most EMU members. Greece exhibits little or no symmetry with the rest of the EMU members, as the correlations of its domestic shocks with other members are either small or negative. This implies that Francophone ECOWAS members have different business cycles from the Anglophone countries, while most EMU countries have similar business cycles.
Table 8 Correlation of output shocks, ECOWAS
| Panel A: Correlation of domestic output shocks | |||||||||||
|---|---|---|---|---|---|---|---|---|---|---|---|
| Country | BEN | BFA | CIV | GHA | GMB | LBR | MLI | NER | SEN | SLE | TOG |
| BEN | 1 | ||||||||||
| BFA | 0.19 | 1 | |||||||||
| CIV | -0.22 | 0.2 | 1 | ||||||||
| GHA | 0.3 | 0.13 | -0.15 | 1 | |||||||
| GMB | -0.34 | -0.2 | 0.2 | -0.14 | 1 | ||||||
| LBR | 0.09 | 0.36 | 0.09 | 0 | -0.05 | 1 | |||||
| MLI | -0.07 | 0.39 | 0.26 | -0.16 | -0.03 | 0.1 | 1 | ||||
| NER | 0.09 | 0.55 | 0.23 | 0.16 | -0.26 | 0.16 | 0.34 | 1 | |||
| SEN | -0.03 | 0.45 | 0.25 | -0.24 | -0.09 | 0.11 | 0.4 | 0.21 | 1 | ||
| SLE | 0.05 | 0.05 | 0.02 | 0.09 | -0.05 | 0.03 | -0.19 | 0.03 | 0.01 | 1 | |
| TOG | 0.05 | 0.09 | 0.1 | 0.1 | 0.02 | 0.32 | 0.01 | 0.11 | -0.13 | -0.04 | 1 |
| Panel B: Correlation of regional output shocks | |||||||||||
| Country | BEN | BFA | CIV | GHA | GMB | LBR | MLI | NER | SEN | SLE | TOG |
| BEN | 1 | ||||||||||
| BFA | 0.98 | 1 | |||||||||
| CIV | 0.96 | 0.96 | 1 | ||||||||
| GHA | 0.96 | 0.98 | 0.94 | 1 | |||||||
| GMB | 0.96 | 0.97 | 0.94 | 0.94 | 1 | ||||||
| LBR | 0.96 | 0.98 | 0.94 | 0.96 | 0.95 | 1 | |||||
| MLI | 0.99 | 1 | 0.97 | 0.98 | 0.96 | 0.98 | 1 | ||||
| NER | 0.96 | 0.98 | 0.92 | 0.96 | 0.95 | 0.97 | 0.98 | 1 | |||
| SEN | 0.96 | 0.98 | 0.96 | 0.96 | 0.94 | 0.96 | 0.98 | 0.95 | 1 | ||
| SLE | 0.91 | 0.93 | 0.89 | 0.92 | 0.87 | 0.9 | 0.92 | 0.91 | 0.91 | 1 | |
| TOG | 0.98 | 1 | 0.96 | 0.98 | 0.96 | 0.98 | 1 | 0.98 | 0.98 | 0.93 | 1 |
| Panel C: Correlation of global output shocks | |||||||||||
| Country | BEN | BFA | CIV | GHA | GMB | LBR | MLI | NER | SEN | SLE | TOG |
| BEN | 1 | ||||||||||
| BFA | 0.77 | 1 | |||||||||
| CIV | 0.71 | 0.89 | 1 | ||||||||
| GHA | 0.73 | 0.9 | 0.84 | 1 | |||||||
| GMB | 0.78 | 0.99 | 0.92 | 0.91 | 1 | ||||||
| LBR | 0.77 | 0.98 | 0.92 | 0.9 | 0.99 | 1 | |||||
| MLI | 0.75 | 0.95 | 0.92 | 0.91 | 0.97 | 0.97 | 1 | ||||
| NER | 0.77 | 0.99 | 0.9 | 0.91 | 0.99 | 0.99 | 0.96 | 1 | |||
| SEN | 0.75 | 0.98 | 0.93 | 0.91 | 0.99 | 0.99 | 0.98 | 0.99 | 1 | ||
| SLE | 0.77 | 0.99 | 0.92 | 0.9 | 0.99 | 1 | 0.97 | 1 | 0.99 | 1 | |
| TOG | 0.77 | 0.99 | 0.9 | 0.89 | 0.99 | 0.99 | 0.96 | 0.99 | 0.99 | 0.99 | 1 |
Table 9 Correlations of output shocks, EMU
| Panel A: Correlation of domestic output shocks | ||||||||||
|---|---|---|---|---|---|---|---|---|---|---|
| Country | AUS | BEL | FIN | FRA | GRE | ITA | LUX | NET | POR | SPA |
| AUS | 1 | |||||||||
| BEL | 0.67 | 1 | ||||||||
| FIN | 0.17 | 0.13 | 1 | |||||||
| FRA | 0.65 | 0.69 | 0.17 | 1 | ||||||
| GRE | 0.11 | -0.08 | 0.06 | -0.01 | 1 | |||||
| ITA | 0.58 | 0.66 | 0.19 | 0.65 | -0.15 | 1 | ||||
| LUX | 0.16 | 0.27 | -0.05 | 0.23 | -0.11 | 0.21 | 1 | |||
| NET | 0.66 | 0.61 | 0.21 | 0.57 | 0.06 | 0.65 | 0.33 | 1 | ||
| POR | 0.56 | 0.49 | -0.07 | 0.47 | 0.21 | 0.51 | 0.09 | 0.39 | 1 | |
| SPA | 0.44 | 0.47 | 0.31 | 0.44 | 0.23 | 0.39 | 0.26 | 0.51 | 0.31 | 1 |
| Panel B: Correlation of regional output shocks | ||||||||||
| Country | AUS | BEL | FIN | FRA | GRE | ITA | LUX | NET | POR | SPA |
| AUS | 1 | |||||||||
| BEL | 0.38 | 1 | ||||||||
| FIN | 0.58 | 0.72 | 1 | |||||||
| FRA | 0.4 | 0.71 | 0.61 | 1 | ||||||
| GRE | 0.58 | 0.77 | 0.94 | 0.66 | 1 | |||||
| ITA | 0.37 | 0.73 | 0.52 | 0.55 | 0.6 | 1 | ||||
| LUX | 0.59 | 0.81 | 0.94 | 0.69 | 0.99 | 0.64 | 1 | |||
| NET | 0.27 | 0.58 | 0.53 | 0.4 | 0.57 | 0.46 | 0.6 | 1 | ||
| POR | 0.56 | 0.67 | 0.72 | 0.52 | 0.83 | 0.55 | 0.83 | 0.37 | 1 | |
| SPA | 0.45 | 0.74 | 0.79 | 0.59 | 0.79 | 0.54 | 0.8 | 0.52 | 0.61 | 1 |
| Panel C: Correlation of global output shocks | ||||||||||
| Country | AUS | BEL | FIN | FRA | GRE | ITA | LUX | NET | POR | SPA |
| AUS | 1 | |||||||||
| BEL | 0.96 | 1 | ||||||||
| FIN | 0.99 | 0.96 | 1 | |||||||
| FRA | 0.99 | 0.98 | 0.99 | 1 | ||||||
| GRE | 0.86 | 0.84 | 0.84 | 0.85 | 1 | |||||
| ITA | 0.91 | 0.93 | 0.89 | 0.92 | 0.86 | 1 | ||||
| LUX | 0.96 | 0.96 | 0.96 | 0.97 | 0.82 | 0.9 | 1 | |||
| NET | 0.97 | 0.96 | 0.96 | 0.97 | 0.83 | 0.93 | 0.95 | 1 | ||
| POR | 0.99 | 0.97 | 0.99 | 0.99 | 0.83 | 0.91 | 0.96 | 0.96 | 1 | |
| SPA | 0.97 | 0.94 | 0.99 | 0.97 | 0.82 | 0.85 | 0.94 | 0.93 | 0.98 | 1 |
6. Policy implication and discussion
Based on the foregoing analysis, both the economic blocs (EMU and ECOWAS) do not satisfy the conditions provided by the OCA, hence they are not the ideal candidates for an MU. Both primary and secondary convergence criteria of ECOWAS show that the region as a whole is not yet ready for the MU, as some countries meet some criteria but fail to meet others. The same conclusion is also valid according to the empirical analyses of the impulse response, variance decomposition and correlations of shocks based on BQ and Cholesky. However, this does not necessarily rule out the possibility of forming an OCA-compatible MU among some of the ECOWAS countries. Despite the dominance of DS in the output forecast error variance of all the ECOWAS countries, Niger, Cote d’Ivoire, and Senegal seem to be closer to OCA than any other group of countries. Their inflation and output impulse responses are similar, their inflation forecast error variances are RS-dominated both in the short and long horizons, and the correlations of their domestic output shocks are positive. It is also found that inflation rates of all Anglophone economies respond positively to ECOWAS inflationary shocks, and that the inflation rates of all Francophone countries respond to the same shock in a similarly negative way. This suggests that the two sub-regions respond asymmetrically and that ECOWAS as a whole does not fit into an OCA. However, except for Gambia and Sierra Leone, the two sub-regions separately can be loosely OCA-compatible. Guinea Bissau is not ripe for any form of monetary unification; it should have its own independent monetary authority.
When looking at the output impulse response and variance decomposition, the picture is entirely different. Based on output model, no group of countries is close to an OCA. Although the responses to shocks across the EMU members are not symmetric, EMU appears to be closer to OCA-compatible MU than the ECOWAS. The reason for the asymmetry of shocks across these economic blocs can provide the basis for another study.
The outcome of this study is consistent with previous studies such as that of Alagidede, Coleman, and Cuestas (2012), which suggests that the behavior of inflation in the ECOWAS is heterogeneous. This study also shows that inflationary and output shocks across ECOWAS are idiosyncratic, similar to Chuku (2012). The paths of impulse responses of Ghana and Nigeria stand out from the rest, just as Tsangarides and Qureshi (2008) conclude that the two economies are “singletons”. Moreover, the said outcome does not contradict the findings of Hefeker (2010), Houssa (2008), and Debrun, Masson and Patillo (2005).
7. Conclusion
This study focuses on operationalizing OCA to investigate the preparedness of ECOWAS members to form an MU, as they envisage creating a common currency Eco by 2020. Inflation and output models are estimated, with the sample 1988:01 to 2017:12 for the former and 1967 to 2016 for the latter. Based on analyses of ECOWAS convergence criteria, impulse responses, variance decompositions and correlations of shocks of these two models, the conclusion is that a full-fledged pan-ECOWAS MU is not advisable. In other words, ECOWAS members as a whole are not well-prepared for actualizing the dream of creating the single currency. Additionally, the ECOWAS central banks cannot be coordinated for the fact that single monetary policy cannot address the idiosyncratic shocks among the member countries. Close examination of the impulse response and variance decompositions of the EMU reveals that although responses to shocks are not symmetric, the members provide a better fit for OCA than the ECOWAS members.
The findings of this study suggest some policy implications. Since ECOWAS members face asymmetric shocks, the following courses of action can help minimize the asymmetry of shocks among the ECOWAS members. First, it is not advisable for ECOWAS to create a single currency in 2020. Instead, more efforts should be directed towards creating a common currency for WAMZ first, before creating the Eco. Second, Ghana and Nigeria need to control their inflation, otherwise they should stay out of the WAMZ. Similarly, Guinea Bissau has to consider controlling its inflation in order to benefit from the membership of WAEMU. Third, Nigeria and Ghana should stop embarking on the beggar-thy-neighbor policy of devaluing their currencies as reported by ECOWAS (2017), their policies should take into account the desire to form the MU. Instead of devaluing their currency, Nigeria and Ghana can raise their domestic interest rates in a way that will attract capital inflow. This can lead to appreciation of their currencies, thereby reducing inflation. Fourth, ECOWAS should provide a fund for the countries that could be at disadvantage if the single currency is created. This would serve as an incentive for the affected countries to join the MU. Fifth, the Central Banks of ECOWAS members should begin the process of coordinating their monetary policies before creating the Eco.

