nueva página del texto (beta)
 Inglés (pdf)
 Artículo en XML
 Referencias del artículo
 Enviar artículo por email
 Citado por SciELO
  Similares en
SciELO
Similares en
SciELO 
 Permalink
JEL Clasificación: D31, D33, J3.
Classification: JEL D31, D33, J3.
Introduction
Since the crisis, political and academic concerns over inequality have considerably increased. Economists, sociologists and political scientists have investigated the role of increasing income inequality as a cause of the 2007-2008 crisis in the United States of America (USA) (e.g. Stiglitz, 2012), and in some cases of the euro crisis too. While there are big challenges in terms of data collection and harmonization, some studies started looking at the distributional impact of the crisis too.
In this field, extant literature focuses either on the distribution of income at the individual or household level (Jenkins et al., 2013), or on changes in factors’ income shares (Schlenker and Schmid, 2015). In contrast, studies linking the two perspectives are relatively rare (Corsi and Guarini, 2018).
In a notable exception, Atkinson (2009) focuses on the increasing share of capital incomes as a source of income inequality among individuals. However, the most popular contribution has been by Piketty (2014), who connected factor income distribution to personal income distribution at the international level over the long run. As is well known, Piketty’s main claim is that when the interest rate is higher than the rate of growth of real income, capital incomes tend to grow as a share of Gross Domestic Product (GDP), and inequality tends to increase. In Piketty’s words, the risk is of a return to ‘patrimonial capitalism’, and one notable solution may be raising top income tax rates.
In the political debate, Piketty’s book legitimated a very basic view of social conflict (D’Ippoliti, 2017): between few powerful ones (the top 1%) versus all the rest (the people). This message resonates with some key predictions of Marxian analyses, especially the law of the tendency to concentration of capital, and that of the proletarization of the masses. Alas, these predictions proved empirically shaky.
From a historical perspective, Atkinson, Piketty and Saez (2010) had already noted that a reduction in top incomes during the early XX century was indeed due to a fall in capital incomes, as Piketty’s later theory assumes, but the subsequent growth of the top 1% incomes since the 1980s has been caused mainly by an increase in (top) labour incomes ―which does not fit well with Piketty’s 2014 story. Moreover, from a geographical point of view Piketty’s approach seems especially fit to describe the USA experience―. For example, Brandolini (2010) notices that in the last few decades a peculiar increase in the income share of the top 1% has taken place especially in Anglo-Saxon countries, less so in Continental Europe.
From a theoretical point of view, Milanovich (2017) discusses how the nexus between capital’s income share and income inequality is non-trivial. Three conditions must be met for a growth in the capital share of income to imply an increase in income inequality: the rate of return to capital must be higher than that of income growth, income from capital must be concentrated among the richer households, and the income source that is less equally distributed must be correlated with overall income. In large part, the fulfilment of these conditions seems to be an empirical question. At the macro level there seems to be evidence of a nexus between capital’s income share and income inequality (Jacobson and Occhino, 2013; Piketty and Zucman, 2014). However, few studies have focused on the relation between functional and personal income distribution at the micro level, which is the focus of the present work and some previous ones (Cirillo, Corsi and D’Ippoliti, 2016; Corsi and D’Ippoliti, 2013).
Our analysis is inspired by the tradition of British Classical political economists, who defined the social classes according to their role played in the process of production (see e.g. Zacchia, 2016). Accordingly, we propose a typology of European households based on their prevailing source of income, rather than its level. By looking at households’ incomes at the European level since the crisis we highlight two main trends. First, in static terms, there is a relation between households’ functional income shares and households’ relative position in the income distribution. However, this relation is not as straightforward as implied by part of the literature. Second, in dynamic terms, we show that functional distribution significantly affects the chances of mobility within the income dis-tribution, and such impact was recently magnified by the crisis.
Class, inequality and the crisis
As is well known, mainstream economics is founded on methodological individualism and the assumption that fundamentally all individuals are equal (D’Ippoliti, 2011). These supposed “economic agents” ―at the same time consumers, savers, workers and owners of the means of production― are only distinguished by the degree to which they exhibit certain characteristics (preferences or constraints).
The misfortunes of Marxian economics may explain economists’ rejection of the concept of social class, but since long sociologists too have abandoned the concept of class as a meaningful tool to understand society (compare e.g. Giddens, 1994; Bauman, 1982). As a consequence, income inequality is usually studied from the point of view of the distribution of household or personal income distribution. Today, when mainstream economists speak of social classes they usually refer to loosely defined groups of people who belong to a certain quintile of the household income distribution. For example, Summers and Balls (2015) write, “the term ‘middle class’ is used interchangeably throughout this report with ‘low and middle income’” (p. 1). Indeed, sometimes even heterodox economists follow this practice: for example, Palley (2013) presents a three class model, encompassing workers, middle management middle class and top management capitalist class. In such model, Palley identifies the existence of three classes on the base of three cut-points in the personal income distribution (respectively corresponding to the 1%, 19% and 80% percentiles).
Traditionally, the two most authoritative mainstream explanations of high personal income inequality, and its persistence over time, have been: 1) the “race” between skills and technology (Goldin and Katz, 2008); and 2) the extraordinary rise of an élite of individuals, such as top managers or financiers (Atkinson, Piketty and Saez, 2010). On the one hand, Goldin and Katz (2008) argue that technological change increases the demand for skilled labour, and thus it increases the earnings gap between skilled and unskilled workers. This argument is often made empirically, by measuring skills through educational attainments. On the other hand, Atkinson, Piketty and Saez (2010) argue that there is something specific taking place at the top of the income distribution, which may have to do with changes in market forms and firms’ governance, winner-take-all politics and/or rises in the rents accruing to very rare “talents”.
Empirically, both explanations help understanding long-term trends in inequality, without necessarily being the whole story. The explanation based on the race between education and technology has the advantage of throwing light on the whole distribution of incomes. Indeed, it usually focuses on lower (unskilled labour) and middle (skilled labour) incomes, that is presumably the 99%, using the populist jargon. However, its main drawback is the neglect of capital incomes. By contrast, the explanation focusing on top incomes is of-ten framed in terms of contrasting the trends of labour and capital incomes. However, with its focus on the very top (the 1%), it does not allow to fully understand what happens to the middle class, or how the poor fare. Moreover, some authors (such as Palley (2013), mentioned above) sometimes seem to imply that capital incomes are the highest incomes, and labour incomes are the rest. As shown in the next section, at least in the European context this tenet has no empirical ground.
The 2007-2008 financial crisis and the ensuing Great Recession reinvigorated the debate, adding the further dimension of increased inequality both as a cause and as a consequence of the crisis. According to Bazillier and Héricourt (2014), the economic literature would be substantially unanimous in the identification of a causal nexus from income inequality to the growth of debt. This is associated to the empirical finding that credit booms are the prime determinant of financial crises, including the 2007-2008 USA crisis. However, Panico, Pinto and Puchet Anyul (2012) report more mixed evidence on the inequality-debt nexus, and develop a model in which the causality would be reversed: from the growth of finance to the dynamics of income shares (on which see Köhler Guschanski and Stockhammer, 2016).
Concerning the European crisis, Post Keynesian economists have explicitly linked increased income inequality with the accumulation of macroeconomic imbalances in the real sector. In particular, Hein (2012, 2013) pointed out the growing inequality of personal incomes and the lower share of national income accruing to labour as prime causes of increasing balance-of-payments imbalances, which in turn are often considered as the trigger of the European sovereign debt crisis in 2009.
However, concerning the impact of the crisis the evidence is more mixed. Bazillier and Héricourt (2014) conclude their review by noting that the economic literature has so far found a clear causal link from crises to poverty, but mixed results are found concerning the link from crises to inequality. In the European context, austerity policies have been explicitly linked to a further growth in inequality (e.g. by Green and Lavery, 2014), in particular due to the peculiar mix of restrictive fiscal policies, which reduce the size of the public sector and the redistribution of income, and expansionary monetary policies, which are likely to produce asset price inflation and thus disproportionally benefit the owners of financial assets. Bettio et al. (2012) further predict that austerity policies are likely to particularly impact on women and women-headed households, who are poorer than the average. However, this expectation has not yet been empirically documented (Botti, Corsi and D’Ippoliti, 2016).
The crisis has revived interest among mainstream economists for functional income distribution as well. A recent body of literature has documented a structural change in the factor shares during the second half of the xx century, towards higher profit incomes (Arpaia, Pérez and Pichelmann, 2009; Checchi and García-Peñalosa, 2010; ILO, 2013, van der Hoeven, 2014; Schlenker and Schmid, 2015).
As mentioned, some works linked the increasing share of capital incomes to the observed increase in personal or household income inequality (Adler and Schmid, 2013; Atkinson, 2009; Glyn, 2009). Thus, Schlenker and Schmid (2015) study the effect of changing capital income shares on inequality of gross household incomes, showing how the transmission of a shift in capital income shares into changes in the personal distribution of income depends on the concentration of capital income.
However, usually these works do not consider the relation between the two concepts at the micro level. In the European context, a major obstacle to that aim concerns the quality and nature of the data available at the international level, as explained in the next section.
Data and descriptive statistics
In order to investigate the functional and personal income distributions at European level, the reference dataset is the European Union Statistics on Income and Living Conditions (EU-SILC), a representative sample of the European population over 16 years old, harmonised across all European Union member states1.
Ideally, the study of households’ incomes over the crisis would require a longitudinal database. However, the EU-SILC longitudinal sample could not be employed here because: 1) it is only made available by Eurostat with a substantial European households’ incomes since the crisis delay; 2) due to privacy concerns, data for Germany are not included (whereas it is made available in the cross-sectional survey); and 3) each household is only observed for a maximum of four years. Therefore, we employ a comparison of the 2008, 2013 and 2015 cross-sectional waves of EU-SILC, respectively including households’ incomes in 2007, 2012 and 2014. 2007 is taken here as a reference of the pre-crisis situation, 2013 as the end of the European crisis, and 2015, the latest available at the time of writing, as a reference of the new normal of Secular Stagnation.
We consider two main sources of income: 1) income from capital: including interests, dividends, profits from investments in unincorporated businesses, income from rental of property or land, pensions received by individual private plans, and imputed rents; and 2) income from labour: i.e. gross employee cash or near cash income. Households’ income shares for these two sources of income are computed as ratios of yearly incomes over households’ total gross incomes. Monetary values are expressed in euro and deflated with the Consumer Price Index (CPI) provided by Eurostat. All values are expressed in euros 2013. Following Eurostat’s practice, household incomes are converted into equivalent incomes by the application of a modified Organisation for Economic Cooperation and Development (OECD) equivalence scale.
However, within EU-SILC, data on household gross incomes harmonized for all European Union countries also include: mixed incomes from self-employment, monetary transfers from the State and/or other public institutions (such as public pensions), regular inter-household cash transfers (such as alimony payments), and income received by household members aged under 16 (who are not directly surveyed in the sample). Accordingly, for each household the capital and labour income shares do not necessarily sum to one, and indeed in 2015 they only do for 12.83% of European households (14.05% in 2013 and 13.12% in 2008).
Accordingly, we define the various sources of households’ incomes as shown in Table 1.

Households’ incomes and income shares
As shown in Table 2, the vast majority of European households earn incomes from more than one source. The crisis did not significantly change this: both in 2008 and 2013 less than 1% of households earned capital incomes only, and less than 7% earned wages only. If anything, for households with only one source of income, most frequently it is neither capital nor labour incomes but rather public transfers. The respective values in year 2015 are significantly lower due to the incomplete representation of Member States in the 2015 wave (all countries will be present in future releases of the data), as it is shown by a comparison with the 2013 values considering the 2015 sample of countries.
Table 2: Distribution of European households by source of income
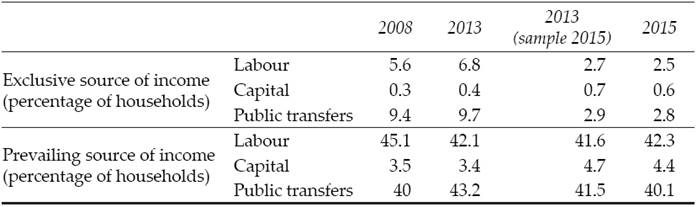
Notes: Due to data unavailability, only 13 countries are considered for year 2015 (Austria, Bulgaria, Denmark, Greece, Spain, Finland, Hungary, Island, Latvia, Netherlands, Norway, Portugal, and Slovenia).
Significantly, in all years more than half of European households (roughly 57%) earn some form of income from capital.
Considering households’ prevailing source of income, that is the relatively largest source of income for each household, it emerges that a bit more than 42% of European households earned their largest share of income from labour, with a 3% reduction from the pre-crisis level. They are the relative majority of households in the sample, but not the absolute majority. For roughly 40% of households, public transfers are the main source of income, and this category of household was the relative majority in 2013, at the peak of the crisis. Finally, for around 4% of European household’s capital incomes are the main source of income, with a slight increase since the beginning of the crisis.
Accordingly, with respect to the simplified scheme recalled in the introduction, a first major point to note is that only a tiny minority of households can be univocally described by their source of income. Moreover, the capitalist class may be somewhat smaller (if considering the exclusive sources of income) or larger (if considering the prevailing source) than the 1%, but the difference does not seem dramatic. However,
In contrast, the representation of a supposedly uniform 99% seems much more problematic. Indeed, it would be necessary to consider at least two distinct groups within it, one that mainly depend on labour, and one that is mostly dependent on public transfers.
Yet, households’ budget composition does not change very much over the period considered, namely the crisis did not reshape households’ budgets. Given the stability of households’ budgets, in the next section we aim to investigate how households, distinguished by source of income, fared since the crisis. As will be shown, the composition of a household’s budget significantly affected how did it fare since the crisis. What the present descriptive analysis aims to show, then, is that the social and political significance of this fact is less clear-cut than expected.
Indeed, considering the values of household incomes, the median values of labour and capital incomes and of public transfers are always below the respecting mean values. This underlies substantial concentration of households in the lower part of the various income distributions that is, most households receive incomes from labour, capital and public transfers below the average value. It emerges that capital incomes are on average lower but significantly more dispersed than labour incomes. Average public transfers lie in between the two other sources of income considered here, but surprisingly they exhibit a level of variability comparable to that of capital incomes. In real terms (at 2013 prices) both mean and median labour incomes consistently decrease during the period. Public transfers peaked in 2013, possibly due to automatic stabilizers, but were reduced again since then, with 2015 values even lower than the pre-crisis mean and median values. Finally, average capital incomes were reduced by the crisis and remained at lower levels (though with higher variability) in 2015, whereas after a reduction during the crisis in 2015 median capital incomes returned to pre-crisis levels.
Thus, comparing Tables 2 and 3 it emerges that income shares and real incomes denote broadly similar trends. This may be because, on average, a higher share of capital income corresponds to higher incomes from capital, and the same applies for wages. Thus, in 2013 the pairwise correlation between capital income shares and capital incomes was 0.56 and the correlation between the wage share and labour incomes 0.72 (both statistically significant at the 1% level).
Table 3: European households’ equivalent incomes
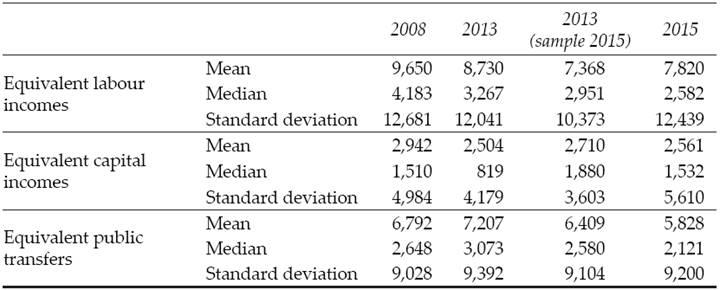
Notes: Values expressed in euros at 2013 prices. Due to data unavailability, only 13 countries are considered for year 2015 (Austria, Bulgaria, Denmark, Greece, Spain, Finland, Hungary, Island, Latvia, Netherlands, Norway, Portugal, and Slovenia).
However, both income shares and real incomes exhibit substantial variability too. To highlight this finding, in the heat map in Figure 1 we report for each source of income the respective joint empirical distributions of equivalent household incomes and their income shares (in the Figure, darker areas denote higher concentration of households). As shown in the heat map, a significant number of households earn low incomes, which nonetheless constitute high shares of their income. For example, in 2015 1.5% of households earned more than 70% of their incomes from capital, and yet their equivalent income did not exceed 15,625 €2. This result is partly driven by imputed rents, which weigh proportionally more among low-income households; however low- income households (e.g. pensioners) receive income from financial capital too.
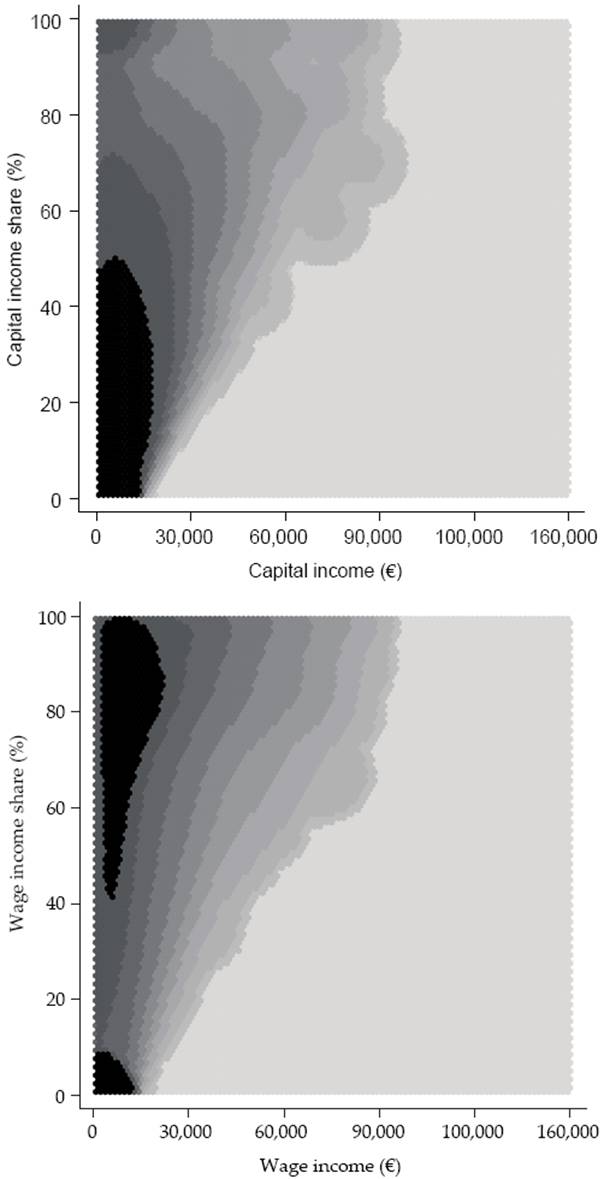
Notes: Kernel density estimation, Epanechnikov method. Darker regions denote higher density of households.
Figure 1: Distribution of the population by gross equivalent incomes and income shares, 2013
Such dispersion explains the evidence reported in Table 2, that is households’ mean and median labour incomes were higher than mean and median capital incomes throughout the period considered.
A framework for the analysis of income mobility
As mentioned, a major difficulty in investigating the relation between the household and functional distributions of income in dynamic terms is that no pan-European harmonised longitudinal sample of the required time span exists3. To overcome this limitation, we propose an adaption of the methodology developed within the literature on the vulnerability to poverty to consider vulnerability to inequality4.
To do so, we compute the probability of a household in a given decile of the income distribution at time t to fall into a different decile in t+1. We separately consider upgrades and downgrades, i.e. movements upwards and downwards in the income distribution, and estimate the impact of households’ sources of income on both kinds of movement.
Given the cross-sectional nature of the available data, in order to assess households’ mobility in the income distribution it is necessary to make inferences about household’s future income without observing it. For such a purpose, we draw on the studies by Chaudhuri, Jalan and Suryahadi (2002), Zhang and Wan (2006), Günther and Harttgen (2009) and Barrientos (2013). We thus estimate a measure of vulnerability to downgrading in the income distribution based on cross-sectional data.
Let us define a household h’s gross equivalent income at time t as:
 [1]
[1]
where X h,t are observable household characteristics, and e h,t idiosyncratic factors. We define the downwards income mobility of a household h that belongs to the i-th income decile at time t, denoted by d h,t , the probability that the household will lose its relative standing in the income distribution at time t+1, falling into a lower decile:
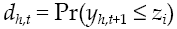 [2]
[2]
where z i is the lower bound of the i-th income distribution decile. Substituting [1] in [2], we rewrite household’s h downwards income mobility as:
 [3]
[3]
According to [3], a household’s income downgrade is the probability that the expected future income (y h,t+1 ), as explained by its observable characteristics at time t, will be below the threshold z i .
We assume that the stochastic process generating household h’s income is given by:
 [4]
[4]
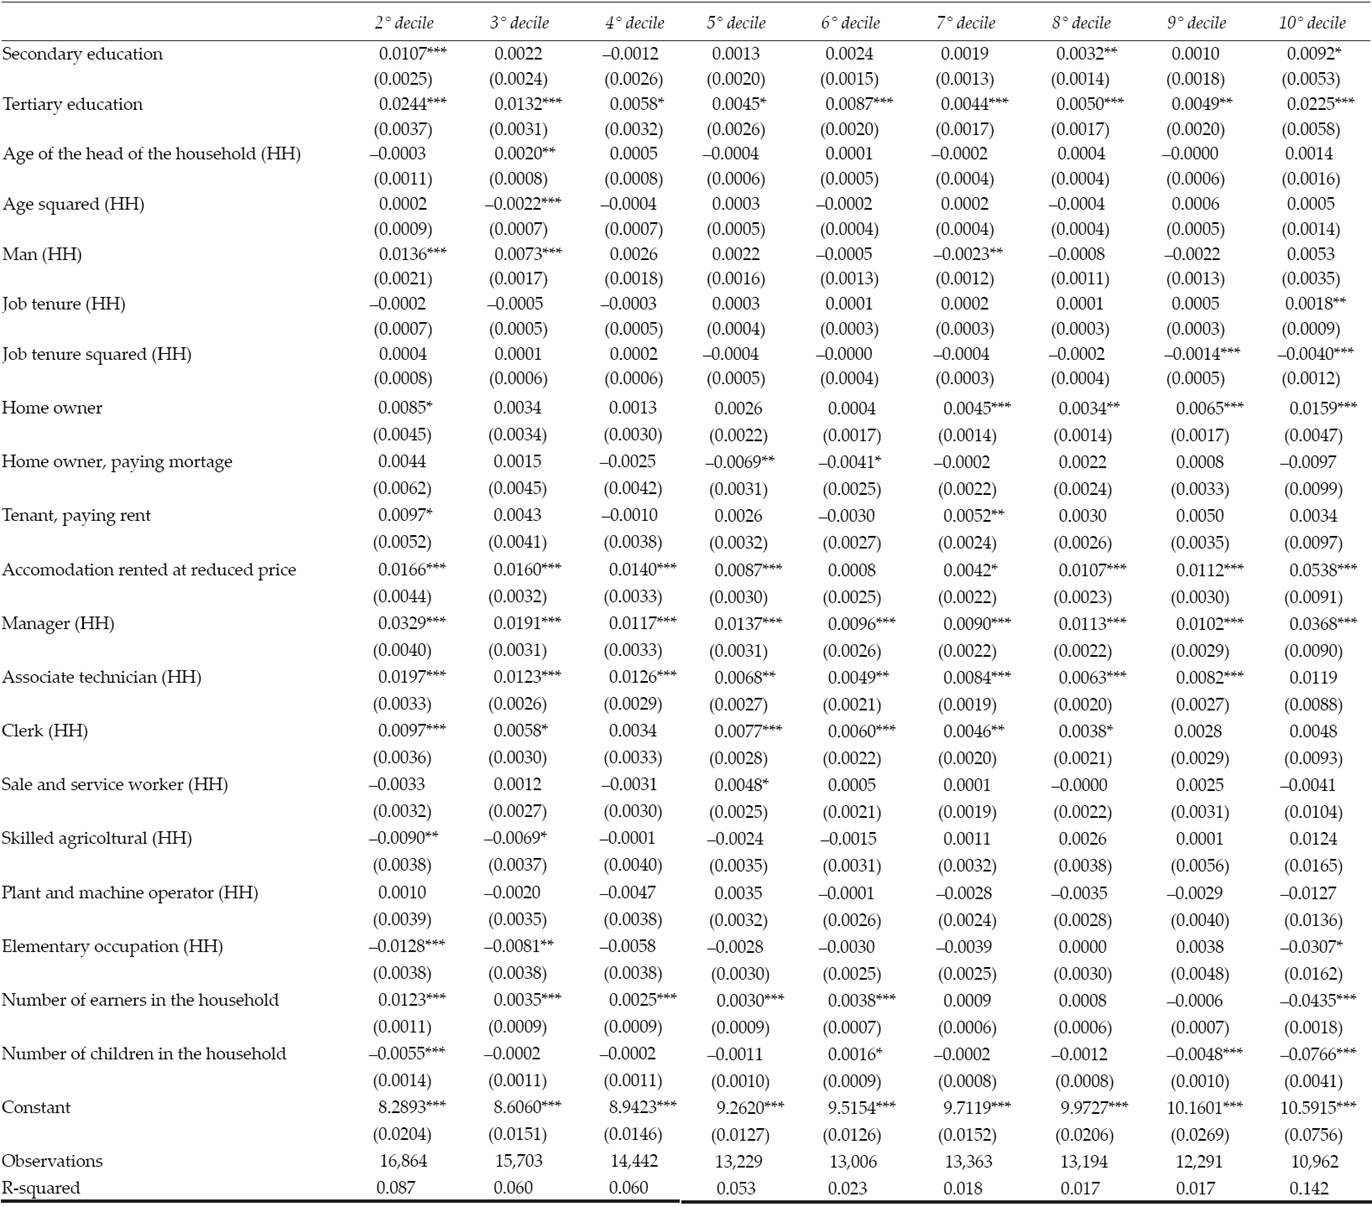
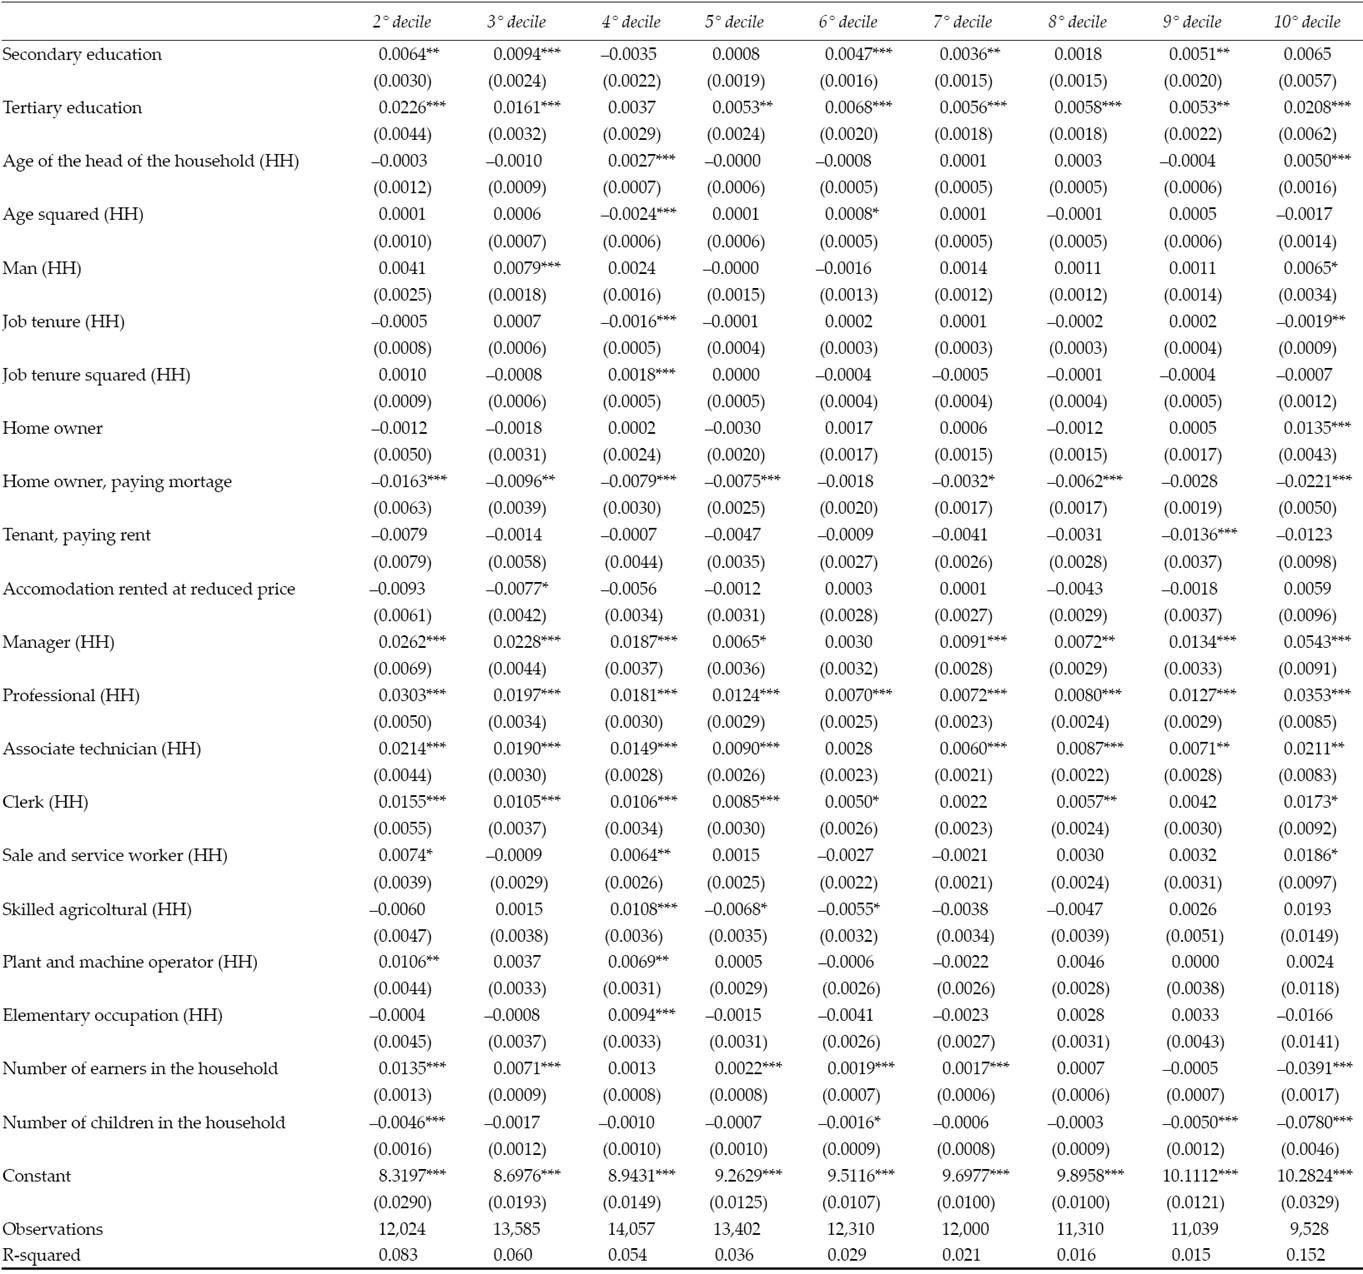
where X h,t includes observable household characteristics. We consider the following household’s characteristics: sex and age of the head of the household, his/her profession and years of work experience, the number of earners in the household, the number of children living in the household, tenure status in the dwelling of residence (as a proxy of wealth), and country fixed effects. Assuming the error term e h,t to be i.i.d. and normally distributed, equation [4] can be separately estimated for all income deciles in each year. The estimates for 2008, 2013 and 2015 are reported in the Appendix 5.
Following Amemiya (1977), for each income decile i we use three-step Feasible Generalized Least Squares (FGLS) to estimate the expected value of household incomes and the variance of their idiosyncratic component, respectively defined as:
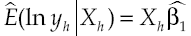 [5]
[5]
 [6]
[6]
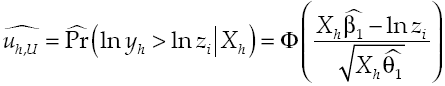
In this framework, the variance of the disturbance term is treated as an inter-temporal variance of log incomes. Since households’ gross income is assumed to be log-normally distributed (equation [4]), we can estimate the probability that household h with characteristics X h will shift to a lower income decile in the next period, as:
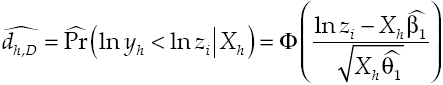 [7]
[7]
where Φ is the cumulative density of the standard normal distribution. Symmetrically, for household h the probability of upwards income mobility, u h,t , i.e. of a shift to a higher income decile, can be defined as:
 [8]
[8]
where Z i is the upper/lower bound of decile i.
This way, the relationship between the probability of downwards or upwards mobility and households’ labour and capital income shares can be estimated through a probit model, as discussed in the next section.
Main results
As Table 4 shows, from our analysis it emerges that households’ sources of income significantly affect their income mobility, both upwards and downwards. At the beginning of the crisis, in 2008 (2007 incomes) a household’s labour share of income was a positive predictor of its future downgrade, albeit with a relatively small coefficient. By contrast, households’ capital income shares positively affected their probability of an upwards shift in the income distribution, by as much as 5.6% for each percentage points difference in the capital share.
Table 4: Income mobility: Probit estimation, marginal effects
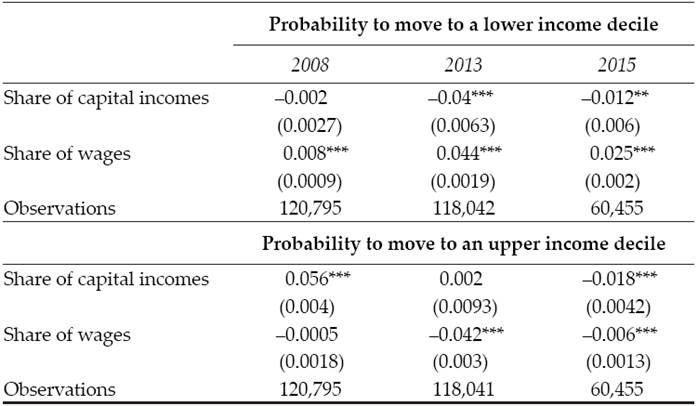
Notes: Standard errors in parentheses: *** p < 0.01, ** p < 0.05, * p < 0.1 Due to data unavailability, only 13 countries are considered for year 2015 (Austria, Bulgaria, Denmark, Greece, Spain, Finland, Hungary, Island, Latvia, Netherlands, Norway, Portugal, and Slovenia).
In 2013 and 2015 such divergence in the respective coefficients even increased. On the one hand, capital income becomes a significantly negative predictor of the probability of downwards income mobility. On the other hand, the wage share takes on more relevance in explaining the probability of a down-wards shift, with a 1% difference in the wage share increasing the probability of income downgrade by 4.4% on average in 2013 and 2.5% in 2015; further, it acquired statistical significance (even if retaining a very small coefficient) in explaining, with negative sign, the probability of an upwards shift.
On the whole, these findings are consistent with the view that the more households depended on labour the more exposed it was to the negative consequences of the European crisis.
However, it should be recalled that labour and capital incomes do not exhaust the whole of households’ budgets, with public transfers proving an equally significant source of income. This may possibly explain the only finding that does not fit the above narrative, namely that in 2013 the capital share of income lost its significance in determining the probability of upwards mobility, and in 2015 it even acquired a negative sign. Thus, it cannot be said anymore, as was the case in the pre-crisis situation, that a capital income share makes households more likely to climb the social ladder.
Conclusions
The European crisis has revived mainstream economists’ interest in the topics of inequality, both of household incomes and in the functional income distribution. However, with the exception of the works by Atkinson, Piketty and Saez (2010), analysis of the two topics remains substantially separated.
In this work we show that the abovementioned authors’ focus on the top 1% of incomes risks leading to a misleading representation of European society, if it is taken to imply a substantial uniformity of the other 99%. For example, more than half of European households earn some form of capital incomes, and roughly as many households (around 40%) mostly depend on their labour as depend on public transfers. Moreover, on average capital incomes are lower than labour incomes, and anyways only a tiny minority of European households only earn one kind of income (which is generally public transfers).
Considering the impact of the crisis, we find that the more households depend on labour incomes the more they were likely to move downwards in the income distribution. However, this does not imply that capital incomes made households more likely to move upwards.
Finally, we found evidence of high heterogeneity in the levels of household incomes from all sources; and similarly, it should be expected that households’ mobility may have been differently affected by the various macroeconomic conditions (e.g. in terms of fiscal consolidation, interest rates, and GDP growth: Tonveronachi, 2016) in the single countries6.
We can thus conclude that functional distribution, i.e. what kind of income a household earns, significantly affects both its position in the income distribution and its chances of mobility within it, and such impact is magnified by the crisis. However, the geography of European households’ incomes is much more complex than frequently suggested, and therefore drawing policy implications from the sheer analysis of households’ labour and capital incomes may be non-trivial.