nueva página del texto (beta)
 Inglés (pdf)
 Artículo en XML
 Referencias del artículo
 Enviar artículo por email
 Citado por SciELO
  Similares en
SciELO
Similares en
SciELO 
 Permalink
JEL Classification: C20; C21; I30; J61.
Clasificación JEL: C20; C21; I30; J61.
Introduction
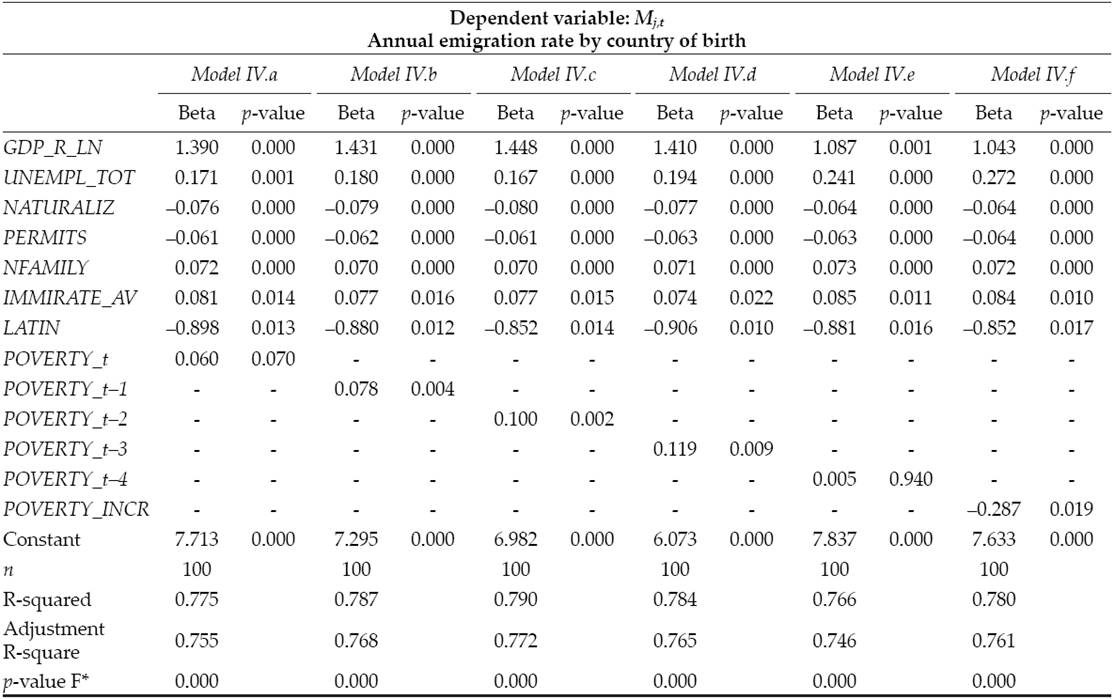
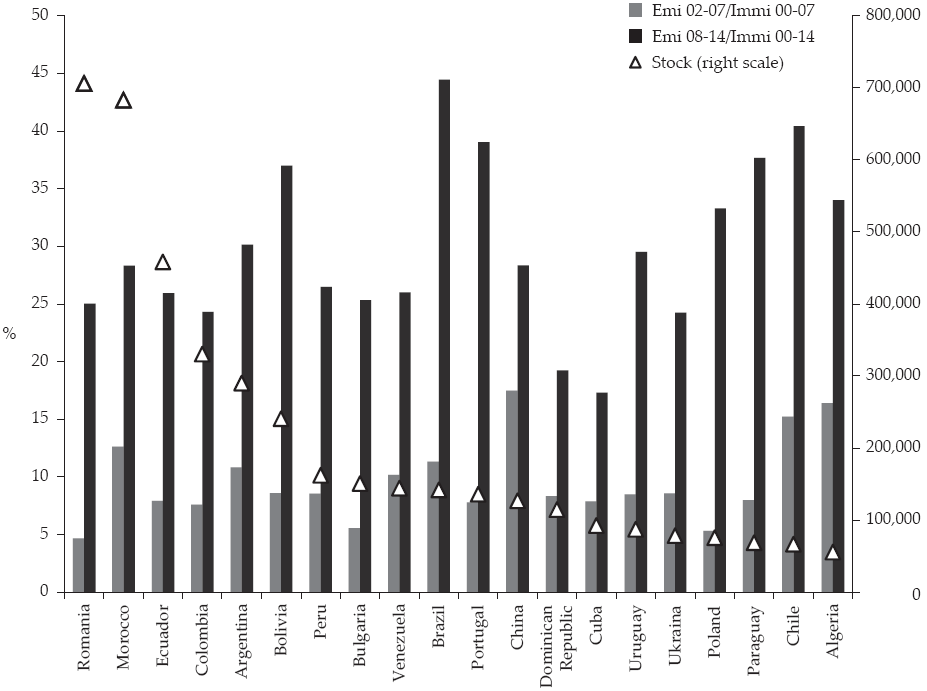
The downturn phase of the global economic cycle has generated a new pattern in international mobility. The crisis is severely affecting five European countries: Greece, Ireland, Portugal, Italy and Spain. According to the OECD (2012), these countries share two common characteristics in terms of migration: first, after the Second World War they all became major migrant-sending countries and second, they have all recently become host countries for immigrants. In fact, between 2000 and 2007 two of them, Spain and Ireland, have experienced the largest percentage increases in their immigrant populations with a rise of more than eight points, compared to an average of two points for the Organisation for Economic Co-operation and Development (OECD) countries as a whole. During this period, Spain received the most foreigners with an annual net average inflow of 528,000, according to the EUROSTAT. This is vastly different to the United Kingdom with an annual average of 253,000, Germany with 107,000 or France with 65,000. Not even the 286,000 net inflows of Italy come close to the Spanish figure and, of course they are much higher than the 55,000 or 47,000 corresponding to Ireland and Portugal. Even taking into account the divergences in the type of data1, it is evident that no other country matches Spain in terms of the volume of new arrivals until 2007 (see Figure 1).
Source: EUROSTAT, Database by Themes.
Figure 1: Net inflows of foreign population. Selected countries, 2000-2014
With respect to these intense inflow rates, both Spain and Italy have had to contend with an additional problem: the continual accumulation of large groups of irregular immigrants ―based on the existence of informal migratory networks and on the relatively liberal immigration policy (Aja, Arango, and Oliver, 2008)― which the different governments have repeatedly addressed with large-scale regularisation programmes2. In the case of Spain, once immigrants obtain a legal residence permit, it is easy for them to obtain Spanish nationality. As Spanish legislation provides that after two years of regular residence in the country, nationals of Latin American countries may apply for Spanish nationality. This explains why, for example, in 2013 Spain granted nationality to more foreigners (226,000) than Germany (112,000), when thirteen years earlier, in 2000, Germany, with a significantly larger population, bestowed citizenship to approximately 190,000 foreign nationals and Spain hardly reached 6% of this figure. It also explains why Spain granted nationality to so many more foreigners than the 101,000 in Italy in the same year.
This intense wave of immigration in Spain was driven by a significant growth in Gross Domestic Product (GDP) and the subsequent demand for labour. During the years of expansion, the increase in the need for workers was a consequence of the development of low valueadded economic sectors (construction, hotel and catering or domestic services) which required an unqualified workforce. These sectors are specifically related to contributing to the growth of the shadow economy which had already been expanding traditionally in the country. At the end of the growth period, in 2008, and according to the estimates of Schneider and Buenh (2012), the informal economy represented 23.0% of Spain’s GDP, as opposed to the United Kingdom (12.1%), France (14.0%) or Germany (14.8%). Only Italy exceeded Spain with a shadow economy accounting for 26.8% of GDP. These figures reveal that the development of the shadow economy must have been another factor that attracted immigration in the case of Italy and Spain, the two countries which received the largest number of immigrants during the last growth period.
These specific circumstances (a country with strong recent immigration and an expanding shadow economy) make Spain a particularly special case study. Even more so considering the existence of official statistical sources compiled by the Spanish National Statistics Institute (Instituto Nacional de Estadística, INE), such as the Padrón. Población por Municipios (Municipal Population Register, MPR) which, contrary to other European countries, includes the registrations of all foreign nationals (regular and irregular) and therefore enables us to construct a reasonably accurate picture of the immigration situation.
The paper is structured in the following way. The first section discusses the empirical evidence. We will examine the evolution of immigration since 2000 and the socio-demographic footprints that immigrants continue to leave in Spain. This includes an analysis of the information of the legal status of foreigners, enrolment in schools, granting of citizenship and finally, the evolution of remittances. To finish the section, we relate the behaviour of the stocks and the inflows of foreign-born residents in order to analyse relative shares, rates and intensities by country. The second section models the determinants of international remigration in Spain from a macroeconomic perspective and according to the official statistics available3. It is made up of a structural analysis of the relationships between the rates of international emigration with different explanatory variables using an econometric specification with pooled data comprising information from the period 2008-2012 estimated by Ordinary Least Squares (OLS), which contemplates the possible existence of time and spatial heterogeneity. Once the structural model is built, a discussion of the role played by the increase of poverty among immigrants is added at the end of this section. Finally, the study closes with the main conclusions and references.
The empirical evidence
The stock of immigrants in Spain
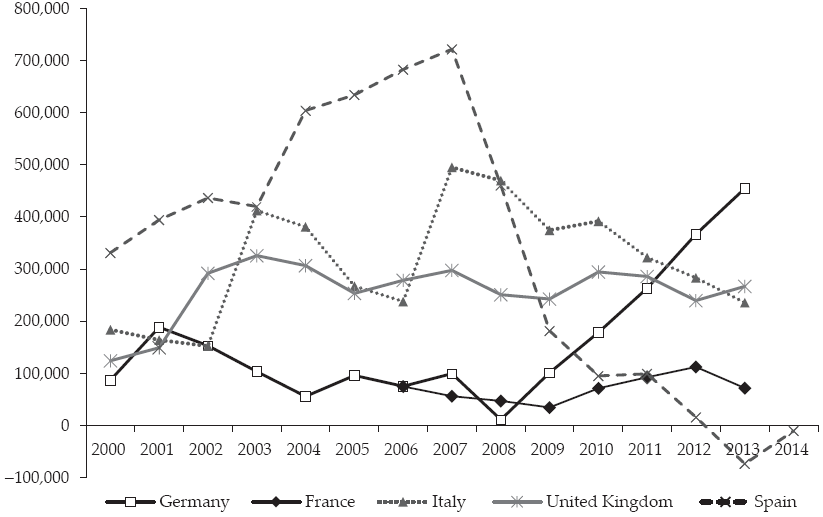
As we can see in Figure 2, the stock of foreign-born4 residents in Spain has grown from two million in 2000 to more than six million at the end of 2014. Data drawn from the MPR reveal that the crisis that began in 2008 has not had an intense and immediate effect. There has not been a dramatic fall in the number of immigrants5. Even more, the number of immigrants who were attracted mainly by work reasons born in Africa, Central and South America, Asia and European countries no EU-15 ―in general, developing, low income or poor countries― not only were stabilised in 2008 but also remained almost constant until the end of 2011, despite the astonishing increase in the non-nationals unemployment rate since 2008.
Note: * Break in 2011.
Source: INE, Padrón. Población por Municipios, Encuesta de Población Activa-3Q, and Contabilidad Nacional Anual de España (Spanish National Accounts).
Figure 2: Stock of foreign-born population, GDP growth rate and unemployment rate, 2000-2015
Although the data drawn from the MPR are official figures of the Spanish population, the statistical use of this source has been criticised on occasions due to the way in which it is recorded. The inscription in the MPR depends on the willingness of the individuals. Furthermore, residents are granted a series of benefits when they inscribe in the Register which are lost when the registration is cancelled due to emigration. Therefore, the MPR may not reflect the outflow of immigrants accurately. For this reason, Figure 2 also shows the data from the Encuesta de Población Activa (Spanish Labour Force Survey, LFS). MPR and LFS show similar trends, although the LFS estimates a slightly lower stock.
Also, the Censo de Población y Viviendas 2011 (Population and Housing Census 2011) of the INE does not contradict the information drawn from the MPR either. On the reference date of 1 November 2011, a stock of 6.3 million foreign-born residents were registered while in the month of December of the same year 6.7 million foreign-born immigrants were inscribed in the Register. This represents a difference of 6.3%. In addition, the census also reveals that the inflow of immigrants has not stopped completely as 16.0% of foreign-born immigrants arrived in Spain after 2008.
The footprints of the presence of international immigration in Spain
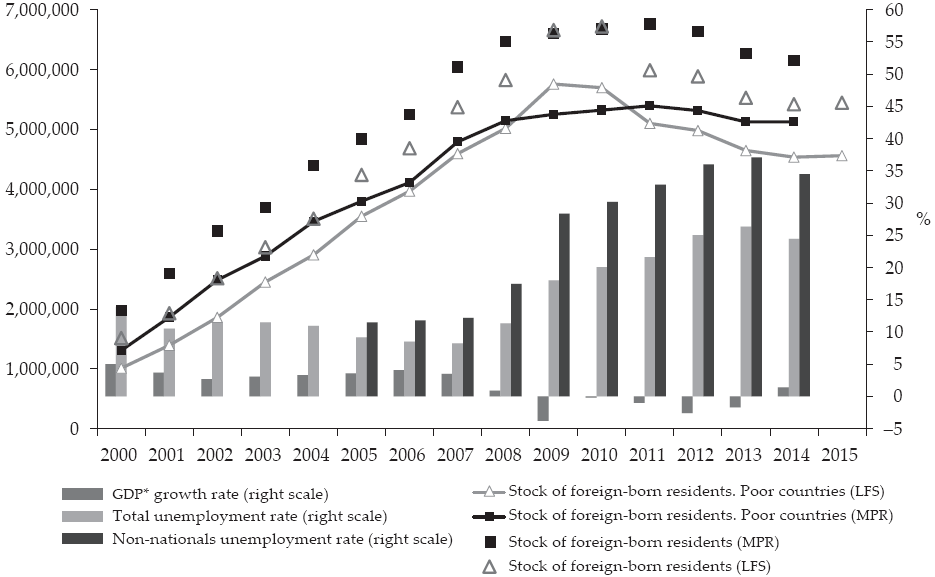
This first (and unexpected) impression fits well with some of the socio-demographic footprints that foreign citizens6 continue to make in Spain. Figure 3 shows these for the stock of foreigners residing in Spain. In general, there has been no fall in the number of foreigners who are legally registered or who hold a valid residence permit or card (“permits” in the figure). In fact, the number of new permits/cards issued to foreigners increases between 2008 and 2014 nearly half a million.
Note: * Break in 2008.
Source: Ministerio de Empleo y Seguridad Social, Estadísticas de Residentes Extranjeros (Ministry of Labour and Social Security, Foreign Residents Statistics); Banco de España, Balanza de Pagos y Posición de Inversión Internacional de España (Bank of Spain, Balance of Payments and International Investment Position), and Ministerio de Educación, Cultura y Deporte, Estadísticas de la Educación (Ministry of Education, Culture and Sport, Education Statistics).
Figure 3: The socio-demographic footprints of immigrants in Spain, 2000-2014
Second, with respect to the progression of the number of foreign student enrolments in the different levels of education (non-university), it appears that the immigrants have not massively left the country. Whereas in the academic year 1999-00, there were 107,301 immigrants (representing 1.5% of the total number of students enrolled), in 2007-08 this group of students rises to 703,497 people (representing almost 10.0% of the total). The number of foreign students only falls to 8.8% in 2014-2015, when there were 712,000 foreign students enrolled, even though the Great Crisis and that the foreign-born naturalised minors are no longer included in the statistics.
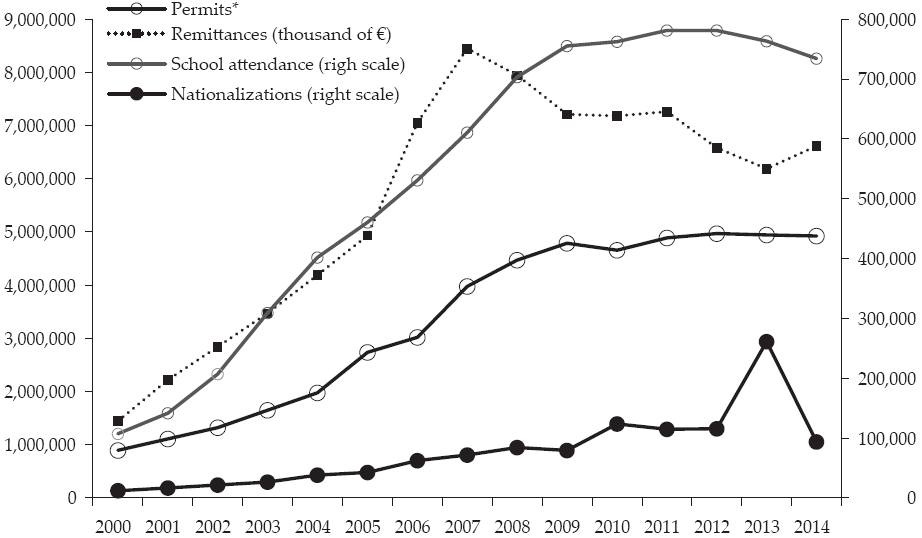
The third footprint refers precisely to the naturalisation of foreigners. As you can see in Figure 4 (right scale), the number of naturalisations increases year by year, except in 2014. If we add up these figures, between 2000 and 2014 a total of 1,165,074 foreigners were granted Spanish citizenship (74.9% after 2008). This represents around 24.7% of foreigners residing in Spain at the end of 2014, according to the MPR. The majority of the immigrants who were granted nationality were from low-income countries or had emigrated for labour reasons, specifically Ecuadorian, Colombian, Moroccan, Peruvian and Argentine natives. The evolution of this variable is not only the result of the applications for Spanish citizenship by immigrants, but also of the legal requirements. The majority of immigrants apply for citizenship after residing in Spain for ten years, although in the case of nationals of Latin American countries, Andorra, the Philippines, Equatorial New Guinea, Portugal and also the Sephardim, a period of residence of only two years is required. Taking into account the fact that Ecuador and Colombia reached a maximum peak in terms of immigration to Spain in 2000-2002, it is possible that the reduction in the increasing rhythm of naturalisations is due not to outmigration but to a decrease in the applications of these origins as there were less and less aspirants. Also, the administrative delays in the resolution of applications, hinders the interpretation of the trend in the number of naturalisations. That is the case of the increase in 2013, almost entirely due to the reinforcement of the official administrative resources.
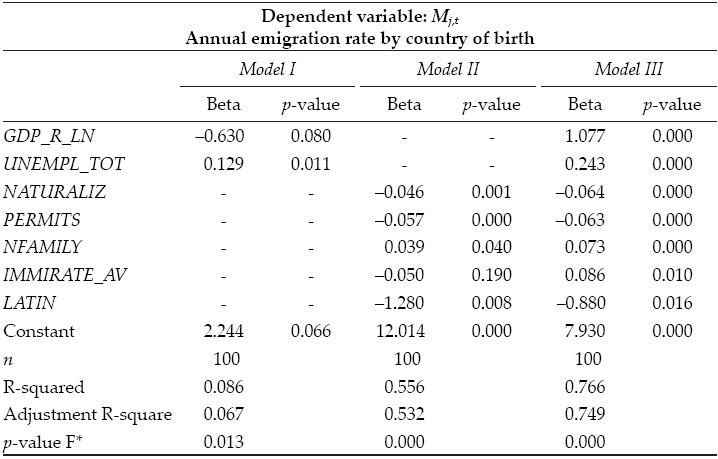
Source: INE, Padrón. Población por Municipios and Estadística de Variaciones Residenciales.
Figure 4: Stock of foreign-born citizens (31/12/2007) and relative migration, 2000-2014
The last footprint refers to the sending of remittances abroad. The volume of remittances has dropped, with a strong fall in 2008 to 2009 followed by two years of stability and then a further reduction in 2012 and 2013. However, the rate of this reduction has been lower and much slower than the previous growth rate and, given that immigrants have been affected substantially by un-employment, it is still a very high volume of remittances. In fact, if we estimate the volume of remittances per capita by applying the ratio between the total remittances sent to the countries of origin and the number of foreign-born residents, the immigrants have been sending a yearly average of €1,050 over the last five years, a higher figure than in 2005.
Those who stay and those who leave: Remigration of foreign-born nationals
By comparing stocks and international flows of foreign-born citizens we can draw a picture of the evolution of international migrations in relative terms with the onset of the crisis. Figure 4 shows the stocks of MPR foreign-born citizens by main countries of birth and ―from the Estadística de Variaciones Residenciales (Residential Variation Statistics, RVS)― the ratios of emigration flows in relation to immigrations before and after the beginning of the economic recession. Specifically, we can see the weight of outflows between 2002 and 2007 in relation to the inflows between 2000 and 2007 and on the other hand the weight of emigrants between 2008 and 2014 related to total inflows since the year 2000.
The countries of birth selected represent 69.7% of the total of foreign-born citizens and 87.4% of immigrants born in developing countries, according to the MPR at the end of 2007. On average, the graph shows that before the recession, the volume of outflows represented around 10.0% of the inflows, except for three countries: China with almost double at 17.5%, Algeria (16.4%) and Chile (15.2%). It is true that during the recession (2008-2014) this percentage increased to 33.0% on average of the total inflows from the year 2000, although for immigrants from Brazil this figure rose to 44.5% and from Chile to 40.4%. However, the countries with the highest stocks (Romania and Morocco, although also Ecuador and Colombia), in both periods have a relatively low weight in the emigration figures. The increase of the ratio in the second period is relatively smaller than that of other countries with a lower number of residents in Spain.
Modelling the determinants of international remigration in Spain
Migration models
Economists have traditionally explained migration decisions using the neo-classical economics. It was Sjaastad (1962) who first applied the notion of human capital investment to migration. He considered it to be a resource allocation problem in which the migration is viewed as an investment which increases the productivity of the individual human capital, and therefore increases the volume of expected life-long earnings. As with all investments, emigration is subject to costs and returns. Each agent is an individual utility maximiser and can calculate his/her net expected earnings as the difference between the individual returns and costs generated by emigration.
From a macroeconomic point of view, these migratory models are based on two main factors which explain international mobility: the differences between countries in the levels of earnings (income or salaries) and unemployment rates. In normal contexts, in these models it is expected that the mobility from i (origin) to j (destination), M ij , occurs from areas with low earnings (y) and high unemployment (u) to those with better levels as shown in the following equation:
 [1]
[1]
Such that:
The success of these models to explain migration decisions from rural to urban areas or from poor countries to developed countries has been well established7.
As Cassarino (2004) explains, the neo-classical economics of migration views the migrant as an individual who maximizes not only his/her earnings but also the duration of the stay abroad to achieve permanent settlement and family reunification. In this framework of analysis, return cannot but be motivated by a failed migration experience, in terms of expected earnings, employment, and duration8. Conversely, the new economics of labour migration (NELM) views return migration as the logical outcome of a ‘calculated strategy’, defined at the level of the migrant’s household, and resulting from the successful achievement of goals or target9.
In fact, as indicated in Martí and Ródenas (2012), the reasons for repeat migrations are diverse and we still need to know who returns when, and why, particularly when explaining the decision to remigrate in contexts of economic crisis. Here is inevitable to question the explanatory role of the economic variables and to consider including in the models other factors related to the effects of the persistent economic recession which mitigate the impact of the usual economic variables. More specifically, these variables are related to the costs (c i ) of losing acquired rights if immigrants abandon the host country i (residence permits; the possibility of obtaining nationality; unemployment benefits and income support); the costs of not having access to better health, education and legal services or greater personal safety; and finally the cost of encountering more difficulties when returning to Spain at a later date due to changes in the immigration policy of the host country. As the immigrants are more integrated in the society, these rights are easier to achieve and therefore the costs of abandoning the host country will be greater. Consequently, we should includein the model the degree of integration (int i ) achieved by the immigrant group (the number of naturalised, the development of support networks among the immigrants, the presence of family in the host country, or cultural and language identity). Therefore, the migratory model that we wish to estimate would expand on the expression in [1] as follows:
 [2]
[2]
Such that:
The focus of the analysis in this approach is macroeconomic and is carried out through the structural relationships between the rates of international emigration and different explanatory variables. More specifically, the dependent variable M j,t , is the annual rate of emigration from Spain in the period 2008-2012 by country j of birth of the immigrants, and not by nationality as those who have been granted Spanish nationality would be hidden. For each country j and year t, the ratio between the annual emigration flow of those born in country j and the population born in country j and registered in the MPR in Spain at the beginning of the year is calculated10.
The structure of the statistical information available enables an economic study to be made using both OLS and panel or longitudinal data techniques. In our case, we have chosen the OLS estimates taking into account that there may be time and spatial heterogeneity. In this way, we avoid the disadvantage inherent in panel techniques when working in differences whereby the effect of significant variables that do not vary over time cannot be estimated as they disappear with the previous transformation. As some of these variables are important in our case11, we have attempted to reduce the OLS specification errors by modelling the time and spatial heterogeneity through dummy variables.
Definition and discussion of the independent variables
As previously mentioned, two types of variables have been used to model repeat migration. First, the economic variables of income and labour market ―y and u in [2]― were taken into account. And second, variables referring to the specificity of the context of the repeat migration during periods of crisis ―c and int in [2]― were also incorporated. To capture these effects, some variables that determine the degree of legal integration in Spain were used in addition to the level of social and family support available to the immigrants. These variables constitute the existence or otherwise of return policies in the country of origin; the structure and weight of the family nuclei of the immigrants; the level of previous immigration and finally, the times which has elapsed since the arrival to the host country. In addition, control variables and time and spatial dummies were incorporated.
a) Human and economic development variables (specific and control variables for y i and y j )
In the explanatory economic framework of mobility, the variables related to income, salaries and the standard of living in general in the origin and destination play a fundamental role. It is expected that an increase in these variables in the destination country stimulates immigration and an improvement (absolute and/or relative) of them in the country of origin will slow down emigration.
In order to capture these effects, we have used three variables: the United Nations Human Development Index (HDI), the income index of the HDI12 and finally, the value of the real Gross Domestic Product per capita13 (GDPPC). These variables have been incorporated in terms of levels, ratios and differences between the country of origin and Spain. Also their growth rates and logarithms have been examined. The variables corresponding to human development or quality of life based on the HDI were not significant. However, those that are explicitly related to monetary aspects were significant. The earnings component of the HDI of the country of birth of the immigrants and the different versions of the GDPPC (measured by level or ratios and with or without logarithms) have generated significant results; although the variables constructed from the GDPPC have a greater explanatory power.
We should note that in general, the sign of the parameters estimated clearly show that the absolute or relative improvement of the earnings variables in the country of origin of the immigrants increases the rate of emigration from Spain (positive relationship) and that the variable which best illustrates this effect is the logarithm of the GDPPC ratio between the country of birth and Spain, GDP_R_LN.
Finally, to mitigate any possible omitted variable bias, the inter-annual growth rate of Spain’s GDP has been used as a control variable. But it has not been statistically significant in the different specifications of the model.
b) Labour market variables (specific and control variables for u i and u j )
Another important set of variables in economic models of migration are those referring to the labour markets in the country of origin and the host country. In the same way as earnings, in general terms, an increase (absolute or relative) in employment or a decrease in unemployment lead to higher immigration (destination country) or lower emigration (if it is the country of origin). Due to a lack of homogeneity and the scarce statistical information relative to the labour markets in the countries of origin of the immigrants, our study has been restricted to examining the labour variables in Spanish statistical sources. All the variables of this nature have been drawn from the Spanish LFS.
The control variables have focused on the evolution of total employment and unemployment in Spain. The growth of people employed has been calculated from the averages of the four quarters and, alternatively, from the interannual growth in the four quarters. None of these variables were significant. However, when the annual rate of unemployment in Spain, UNEMPL_TOT, was incorporated in the different specifications, the explanatory capacity of the model took a qualitative step forward with significant improvements in the R2. Moreover, when this variable was introduced, the four annual dummy variables incorporated to take structural change into account (effects of the changes common to all immigrants over time) became non-statistically significant. The interpretation of this interaction is that the Spanish unemployment rate accounts for the most essential part of this structural change, therefore adding time dummies is unnecessary14.
With respect to the specific labour variables of immigrant’s data referring to nationality and to the country of birth (large geographical areas), employment and unemployment situations have been used. In particular, the following variables have been tested. For the aggregate of all foreigners (including those with dual nationality) the growth of those employed was calculated using the 4Q average. Alternatively, distinguishing between each country of birth, the variation in the level of employment was calculated based on the interannual growth between the 4Q of each year. While the latter was not significant, the former was and with the expected negative sign. However, its explanatory capacity falls far short of that of the immigrant unemployment variables.
Specifically, the growth in the level of unemployment and the unemployment rate among all foreigners (including those with dual nationality), and also the unemployment rate for each birth country j have been calculated. All of these specific variables were significant, their estimates showed the expected sign (positive) and increased the goodness of fit. However, they improved the R2 less than the unemployment rates of the whole population of Spain (UNEMPL_TOT) and, logically there is a strong correlation with this variable. Therefore, the final specifications of the model use UNEMPL_TOT.
c) Legal integration variables in Spain (specific variables for the vectors of c i and int i )
The NATURALIZ variable refers to the percentage of those born in country j with Spanish nationality over the total number inscribed in the MPR born in the same country j for each year. The variable PERMITS contains the percentage of foreigners with a valid registration certificate or residence card15 over the total number of foreigners inscribed in the MPR of each nationality and year. Both NATURALIZ and PERMITS are expected to maintain a negative relationship with the emigration rate, as a higher weight of immigrants with permits and naturalised indicate a greater level of integration in Spain as they are legally residing there. The results of both variables were significant and with the expected sign16.
d) Social support variables in the host country (specific variables for the vectors of c i and int i )
There are two types of variables in this group. The first refers to the support that immigrants may receive from friends and family residing in Spain and is covered by two variables constructed from data drawn from the MPR. First, the degree of geographical concentration of those born in the same country measured through the Gini index calculated for Spanish provinces and second, the percentage of immigrants born in country j concentrated in the six provinces with highest inflow from the country of origin j. A positive relationship is expected as a higher concentration of immigrants from the same origin enables a greater logistic-economic support and therefore reduces emigration. However, a negative sign could appear due to a dominance of the “contagious” effect of outflows. Nevertheless, the results showed that neither of these variables was significant.
The second group of variables is based on the Estadísticas de Prestaciones por Desempleo (Statistics of Unemployment Benefits) of the Ministerio de Empleo y Seguridad Social. The relative volume of foreigners (by nationality) who are unemployment benefit recipients in the Spanish system have also been used. A negative relationship is expected because the greater the number of beneficiaries the greater the possibilities of staying in Spain and also, an unauthorised absence from Spain could result in the loss of this right. This variable was not significant.
e) Variables of return policies in the country of origin (specific for the vector of c i )
The existence of active policies with specific programmes for returning migrants is covered with a dummy variable which takes value 1 for the for the only country, Ecuador, where these programmes exist. The elationship is expected to be positive but the variable is not statistically significant.
f) Family variables (specific for the vector of int i )
The neo-classical economic modelling of mobility has been strongly criticised because decisions are made on an individual level. In our estimate, the family variables which have been designed seek to include the effects of the presence (or absence) of the family in making the decision to remigrate. In accordance with the available statistical information, different alternative variables have been constructed and tested. The presence of children, partners or other relatives in Spain is expected to reduce the tendency to emigrate and has been estimated using two variables rooted in the beginning of the crisis. The first refers to the percentage of immigrants of the birth country j who were residing with their children of any age in Spain in 200717. The second is the percentage of people from a specific birth country j who, at the beginning of the crisis, resided in Spain in households with people to whom they were directly related18. Alternatively, we also tried to capture the family effects with variables constructed to include the presence of minors in Spain. So, on the one hand, we worked with the rate of children (under 16 or 20 years of age) by country of birth (or nationality) in relation to the stock of immigrants from the same country (or nationality) registered in the MPR. On the other hand, we also worked with the rate of school enrolment of children by relating enrolled children19 with those registered in the MPR by nationality.
The type of activities which recent immigrants have been carrying out in Spain (construction, agriculture and domestic services), has established a distribution by sex and country of origin which, in many cases, is highly differentiated. Therefore, also in relation to the family composition of immigrants, two variables have been designed to capture the demographic structure of the natives of each country based on the mpr. First, the weight of men by country of birth which, in view of the severity of the crisis in the construction sector, is expected to maintain a positive relationship with the rate of emigration. And, on the other hand, an index has been constructed defined between 0 and 1 which is calculated following a very similar procedure to that of the HDI, based on the geometric average of two standardised indicators: the weight of minors under the age of 20 in relation to the stock corresponding to the country of birth and the participation of women in the same group. This bounded index would therefore represent a combination of the women and child components of each group by county of birth and year. The closer the result is to one, the greater the presence of children and women, and it is expected to have a negative relationship with emigration, due in part to women immigrants being slightly less affected by the increase in unemployment.
After working with the different specifications, it was found that none of the variables related to the presence of family in Spain were statistically significant. However, the situation of having left family behind in the country of origin should be considered. Therefore, two new variables were designed connected to the onset of the crisis based on the Encuesta de Migraciones-2007 (National Immigrant Survey-2007). The first is the percentage of immigrants per country of birth with children under the age of 16 with whom they do not live over the total number of immigrants from this country of birth. The second variable is the percentage of immigrants per country of birth with children under the age of 16 with whom they do not live over the group of immigrants from this country of birth who have children. The hypothesis is that they will have a positive relationship with the emigration rate as they account for the effect of having left children in the country of origin. And, in fact, the latter of the two ―NFAMILY― is significant and also has the expected sign.
g) Variables of the length of time since arrival and prior immigration (specific for the vector of int i )
It seems reasonable to assume that immigrants who arrived before the crisis are in a better situation to cope with the recession. Therefore, the period elapsed since their arrival in Spain could be a factor that facilitates their continuity in the country. In order to measure this effect, the following variables have been designed.
To identify it through the changes in the stocks, the ratio between the volume at the beginning and at the end of the year was calculated for each country of birth; the proportion of foreigners of each nationality who arrived in the last three years measured in the fourth quarter of each year, between 2007 and 2011 and finally, those who arrived in 2007 or later20. None of the three variables were found to be significant.
However, since all emigration flows are related to the intensity of prior immigration flows, the immigration rate has also been used as an explanatory variable21. So the annual immigration rates by country of birth have been tested, also lagged by one year. Furthermore, the average of these annual rates from 2008 until each of the years analysed has also been tested. This latter variable, IMMRATE_AV, was found to be significant and with the expected positive sign which indicates that the higher the rate of entries in the crisis period the lower the probability of success and greater the possibility of remigrating22.
h) Spatial dummies (specific for the vector of int i )
The model initially tried to capture the spatial heterogeneity with individual dummies for each country. When incorporated into the different specifications of the model, the only dummy found to be statistically significant was that corresponding to the Dominican Republic. However, as the individual fixed effects were being omitted, a new dummy was constructed, LATIN, which includes only the Spanish-speaking countries of birth23. Sharing the same language, a common history and to a certain extent Spanish customs could be factors that mitigate the predisposition of this group to emigrate. Incorporated into the model, the significance of this variable and its negative sign can be easily interpreted: the fact that the country of birth is Spanish-speaking allows these immigrants to resist remigrating.
Estimation results
Given that the dependent variable, M j,t , is the annual rate of emigration from Spain in the period 2008-2012 by country j of birth of the immigrants24, the general specification given by equation [2] is as follows:
 [3]
[3]
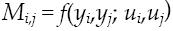
where t = 2008,…, 2012; j = 1,…, 20 (countries) and ε j,t denotes the error. The explanatory capacity of the above-described variables was tested and the results are shown in Table 1. In the first column (Model I), only the economic variables are included and although the model is statistically significant as a whole, the goodness of fit is very low and the GDPPC variable is not significant. The explanatory capacity clearly improves when the model is specified only with the alternative variables of costs of emigration and integration in Spain (Model II). But the best results are obtained with Model III which includes both groups of variables: the goodness of fit increases, all the variables are significant and the signs of the estimated coefficients are as expected.
Table 1: Determinants of international remigration in Spain, 2008-2012
Note: * p-value F is the p-value corresponding to the global significance F-test of the model.
In general terms, by making the variables of the neo-classical migratory models (GDP_R_LN and UNEMPL_TOT) interact with those associated to the legal situation in Spain (NATURALIZ and PERMITS), with variables relating to integration in the host country (NFAMILY and LATIN) and with the variable corresponding to the intensity of immigration throughout the crisis (IMMRATE_AV), we can explain 75.0% of the variability of emigration rates by country of birth25. The negative sign of PERMITS and NATURALIZ indicates that the higher the percentage of work/resident permits and naturalised immigrants by country of birth, the lower the probability of emigrating. The positive sign of the rest of the variables can be interpreted easily: the intensity of emigration is higher when young children have been left in the country of origin (NFAMILY), when recent immigration has been more intense (IMMRATE_AV), when unemployment in the host country i has increased (UNEMPL_TOT) and when a high ratio of GDP per capita (GDP_R_LN) prevails. Furthermore, given the negative sign of LATIN, there is a resistance to remigration among people born in Spanish-speaking countries.
Has the increase in poverty led to an immigration trap in Spain?
The structural models exhibited in Table 1 do not consider any variable related to immigrant poverty. Taking into account the increase in the rates of monetary poverty among foreigners during the economic crisis, it is inevitable to consider the possibility that some people were suffering an immigration trap. In other words, immigrants are willing to return but they cannot do so because they live in poverty. They stay in Spain because they are not able to leave their residence and to afford the costs involved in migration.
As in others countries in the European Union, the Encuesta de Condiciones de Vida (Living Conditions Survey, LCS) is carried out in Spain. The poverty rates26 and other indicators of income and inequality can be estimated from this survey, although the breakdown of the information is not the most suitable for the model. The poverty rate by country of birth or by nationality of the immigrants is not estimated. The survey only distinguishes between the Spanish group and the foreigners, and, in the case of the foreigners, only between those who belong to the European Union and those who do not. Despite this statistical restriction and considering that it is very possible that for the immigrants living in poverty remigration is not an affordable option (immigration trap), it has been estimated again the Model III including the poverty rate variable.
The complete results of the different specifications of the poverty rates (without lag, lagged by one year, 2, 3 and 4 years) can be seen in the Annex. It shows that there is a positive relationship between the emigration rate and the poverty rate, but with the shape of inverted “U” as the number of lags rises and where the estimated parameters for the extreme (t and t-4) are not statistically significant at 5% (see Figure 5 ―box β estimates― and Annex). Basically, what is observed is that emigration in t is not determined immediately by the poverty situation in t, but above all, by the situation three years before (t-3).
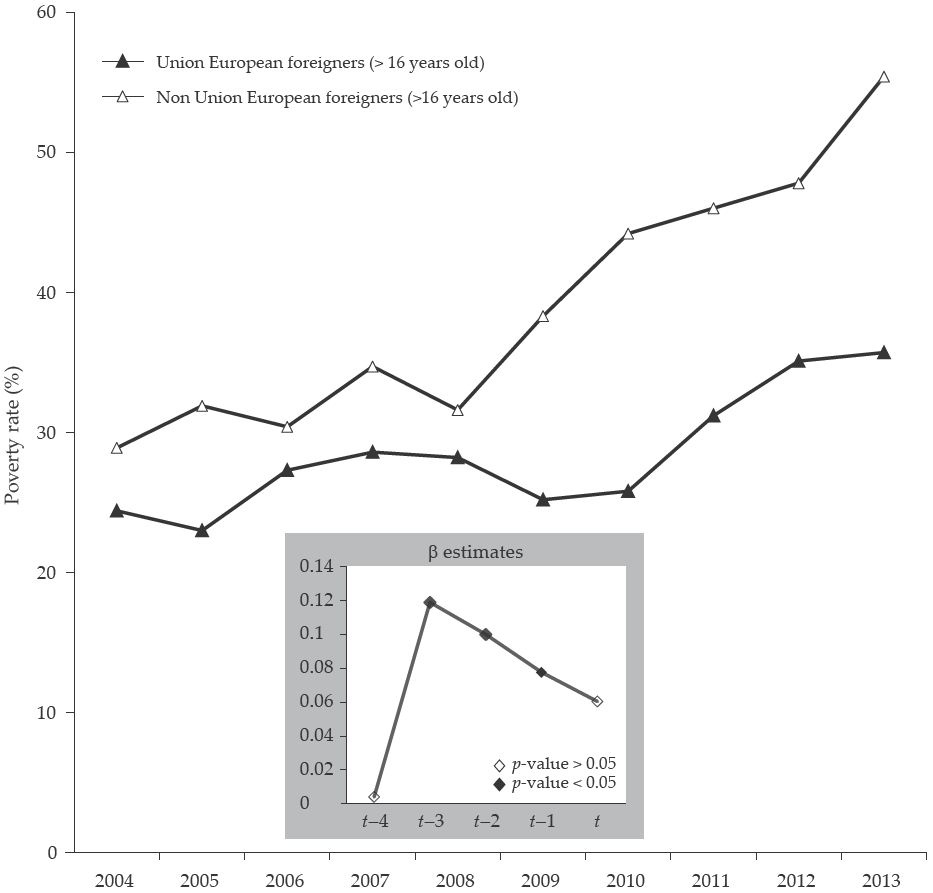
Source: INE, Encuesta de Condiciones de Vida, and own estimations (see Annex).
Figure 5: Poverty rates among foreigners and estimates of parameter β
The possible existence of an immigration trap is shown, precisely, when this last result is interpreted taking into account the recent unstoppable growth of the poverty rates among the foreigners. As can be seen in Figure 5, it is difficult to understand why the high rates of poverty in 2011, 2012 or 2013 do not lead to emigration but, according to our model, this would be more influenced by what happened to poverty in 2008, 2009 or 2010, years with substantially lower levels. One explanation is that immigrants do not re-migrate more because they cannot, as they live in poverty and, therefore, are trapped in Spain. Finally, this existence of the poverty trap is also confirmed by the negative relationship found between the emigration rate and the growing poverty rate (see Model IV.f in the Annex).
Conclusions
The crisis which began in Spain in 2008 is not having an intense and immediate impact on the number of immigrants, although the strong growth trend in immigrant stock has slowed down. This first (and unexpected) impression fits well with the analysis of the socio-demographic footprints of foreign immigrants residing in Spain. There has been no dramatic reduction in the number of foreigners who reside legally in Spain, those who are enrolled in non-university education and those who have obtained Spanish nationality. It is true, however, that in 2008-2009 and 2012-2013 the sending of remittances has fallen but it has now stabilised above 2005 levels.
The economic recession has changed the behaviour of the migratory flows of the main groups of foreign-born immigrants. Before the crisis, outflows were the equivalent of an average of 10.0% of inflows, but the recession has increased this to 33.0%. None of the countries with the highest volume of immigrant stocks (Romania, Morocco, Ecuador or Colombia) show a high relative weight in emigration before or subsequent to the onset of the recession. Therefore, after six years of economic recession, there has been no complete halt in the entrance of foreign-born immigrants or a mass outflow of immigrants. Until now, on the whole immigrants remain in Spain.
The results of the econometric estimate of the structural relationships between the international emigration rates and the classical economic explanatory variables of the neo-classical models (income and unemployment), and with other variables related to the costs of losing acquired rights if the host country is abandoned and/or those associated to the level of integration achieved by the immigrant show two things. On the one hand, that the neo-classical models do not adequately capture the relationships because we are considering remigration decisions (not first movements) within contexts of family units and times of crisis. On the other hand, the second group of variables are those which are reducing the impact of the traditional variables.
Finally, we have found some evidence of the existence of an immigration trap when variables related to immigrant poverty are included in our model. It seems that the increase in the rates of monetary poverty among foreigners during the economic crisis has led to situations in which immigrants are trapped and cannot consider re-emigration. Therefore, the policy question that would arise is how those immigrants remaining in Spain manage to subsist, specially, non- European Union immigrant groups which are the most vulnerable. If this population continues in Spain and cannot consider leaving ―as is really happening―, the persistence of the economic recession would transform this poverty into chronic poverty. Public policies ought to give this matter some thought.