


 nueva página del texto (beta)
 Inglés (pdf)
 Artículo en XML
 Referencias del artículo
 Enviar artículo por email
 Citado por SciELO
  Similares en
SciELO
Similares en
SciELO 
 Permalink
Introduction
As the financial industry's globalization evolution continues, several empirical studies report an increasing positive correlation across national stock markets' returns. Also, there is evidence of a faster transmission of shocks across countries and more frequent contagion episodes. A preliminary conclusion is that diminishing cross-border capital flow regulations and the immediate worldwide distribution of relevant news gradually eroded the advantages of international portfolio diversification (Gilmore and McManus, 2004; Aggarwal and Kyaw, 2005; Darrat and Zhong, 2005).
However, increased synchronization among capital markets has not only been influenced by exogenous factors. The degree of national markets' integration into the world economy has also responded to the development and stability of financial markets, including their increasing relative size (market capitalization with respect to Gross Domestic Product, GDP), the intensity of foreign institutional investors' participation, the strength of the political system, the presence of innovative industrial sectors, and the implementation of sound macroeconomic policies. Additionally, financial crises and domestic-driven turbulence have also represented important drivers of national stock markets' integration process.
We study the integration of the Mexican Stock Exchange Index and the Morgan Stanley Composite World Index in the context of the internationalization experienced by the Mexican economy in recent decades and as part of the world financial markets' liberalization process.
In the first instance, we focus on the relationship between the Mexican and the World Capital Markets during the period of the former's progressive international opening (1987-2012), and report evidence of its financial integration. Our analysis takes into account the possibility of volatility transmission (spillovers and contagion), a significantly relevant matter for risk managers, international investment portfolio designers, and those in charge of the implementation of policy measures to promote the Mexican Capital Market's development.
We complement our study with an innovative utilization of Clayton's Copula methodology to capture the volatility dependence structure by segmenting the observations into high-volatility and low-volatility regimes.
The paper is organized as follows: Section 2 briefly describes the process of economic and financial globalization; section 3 addresses the issues of globalization among emerging markets; section 4 offers a brief literature review related to empirical research on financial market integration, with special emphasis on the Mexican market's integration process; section 5 presents the methodological framework followed in this inquiry; section 6 shows the results of our empirical analysis of the relationships between the Mexican Capital Market and the World Capital Market. The last section offers some conclusions and ideas for future research.
Background of the economic and financial globalization process
Economic globalization represents one of the most relevant phenomena of the second half of the 20th century. Characterized by an increasing openness to international trade, as well as the integration of countries into international production chains coordinated at a distance, globalization is now present in many different manufacturing branches. Globalization also manifests itself in international capital flows, which continuously move in and out of advanced and emerging countries. Supported by the amazing development of technology in the fields of informatics and telecommunications, financial globalization has resulted in a friendlier environment for investors and for agents who are seeking funding.
The internationalization of financial markets is not recent. According to Giddy (1994), the roots of capital market internationalization can be traced back to the 19th century, when bond and equity issues were placed in European markets to supply the resources needed for the development of railroad networks and important infrastructure works in America, Asia, and other geographical regions.
At present, some specific traits define the modern process of financial globalization. For example, Cabello (1999) suggests that financial internationalization sparked off a redefinition of intermediation, because it now takes place beyond national frontiers and extends to the entire international financial system. This impressive expansion is rooted in profound structural reforms that have deregulated financial markets in many countries. According to the same author, the introduction of savings and investment alternatives is of great importance to financial globalization because it provides the vehicle that makes the swift transference of capital across borders possible. As a consequence of these changes, along with technological innovations that greatly facilitate the international mobility of capital, firms and governments now have access to financial resources that were once beyond their reach. At the same time, investors now have multiple alternatives at their disposal to diversify their portfolios more efficiently.
According to Ortiz (1995), due to the globalization of real and financial markets "the market" has expanded its role as a promoter and a regulator of economic activity, at the same time as direct intervention from the state in the economy fades out. Ortiz also reports that to overcome the stagnant negotiations of international trade agreements promoted by the General Agreement on Tariffs and Trade (GATT), several economic blocs were created. Some examples include the economic bloc that emerged from the European Union experiment, which evolved into a full Monetary Union, or the commercial bloc that comprises Mexico, Canada and the United States (U.S.), the North American Free Trade Agreement; the Association of Southeast Asian Nations; or Mercosur. Another relevant characteristic of the new world order is the intensification of competition among firms and countries for global funds.
According to Palazuelos (1998), the "new world order" is an outcome of a process that started with the economic crisis of the 1960s, which revealed its full impact during the following decade, after a relatively stable growth period since the end of the Second World War. According to the Organization for Economic Co-operation and Development (OECD), the world's average annual growth rate of 5.1% recorded from 1960 through 1968 for all member countries, diminished to only 2.6% between 1973 and 1979, with the notable exception of Japan, whose average annual growth rate during the first period was 10.4%, but only 3.6% during the second. This means that the average economic growth rate for all OECD economies was reduced to only one half during the second period.
In part, the explanation of the 1970s slowdown may be found in the increasing amount of United States dollars around the world. Martínez and Vidal (1995) documented that the amount of dollars outside the United States grew from 6 400 million U.S. dollar in 1947 to approximately 35 700 million in 1968, i.e. , a five-fold expansion, which augmented the world's money supply and resulted in increasing deficits of the United States Current Account, a disequilibrium that sooner or later had to be corrected.
By 1967, the United States recorded a large international trade imbalance which represented a continuous drain on resources, as well as a deterioration of its commercial position with respect to Europe and Japan. The excessive amount of dollars in the international financial markets also had negative consequences for the prevailing International Monetary System, which was based on a fixed parity between the U.S. dollar and gold.
Requeijo (1995) has argued that the system of fixed exchange rates represented one of the weaknesses of the International Monetary System, since the capacity of domestic monetary authorities to intervene in supporting their official parity, as international trade expanded, required a simultaneous growth of international reserves. However, the latter were mainly denominated in gold and dollars, and gold production growth was slow, relative to world trade needs. That situation became a problem for the United States monetary authorities, whose currency was convertible into gold, and whose reserves had diminished in value by more than half between 1947 and 1968, from $24 600 million to only $10 400 million, due to the withdrawals of foreign governments (Martínez and Vidal, 1995).
During the 1960s, there were several attempts to adapt the international monetary system in order to overcome the increasing pressure to which it was subjected. Speculative attacks against the dollar during the 1960s pushed the price of gold to $40 per ounce, forcing the intervention of the United States' government and the collaboration of several other developed countries' governments to stabilize the price back at $35 per ounce, the base parity under the Bretton Woods Agreement. During March 1968, the central banks of the more developed countries faced a speculative attack that forced them to sell large quantities of gold. As a result of that attack, a parallel market for gold emerged. The official price of gold remained at $35 per ounce for transactions among central banks, while market forces determined its price for private transactions. The gold market remained stable during the following three years, due to the sales of South African countries that were forced to auction important amounts to pay for their trade deficits, and to the introduction of the new concept of Special Drawing Rights in 1969. Also, higher interest rates in the euro-loans market increased the cost of any speculative activities. However, the large conversion of dollars into gold by different national governments between 1958 and 1968 reduced the gold reserves of the United States, and resulted in an insufficient coverage of its foreign liabilities.
A speculative attack against the British pound in 1963 eventually caused its devaluation in 1967, affecting the world's perception of the reliability of the Bretton Woods Agreement, because this event revealed that a reserve currency could, indeed, be devalued. After the pound's devaluation, speculators' attention was diverted against the dollar. Speculative attacks also affected other major currencies, like the French franc and the German mark. The currency exchange pressure faced by Germany forced its government to let the mark float in 1971, and the Netherlands and Japan followed suit. Almost simultaneously, Switzerland and Austria revalued their own currencies and, in August that year, flotation had extended to all the main international currencies.
Finally, on August 15th 1971, President Nixon announced the temporary suspension of the dollar's convertibility into gold, while imposing an additional 10% tariff on imports and reducing the United States' foreign aid to the rest of the world. The suspension of the dollar's convertibility into gold was the "beginning of the end" for the Bretton Woods International Monetary System. On December 18th of that same year, as part of the Smithsonian Institute Agreement, and with the purpose of maintaining the functioning of the International Monetary System, the U.S. government devalued the dollar to a new exchange rate of $38 per ounce of gold. While many last-ditch efforts were made to rescue the fixed parity system, it was impossible to equilibrate the United States Current Account or to reduce the speculative attacks against different currencies, including the dollar. In February 1973, the United States government announced a new devaluation of the dollar, this time to $42.20 per gold ounce and, in May that same year, the "Group of Ten" agreed to let all currencies float against each other.
The decision represented a de facto abandonment of the Bretton Wood Agreement, even when the official announcement was not made until three years later. The new flotation system significantly contributed to the development of the derivatives' markets.
The globalization of emerging markets
The development of emerging countries' financial markets has followed a path influenced by the prevailing international conditions. Many countries experienced a significant economic development following one of two typical development strategies: 1) an import-substitution industrialization model, including most Latin American countries; and, 2) an export-based growth model like several Southeast Asian countries and Korea.
For Latin American countries, the decade of the 1980s was a period of intense macroeconomic instability, mainly explained by the External Debt Crisis (1982).
During the previous decade, the non-oil-producing, less-developed countries had absorbed a significant share of the international markets' liquidity generated by the Organization of the Petroleum Exporting Countries (OPEC) countries' oil embargo of 1973. In many cases, the additional funds received by OPEC members were recycled through European and American banks and used to finance the countries that needed to import oil. However, there were exceptional cases like Mexico that, having discovered significant oil reserves in the mid-1970s, needed to borrow in international markets to develop its newly found oil fields and to prop its oil exporting capacity.
During the early 1980s, interest rates in the United States rose, affecting all major international debt markets. The external debt service of less developed countries that had been contracted at floating rates1 also increased proportionately. Just a few months after the initial increment, it was practically impossible for less developed indebted countries to pay their debt service. Both the Mexican and the Brazilian foreign debt exceeded $100 billion each, and that of Argentina, Venezuela, Chile, Colombia, Peru, Ecuador, Nicaragua, Bolivia, Costa Rica, Jamaica and Uruguay represented liabilities in the order of tens of billions of dollars. To give a better idea of the magnitude of this problem, Mexico's external debt represented 76% of its GDP; Argentina's, 51%, and that of Venezuela, 66%. However, for some other Latin American countries, the same indicator was much worse: Chile 120%; Bolivia 90%; Nicaragua 198%; Costa Rica 97%; and Jamaica 147%. For the rest of the less-developed highly indebted countries, foreign debt balances were in between 30% and 50% of their GDP (Martínez and Vidal, 1995).
The Mexican government was forced to declare a moratorium on its debt in 1982, and all other indebted emerging countries followed that example on their own terms. During the rest of the decade there was a notable reduction in capital flows to the less-developed countries, and only after very complex negotiations under the Baker and the Volker plans, debtor countries introduced comprehensive structural reforms, including the opening of domestic markets to foreign trade, fiscal reforms and the modernization of financial systems. Gradually, towards the early 1990s, international capital flows returned to Latin America, but this time their composition had changed significantly. Bank credit had almost disappeared and foreign direct investment took its place in Southeast Asia and Latin America.
Kaminsky, Lyons and Schmukler (2001) reported that portfolio investments represented around 30% of capital flows towards the emerging countries, rising from $1 billion in 1992 to $40 billion 10 years later. However, that could be an underestimation, since the same authors mentioned that any international inflows of funds allocated to the acquisition of more than 10% of the equity of a firm were recorded as foreign direct investment. In favor of these authors' arguments, it is worth noting that among the different mechanisms negotiated under the Brady plan to pay down external debt, was the conversion of coupon-bearing debt into government-owned firms' stock.
During the 1990s, foreign portfolio investments represented almost 43% of the total foreign capital inflows into the emerging world. Banking credit and other forms of debt not only lost relative weight with respect to the total, but their cumulative change was negative. In general terms, the growing importance of foreign portfolio flows entering the emerging world was very similar to the rest of the world (Ortiz, 2004).
While foreign portfolio investments in emerging countries had concentrated mainly on debt instruments, preferably government and corporate bonds, during the 1990s there was an increased interest in stocks. Carmichael and Pomerleano (2002) showed that the capitalization of 22 emerging markets in dollar terms reached an unexpected growth, rising from $339.3 billion in 1992 to $2.2 trillion in 2000, significantly exceeding the growth rate of the more developed markets; and Márquez, Islas and Venegas (2003) showed that between 1980 and 1997 foreign portfolio investment flows worldwide grew by a factor of almost 25 times, while foreign direct investment grew only 12 times.
Financial market integration:A brief review
Numerous studies have documented different stylized characteristics of crosscountry correlation and volatility relationships. Many focus on more developed markets, but there is an increasing interest in exploring the emerging capital markets. In what follows, we explore some representative examples of such studies. While there are many more relevant studies, our review is limited only to some of the most influential in the literature.
Karolyi and Stulz (1996) studied the determinants of correlations between the stock markets of United States and Japan. They centered their attention on the behavior of the covariance of high-frequency intraday returns of a portfolio of Japanese American Depositary Receipts (ADRs) listed on the American Stock Exchange (AMEX) and the New York Stock Exchange (NYSE), with respect to two portfolios of U.S. stocks. Their results suggest that neither U.S. macroeconomic announcements, nor industry changes, nor shocks to the Yen/Dollar exchange rate, nor changing yields on U.S. T-Bills significantly affect the co-movement between U.S. stocks and Japanese ADRs. However, these authors observed that the S&P Index's overall daily high returns were followed by high correlations and covariances the following day.
Longin and Solnik (2001) used monthly equity index returns for the United States, the United Kingdom, France, Germany, and Japan, for the period January 1959 to December 1996, to model a multivariate distribution for high stock returns, described as those that exceed a certain limit, and estimated the correlation for increasing limits (Extreme Value Theory) for international capital markets. They postulate that, under the assumption of multivariate normality, the correlation of beyond-the-limit high-yields should converge asymptotically to zero, as the limit increased. However, the empirical evidence rejected that hypothesis for negative returns. Correlations of highly negative returns tended to augment with the limit used, and were highly statistically significant. Conversely, positive high-yield correlations tended to decrease and converge to zero as the limit was increased. The authors conclude that the correlation between national markets increase in "bear" markets, but not in "bull" markets, and that crises and financial turbulence should be taken into account for the study of the international stock markets' integration process.
According to Berben and Jansen (2005), the growing economic importance of many national capital markets during the last thirty years was accompanied by a greater degree of synchronization ("co-movement") in their returns, as well as by the recurring transmissions of cross-border shocks. These phenomena may be explained by factors such as faster and more reliable electronic communications, liberalization of capital controls in most nations, and increasing worldwide economic integration.
More recently, Téllez-Gaytán and López-Sarabia (2010) analyzed the weekly correlation of returns for the Mexican Stock Exchange Index (IPC), the S&P500, the Dow Jones Industrial Average (DJIA), the BOVESPA Index (from Brazil) and the MERVAL Index (from Argentina), during a period from 1999 to 2000. Using wavelet analysis, they find that the correlation between the Mexican Stock Exchange and the other markets was not intense and only in a few cases exceeded 0.7, questioning whether the real co-movement is as strong as reported elsewhere (e.g . López-Herrera, Ortiz and Cabello, 2009).
Most studies concerning return volatility have concentrated on the dynamics of developed capital markets. For example, Kohers, Kohers and Kohers (2004) examine the changing volatility of twenty-four national capital markets from 1980 to 2003 and report common characteristics among them. For example, between 1980 and 1996, volatility remained stable but, between 1997 and 2003, it notably increased in all the countries in their sample.
While emerging stock markets are characterized by high volatility of returns, research on them is scarce. However, some examples include Choudhry (1996), who uses an Autoregressive Conditional Heteroscedasticity Model (ARCH) to study volatility and risk-premium in Argentina, Greece, India, Mexico, Thailand and Zimbabwe before and after the 1987 crash, and finds that changes observed in the ARCH model are not uniform and depend on the individual characteristics of the different markets. Similarly, Aggarwal, Inclán and Leal (1999) model the changing volatility of the 10 largest emerging markets in Asia and Latin America with Generalized ARCH models (GARCH), and report that there is a significant relationship between observed volatility changes and important economic, social or political events in those markets.
González, Spencer and Waltz (2003) found that the Mexican stock market experienced increased volatility during the 1990s. However, employing a GARCH model in combination with Tsay's (1988) "outlier" methodology, they proved that increased volatility was associated with outliers and not with the underlying market processes. This association indicates that the former were mostly domestic during the first half of the 1990s, while international factors became the main drivers after the 1995 Mexican peso devaluation crisis.
Several studies have rejected the hypothesis of constant correlations across countries (e.g. , Longin and Solnik, 2001; Engle and Sheppard, 2001; Engle and Sheppard, 2002; Goetzmann, Li and Rouwenhorst, 2002; Suleimann and Ryan, 2003; Wong and Vlaar, 2003; Harvey and Ng, 2005, and Hodrick and Zhang, 2005). Other related works include those by Wang and Moore (2008), Machado, Duarte and Duarte (2010), Antonakakis and Filis (2013), and Arouri and Nguyen (2013). However, the literature dealing with time-varying correlations in Latin American stock markets is also limited, albeit interest in these markets is wide and recent research efforts are promising.
Arouri, Bellalah, and Nguyen (2008) explore the time variations of conditional correlations between selected Latin American emerging markets and with respect to the world stock market, to shed further light on the issues of capital market integration and portfolio diversification. They estimate cross-market correlations empirically using a Dynamic Conditional Correlation (DCC)-GARCH model and a structural break analysis. The evidence reported signals that the degree of cross-market co-movements changes over time and has significantly increased since 1994, due to greater information availability and market integration. Additionally, their study demonstrates that cross-market co-movements are subject to regime shifts resulting from major stock market events.
Yiu, Wai-Yip and Li (2010) investigate the spillover of financial crises by studying the dynamics of correlation between eleven Asian and six Latin American stock markets vis-à-vis the U.S. stock market. A regional factor that drives common movements of stock markets in each region is identified for the period 1993 to 2009, in order to estimate the time-varying volatility correlation between that factor and the U.S. stock market, using an asymmetric dynamic conditional correlation model. Results indicate that there is a significant increase in the estimated time-varying correlation for the period from August 2007 to March 2009, which may be considered as evidence of contagion from the U.S. stock market towards the other two regions' markets, during the global financial turmoil. However, the authors find no evidence of contagion from the U.S. towards the Asian region during the financial crisis of 1997 and 1998, which was to be expected since the crisis originated locally.
The work of Lahrech and Sywester (2011) explores the extent to which Latin American equity markets, including Argentina, Brazil, Chile and Mexico, have become more integrated with the U.S. equity market. They measure integration using the DCC between each market and the U.S. market. Changes in correlations over time are analyzed by applying a smooth transition model which shows how long it took for correlations to evolve to their new levels. The sample period includes from December 30th, 1988 to March 26th, 2004. Results show an increase in the degree of co-movement between these countries' equity returns and those in the U.S., although the magnitude and speed of those increases greatly varies across the four countries.
To sum up, recent evidence from both developed and emerging markets suggests that financial integration during the past few decades can be characterized as an increasing and time-varying process.
Methodological issues
The first part of the analysis is based on a Multivariate GARCH model specification with DCC. The multivariate conditional variance is modeled using the Ling and McAleer (2003) Vector autoregressive moving average (VARMA)-GARCH model and the time-varying correlations with the Engle (2002) DCC model.
In our bivariate model, the specification is as follows:
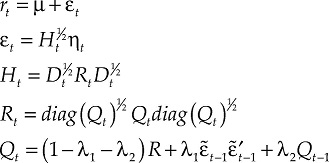
where r t is a 2×1 vector that contains the different market returns as elements; μ is a structural component often named the mean equation of the model, in this paper this component includes error correction terms and other deterministic variables;

where
According to [2], the shocks and variances of the returns of a market can affect the variance of the other market.
R is the long-term correlation matrix (non-conditional), and R t is a matrix which contains conditional quasi-correlations:

To maintain the stability of the model, the restrictions λ1 > 0, λ2 > 0, 0 ≤ λ1 + λ2 < 1 are required. Assuming that ηt ∼ t df >2 , the t period observation contributes to the log-likelihood function with:

So, if one has the observations for t = 1, 2,...,T , the estimation of the model's parameters can be performed by using the maximum likelihood method in order to maximize:

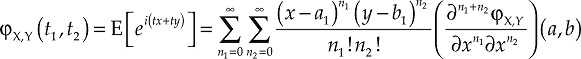
Roughly speaking, the copula is a bivariate probability model whose domain belongs to the unitary hypercube, [0,1]n. This copula domain is given by the space generated by the marginal probability distributions. This implies that copula parameters are responsible for conjugating the dependence structure, and they do so by taking into account the whole dependence structure. Copula models have become popular because they make it possible to go beyond the traditional correlation dependence approach, which is able to detect all the dependence structure only if the data are jointly normally distributed; in any other case, the higher distributional moments are missed. This approach can be better understood when considering that the characteristic probability function is only a Fourier transform of the probability function and that all the probability moments can be reduced to derivatives of that characteristic function, which is a Taylor series approximation of the characteristic function, i.e. :
In our data, where higher order dependence is suspected, the copula approach is especially useful because its flexibility allows us to explore a lot of non-normal approaches that can be fitted to a time series, especially when major changes in volatility are observed. In fact, there is some empirical evidence that the kurtosis excesses are related to volatility clusters; for further details see Bai, Rusell and Tiao (2003), Kirchler and Huber (2007) or Curto, Pinto and Tavares (2009).
The copula methodology is not new. It all started as an answer from Sklar (1959) to Fréchet when they were working on auxiliary tri-variate distributions. An in-depth insight on the Sklar Theorem can be found in Nelsen (1999), Cherubini, Luciano and Vecchiato (2004) or Genest, Gendron and Bourdeau-Brien (2009). The main idea of the Sklar theorem is that any multivariate distribution can be written as:

such a representation is unique if the marginal distributions are continuous.
With the copula representation we can see that the copula approach may be implemented by using a two-stage approximation: the first one is to adjust the better marginal distribution and the second stage is to fit the best copula to the empirical data. As in other cases, the fitting procedure must be made using a two-stage maximum-likelihood method with the R copula package; interested readers can see Yan (2007) for a better approach. The fitting details can be viewed in Joe and Xu (1996) and Shih and Louis (1995).
In fact, the Sklar theorem is a first approach to the copula composition and a number of interesting copula characteristics and attributes that deserve careful study. Interested readers can consult the copula composition method in Cherubini, Luciano and Vecchiato (2004). We will skip the details about this important discussion in order to focus on the financial dependence modeled with the copula.
In this paper we use a Clayton copula approach, a member of the Archimedean family, in order to make it easier to compare the dependence parameter. In general, the Archimedean copula family is defined by:

The Clayton copula was chosen because it was the best fitted copula due its greater dependence on negative tails, which is precisely what happens in the relationship between the returns of the Mexican Morgan Stanley Capital Index and the World Morgan Stanley Capital Index. This means that the index return relationship gets stronger during volatility (crisis) periods. Specifically, the Clayton copula is given by:
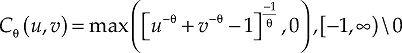
Another interesting feature of this copula class (which renders it suitable for our purposes), is its invariance under truncation; further details can be seen in Oakes (2005). This property is very useful in the financial analysis because the empirical sample may not contain the worst possible realization, or the worstcase scenario may be tempered by a market stop (as occurred during the 1929 crisis). In any case, this is equivalent to a data censorship and could be the source of the "tail myopia" effect on market risk, v .g ., the Value at Risk myopia.
Empirical analysis
This section presents our analysis of the relationship between the Mexican Capital Market and the World Capital Market using econometric time series techniques and copula analysis. The data used for the analysis were the World Capital Market Portfolio Index and the Mexican Capital Market Index, both obtained from the Morgan Stanley webpage. The time span covered by the data goes from December 1987 to October 2013, with monthly frequency, and measured in U.S. dollars. Figure 1 shows the trajectory of both indexes, the Mexican Market Index plotted on to the left vertical axis and the World Capital Market Index on the right vertical axis.

At first sight, the Mexican Index (MSMX ) resembles the pattern of behavior followed by the World Capital Market Portfolio Index (MSWORLD ) most of the time, except by scale effects. The World Market Index exhibits sharp drops in its level both from mid-2000 to the end of 2002 approximately, as well as from mid-2008 until the end of 2009. The first decline can be associated with the "dot-com" bubble burst, and the second one with the crash associated to the subprime crisis. The Mexican market index also fell sharply towards the end of 1994, related to the Mexican peso's harsh devaluation and the subsequent economic downturn.2 It is also noticeable that the Southeast Asian, Brazilian and Russian financial crises (2007-2008) affected the behavior of the Mexican Market Index.
When the data was transformed into logarithms and displayed graphically, as is the case in Figure 2, the vigorous growth of the Mexican Market (LMSMX , plotted on the left axis) contrasts with the steadier but less energetic pace observed in the case of the World Market Index performance for the whole period.

Figure 2 World Capital Market Portfolio & Mexican Capital Market Portfolio December 1987-October 2013, logs.
Perron's (1997) unit root tests, reported in Table 1, suggest that the logarithmic series of both capital market indexes can be treated as non stationary I(1) variables, but their first differences can be regarded as stationary I(0) variables. It is important to recall that Perron's test takes into account the presence of structural breaks in the data. Under the null hypothesis, the series has a unit root with a break in the intercept (type A model), or in the trend (type C model); or, a joint intercept and trend break (type B model). An advantage of Perron's test is that, even under the alternative hypothesis, the break is taken into account. In our analysis, the tests for the Mexican Market Index series suggested that the break took place around the 1994 Mexican crisis and the 1998 Russian-Brazilian financial crisis. In the case of the World Market Index, all the tests suggest that the breaks are related to the United States' 2008 financial crisis.
Table 1 Perron (1997) unit root tests in the presence of structural breaks.
| Variable | A | B | C |
|---|---|---|---|
| LMSMX | -3.78 | -4.30 | -3.26 |
| LMSWORLD | -3.27 | -3.24 | -2.46 |
| DLMSMX | -16.86 | -16.95 | -16.38 |
| DLMSWORLD | -17.19 | -17.15 | -16.18 |
| Critical values: | |||
| 1% significance level | -5.92 | -6.32 | -5.45 |
| 5% significance level | -5.23 | -5.59 | -4.83 |
| 10% significance level | -4.92 | -5.29 | -4.48 |
Note: A is break in the intercept; B is joint break (intercept & trend), and C is break in the trend.
To assess if there is a long-run equilibrium relationship between the Mexican Market Index and the World Market Index, we performed the Johansen, Mosconi and Nielsen (2000) cointegration test. In the specification of the test, a "constant" and a "trend" were introduced into the cointegration space. Two potential breaks in the constant and in the trend of the cointegration relationship were also considered. The first break included was associated to the 2000 Dot-com Crash, and the second to the 2008 Global Financial Meltdown.
According to Table 2, an equilibrium relationship ties the path of both series in the long-run, suggesting that the Mexican capital market is fully integrated into the world capital market despite the breaks of the Mexican market performance.
Table 2 Cointegration test in the presence of structural breaks (Johansen, Mosconi and Nielsen, 2000).
| H0 | LR | p-value | 90% | 95% | 99% |
|---|---|---|---|---|---|
| 0 | 53.74 | 0.0110 | 44.03 | 47.39 | 54.13 |
| 1 | 16.14 | 0.3734 | 22.01 | 24.55 | 29.80 |
Note: One lag in the VAR in levels. Trend and intercept included p-values computed by response surface method.
Figures 3 and 4 show the log-returns for the Mexican market index and for the world market index, respectively, in both cases multiplied by 100.

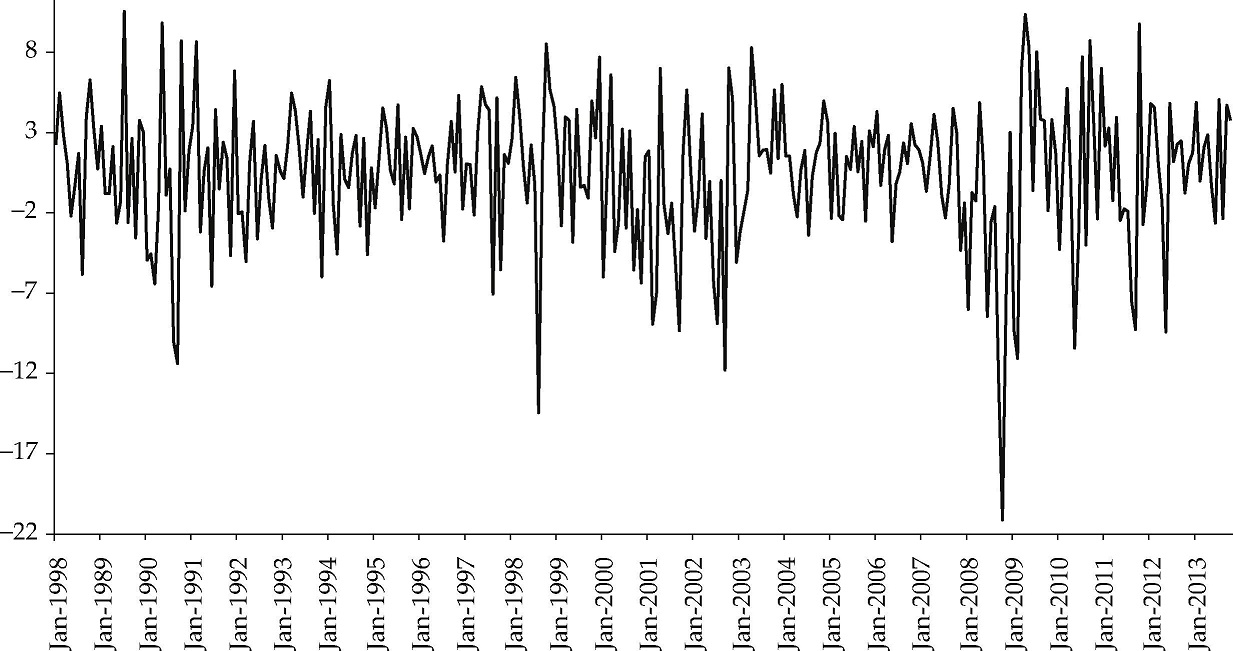
We estimated the model presented in Table 3 in order to model the Mexican Market and the World Market returns, so as to analyze the relationship between their volatilities, considering that correlations are time varying. This model is a bivariate specification formed by a zero-lags Vector Error-Correction (VECM) in the equation of the mean, including an error correction term and several dummy variables to take into account the main crisis episodes during the estimation period. The variance equation is a bivariate VARMA-GARCH model and the time varying correlations are modeled by means of a DCC model. Also, the residuals are assumed to follow a t distribution, because that way it is easier to capture the effects of heavy tails than it would be with a normal distribution.
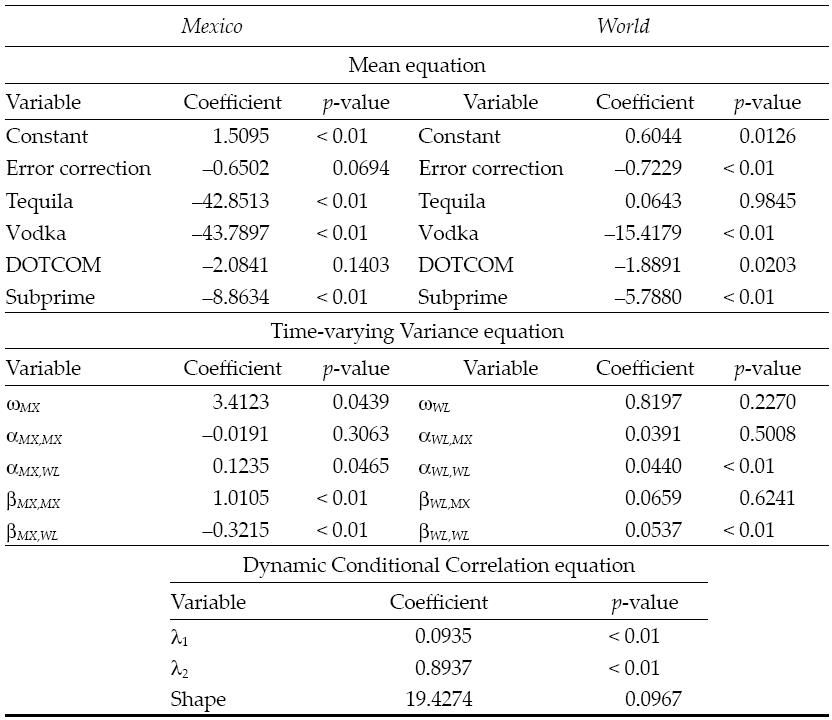
According to our estimations, both markets respond to a long-run equilibrium relationship, even when they sometimes depart from it. Notoriously, the World Market response is quicker than the Mexican Market, correcting in one month a larger proportion of its deviation. The Vodka and Subprime crises affected the performance of both indexes, with more severe effects on the Mexican Market's returns. It is worth mentioning that our estimation of the effect of the Russian debt crisis on the Mexican market returns is slightly higher than the negative effect related to the free fall that resulted after the exchange rate devaluation and the beginning of the economic crisis at the end of 1994. The scope of the Tequila collapse was only domestic, affecting the Mexican Market without a significant impact on the World Market. In contrast, the dot-com bubble-burst affected the World Market, but not the Mexican Market. That result may be explained by the insignificant exposure of Mexican investors to technology companies' stock. Another part of the explanation is that the weight of the United States Market is very heavy in the calculation of the World Capital Market Index. Regarding the variance equation estimation, it is also worth noting that the World Capital Market returns can influence the variance of the Mexican Market returns, but the latter do not influence the variance of the former.
Figure 5 shows the time-varying correlations of the World Capital Market returns and the Mexican Capital Market returns. It is clear that the correlations have followed an upward trend since the 1990s. Despite the observed pullbacks, during the last months of the period under analysis the degree of association of the Mexican Market Index to the World Market Index was higher in comparison with the previous observations, suggesting a tighter level of integration of the Mexican Capital Market into the World Capital Market in recent years.

Figure 5 Dynamic Conditional Correlations of World Capital Market Portfolio & Mexican Capital Market Portfolio Returns, December 1987-October 2013.
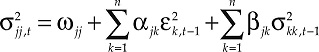
To gain a deeper understanding of the relationship between the World and the Mexican capital markets, we proceeded with a copula analysis approach, taking into account the long-run association and the structural breaks previously detected. The main focus of our copula analysis is to improve our understanding of the change of strength in the dependence measure, conditional on the volatility of returns. In order to determine the volatility regimes, we set the 90th percentile of the conditional volatilities provided by our multivariate GARCH model as the threshold above which a volatility measure is classified as belonging to a high volatility regime. Following that rule, out of the original 310 monthly observations we obtain a high volatility sample of 44 observations and a low-normal volatility sample of 266.
Figure 6 shows the scatter plot for the entire sample and the two volatility regime samples. In all graphs we use the same scale, facilitating the appraisal of the pattern of association between the returns of both markets. At first glance it is notoriously apparent that the extreme negative returns tend to be more scattered than positive and mildly negative returns, something that could have been anticipated since the presence of fat tails and high kurtosis in financial returns is a very well known fact.

Our copula analysis uses logistic marginal distributions to capture the departures from the normal distribution (fat tails and excess kurtosis) usually observed in the distribution of securities' returns. Table 4 presents the fitted parameters of the logistic marginal distributions of the three subsamples and the corresponding Kolmogorov-Smirnov (KS) tests. The Cramer Von Mises tests do not reject the hypothesis of logistic marginal distributions of returns nor the adequacy of a Clayton copula for modeling the structure of dependence between the returns of the Mexican and the World capital markets.
Table 4 Fitted parameters of the logistic marginal distributions.
| Mexican Capital Market | World Capital Market | ||||
|---|---|---|---|---|---|
| Parameter | Standard error | Parameter | Standard error | ||
| Total sample | Location | 2.1940 | 0.4498 | 0.8270 | 0.2323 |
| Scale | 4.6568 | 0.2087 | 2.3916 | 0.1093 | |
| KS | 0.0404* | 0.2416* | |||
| High volatility | Location | 3.4735 | 1.3966 | 1.4032 | 0.8646 |
| Scale | 5.4730 | 0.6267 | 3.3504 | 0.3932 | |
| KS | 0.8156* | 0.9049* | |||
| Low volatility | Location | 1.9883 | 0.4683 | 0.7720 | 0.2324 |
| Scale | 4.4853 | 0.2184 | 2.2131 | 0.1093 | |
| KS | 0.6133* | 0.7573* | |||
| CVM | 0.0391 | 0.0594* |
Notes: KS is Kolmogorov-Smirnov test, CVM is Cramer Von Mises test, and * is p-value.
Both estimated dependence parameters of Clayton's copula and Kendall's tau reported in Table 5 suggest that the level of the dependence between the returns of both markets changes in a very dramatic way when the return volatility is high: the θ estimate in that case is greater than the value estimated for the low volatility regime by more than 195%, and τ more than doubles its value for the same comparison subgroups. The lower and upper tail dependence measures (γlower and γupper) are also presented in Table 5. The value of the lower tail index in the high volatility regime is markedly larger than in the low volatility regime, or even when compared to the total sample. In other words, the dependence of the more negative returns is tighter when volatility is higher. When the values of the upper tail index are analyzed, an opposite result is obtained. The upper tail index values suggest a stronger dependence when volatility is lower.
Table 5 Estimated dependence parameter (Clayton Copula).
| θ | Standard error | Kendall's τ | γlower | γupper | |
|---|---|---|---|---|---|
| Total sample | 0.7262 | 0.1020 | 0.2663 | 0.0741 | 1.6150 |
| High volatility | 1.7257 | 0.4573 | 0.4632 | 0.2239 | 1.3308 |
| Low volatility | 0.5843 | 0.0968 | 0.2261 | 0.0466 | 1.6947 |
Note: γlower and γupper, respectively, lower and upper tail indexes.
Concluding remarks
The legal reforms that opened Mexico's financial markets to the participation of foreign investors propitiated the inflow of capital, which to a large extent has supported the outstanding long-run performance of the Mexican capital market in spite of domestic and/or foreign turbulence periods. As a consequence, there has been a greater degree of integration of the Mexican Capital Market into global financial markets. This paper has presented econometric evidence of that process.
Among the most relevant findings, our results suggest that the volatility spillovers go from the World Market towards Mexico, and not in the opposite direction. This is something to be considered by both portfolio managers and market authorities. Also the fact, as reported in the paper, that when market volatility is high, the downside risk produces a stronger association between the Mexican and the World market indices, reducing the potential diversification benefits that could have been captured otherwise.
However, the reduction of the benefits due to international portfolio diversification in the setting of an increasingly global financial industry is well-known and widely documented stylized fact in the literature. What should be a matter of new concern is the fact that the dependence structure between the Mexican and the World capital markets could also be strong in the lower tail of the distribution of returns, when market volatility is low, as our findings show.
In simple terms, this means that when market sentiment happens to be optimistic, the real benefits of international diversification may be lower than predicted by standard international portfolio theory models. It would be paradoxical that risk exposure can lead to a decrement of diversification gains, both during downside and upside periods, and, if further similar testing corroborates that finding, it is likely to represent a significant paradigm shift for investment science, as well as for professional international portfolio management practice.
During recent decades, the Mexican Capital Market favored its efficiency (although we do not document it in this paper). However, its deregulation and internationalization seem to have reduced the diversification benefits that existed when it was less integrated (more segmented).
More research is required to better understand the mechanisms by which the Mexican financial markets are becoming more integrated with global financial markets and, more specifically, their consequences and practical implications.
Our results highlight the complexity of the process, and the concerns that result from the potential effects of increasing capital market globalization trends on international portfolio diversification.

