


Serviços Personalizados
Journal
Artigo
 Inglês (pdf)
 Artigo em XML
 Referências do artigo
 Enviar este artigo por email
Indicadores
-
 Citado por SciELO
 -
 Acessos
Links relacionados
-
 Similares em
SciELO
Similares em
SciELO
Compartilhar

 Permalink
Investigación económica
versão impressa ISSN 0185-1667
Inv. Econ vol.70 no.276 Ciudad de México Abr./Jun. 2011
Overaccumulation of productive capital or of finance capital? A view from the outskirts of a Marxist debate
¿Sobreacumulación de capital productivo o de capital financiero? Un punto de vista desde los márgenes de un debate marxista
Rune Skarstein*
Norwegian University of Science and Technology (NTNU). E–mail: rune.skarstein@svt.ntnu.no.
Received January 2011.
Accepted March 2011.
Abstract
The starting point of this paper is a discussion of an apparently neglected aspect of Marx's theory of surplus value and profit suggesting that finance capital can temporarily be decoupled from the productive sector in its hunting for profits. Then follows a discussion of the basis in the real economy for profit seeking and accumulation of finance capital in the last three decades, viz. the dominance of shareholder value, low wage policy combined with mortgage (re–)financing particularly in the US, the turn to fully funded pensions, and the rising foreign deficits and debt of the US. The paper next discusses new means of financial profit seeking, viz. credit derivatives, hedge funds, private equity funds and the increasing use of leverage within the financial sector. In the final section, it is argued that the present crisis is essentially a crisis of overaccumulation of finance capital which has turned into a general economic crisis characterised by increasingly deficient demand. The paper concludes that what is at stake is not only regulations, but the entire accumulation model of financialised capitalism.
Key words: rate of profits, financial sector, income distribution, accumulation of finance capital, economic crisis.
JEL Classification:** B5, E3, E5, G1, G2, P1
Resumen
Este artículo comienza discutiendo un elemento de la teoría de Marx en relación con la plusvalía y el beneficio que, aparentemente, no ha sido tenido en cuenta. Nos referimos a que sugiere que el capital financiero puede estar temporalmente disociado del sector productivo en su búsqueda de beneficios. A continuación, se discuten las bases para la búsqueda de beneficios y la acumulación de capital financiero en la economía real durante las tres últimas décadas, a saber, el predominio del valor de los accionistas, la política de bajos salarios combinada con la (re)financiación de préstamos hipotecarios particularmente en Estados Unidos, el giro hacia las pensiones completamente fondeadas y el crecimiento del déficit y la deuda externa estadounidenses. Le sigue una discusión sobre los nuevos instrumentos importantes de búsqueda de beneficio financiero, a saber, los derivados de crédito, los hedge funds, los private equity funds, y el creciente uso del apalancamiento en el sector financiero. El articulo concluye argumentando que la crisis actual es esencialmente una crisis de sobreacumulación de capital financiero que ha derivado en una crisis económica general, caracterizada por una demanda efectiva crecientemente deficiente. Desde nuestro punto de vista, lo que está en juego no es sólo la regulación, sino el modelo de acumulación del capitalismo financiarizado.
Palabras clave: tasa de beneficios, sector financiero, distribución del ingreso, acumulación de capital financiero, crisis económica.
INTRODUCTION
The prevailing Marxist explanations of the present economic crisis face a double dilemma. First, the crisis started in a period when the rate of profits in the corporate sector of the United States (US), according to current measures, tended to rise in the period from 1982 to 2007 (with a small dip in 1997–2002), after falling from the mid–1960s until the early 1980s (cf. Duménil and Lévy 2002; Wolff 2003; Mohun 2006; Shaikh 2010a). However, Marxist theories explain crises as a result of a falling rate of profits. And second, many Marxist economists concede that the crisis was triggered by processes in the financial sector, which is unproductive in terms of surplus value, but they deny that the causes of the crisis are located in that sector.1 In other words, Marxist explanations tend to ignore that the dynamics of the financial sector could be the ultimate cause of economic crises.2
In this paper, I will first discuss some aspects of Marx's theory of surplus value and profit which suggest that finance capital may temporarily be decoupled from the productive sector, on which it of course depends for its hunting of profits. Then follows a section discussing the basis of financial profit seeking, i.e. aspects of the real economy which have been essential for the accumulation of finance capital in the last two to three decades. The next section discusses new means of financial profit seeking, so–called financial innovations, in the last about 20 years. The final section argues that the present crisis was caused by overaccumulation of finance capital in relation to its profit possibilities. This crisis has turned into a general economic crisis characterised by increasingly deficient effective demand.3
SOME ASPECTS OF MARX'S THEORY OF SURPLUS VALUE AND PROFIT
The omission of the dynamics of finance capital in Marxist economics may have its origin in Marx's own work. In his theory of economic crises, and most conspicuously in his discussion of the tendency of the rate of profit to fall, his focus of analysis was the direct relationship between capital and labour in the surplus value productive sector of the economy with industry as the outstanding example. This is no wonder, since the financial sector was rather underdeveloped at Marx's time. However, Marx analysed credit and the banking sector and made clear that interest is a part of total surplus value originating from the productive sector and therefore, other things being equal, implies a reduction of profits in the productive sector.
In his analysis of the equalisation of profit rates within and between sectors, he showed that the profit "extracted" by each single capital may be different from the average profit of total capital, for two reasons. First, the rate of surplus value (surplus value divided by the value of labour power) of each single capital could deviate from the rate of surplus value of total capital. And second, the value composition (value of constant capital divided by the value of labour power) of each single capital could deviate from the value composition of total capital at equal rates of surplus value. Of course, there may also be a large variety of combinations of these two reasons.
In other words, as a consequence of capitalist competition the profit rates of single capitals tend to be equalised as capital moves from branches or sectors with relatively low rates of profit to branches with a higher profit rate. The main point here is that the single capital will not in general realise the surplus value which is produced under its command. By contrast, "Equally large capitals which [...] command quite different quantities of surplus labour, i.e. produce different quantities of surplus value, bring equally large profits" (Marx [1861–1863] 1968: 474). In other words, in the equalisation of the rates of profit the quantity of profit of each single capital is not determined by the quantity of surplus value this capital has extracted, but by the value of advanced capital multiplied by the general rate of profit. Even capitals which do not command any surplus labour, will, to the extent that competition results in equalisation of the rates of profit, harvest a profit which is more or less proportional to the advanced quantity of capital. This means that, through capitalist competition all forms of capital, including finance capital, harvest a profit which is more or less proportional to its size and varies around the general rate of profit.
Marx emphasised that, "It is the rate of profit that is the driving force in capitalist production, and nothing is produced save what can be produced at a profit" (Marx [1894] 1981: 368.) Because profit seeking is the driving force in the capitalist mode of production, many capitalists will consider the surplus value productive sector of the economy as a troublesome or unnecessary roundabout. Money capital which seeks profits within the financial sector, makes a shortcut in its hunting for profit. Therefore it is not granted that profits realised in the surplus value productive sector will re–enter the circuit of capital in that sector, even if effective demand (for consumer goods, investment goods and net exports) is sufficient for the realisation of surplus value as money capital. Marx saw clearly this aspect of capitalism:
It is precisely because the money form of value is its independent and palpable form of appearance that the circulation form M–M' ["money–more money"] which starts and finishes with actual money, expresses money–making, the driving motive of capitalist production, most palpably. The production process appears simply as an unavoidable middle term, a necessary evil for the purpose of money–making. This explains why all nations characterized by the capitalist mode of production are periodically seized by fits of giddiness in which they try to accomplish the money–making without the mediation of the production process (Marx [1884] 1978: 137).4
He also pointed out that,
the circuit M–M' is the absolute form of capital, value which valorises itself. Now we find M–M' as subject. [...] In M–M' we have the most vacuous idea of capital, the distortion and reification of the relation of production in the highest power [...] Capital appears in a form where it seems to be an independent source of value. This is partly due to the fact that its contradictory character is wiped out, as it does not appear to be in a contradictory relation to labour (Marx [1861–1863] 1968: 477, 454, 458–459).
However, there appears to be an ambivalence in Marx's conceptualisation of money capital in the form of share capital or other types of securities when he characterises these forms as "fictitious capital" and their market price as "illusory capital value" (Marx [1894] 1981: 597, 599). Possibly, this ambivalence combined with the underdeveloped character of finance capital at his time, is the reason why he analyses money capital only in its direct relationship to productive capital and does not examine the endogenous dynamics of finance capital.
Also, there is an inconsistency in Marx's representation of the rate of profit. As we have seen, he says clearly that all capital, including all types of interest bearing capital, participates more or less in proportion to its size in the distribution of total profit. Then finance capital should also be included in the denominator of the general rate of profit. However, he includes only productive capital when analysing the tendency of the rate of profit to fall in the third volume of Capital. In doing this he is not alone. In national accounts, 'capital' is represented only as 'real capital' in terms of implements, such as machines and buildings, i.e. by and large "capital which sucks up surplus labour" (Marx). Finance capital which hunts profits within the financial sector without any direct contact to the real economy is not registered in the national accounts. Therefore, the tremendous accumulation of finance capital, especially after 1990, is not visible in the national accounts. Finance capital is not included neither in the calculations of capital–output ratios, nor in the calculations of profit rates.
Probably, the reason for this omission is a view, which is apparently shared by most economists from leftist Marxists to Keynesians, that magnitudes in the financial sector mirror magnitudes in the real economy, in the sense that they are the result of interactions between the real economy and the financial sector. This is not the same as the "veil of money" in neoclassical economics. However, it implies that accumulation of finance capital cannot, not even in short periods, take place on its own, virtually decoupled from the real economy.5 In my view, this conception is wrong.
Of course, large parts of the financial sector, especially much of banking and insurance, are a necessary complement to the productive sector of the economy. However, the financial sector has grown far beyond the size and the functions needed to provide loans or insurances to the productive sector. Instead of financing investments in the real economy the financial sector has established its own circuits of capital, making financial investments and realising temporarily huge profits from such investments. Roughly speaking, that part of the financial sector which is mainly involved in the trading of securities of all sorts and which develops ever new types of securities to make profits on that kind of trade, represents accumulation of finance capital. However, ultimately, the profit seeking of finance capital depends on particular conditions in the surplus value productive sector of the economy, which have of course changed over time. First, I will therefore discuss aspects of the real economy which have been essential for the accumulation of finance capital in the last two to three decades.
THE BASIS OF FINANCIAL PROFIT SEEKING
The rising dominance of shareholder value
An important aspect of the turn to neoliberalism around 1980 was the increasing emphasis on shareholder value. This turn reflects a change of power relations within the corporate system. Advocates of this change argue that because the shareholders are the owners, corporations should be subject to "shareholder democracy". Also, this ideology holds that the shareholders are the actual risk–takers in enterprises. For these reasons, the objective of corporate management should be the maximum increase of shareholder value, and management remuneration incentives should be designed to serve that purpose (cf. e.g. Rappaport 1986; Aglietta and Rebérioux 2005).
The increasing emphasis on shareholder primacy has led to a significant change in the distribution of profits between dividends and retained profits. In the United States, dividends as a proportion of total profits in non–financial companies excluding farming doubled from 24.7% in 1980 to 50.1% in 1990, and remained roughly at this percentage until the end of the decade. After 1997, total profits started to fall, from a level of almost 500 billion dollars in 1997 to about 325 billion in the dot.com crisis 2001– 2002. However, the volume of dividends continued to rise in the whole period 1989–2003, exploded after the year 2000, and reached a stunning 87% of total profits in 2003. As Aglietta and Rebérioux point out,
Thus, for more than 20 years, we have been observing a regular rise in dividends, completely detached from movements in profits. [...] for the last two decades shareholders have succeeded in partially guaranteeing their income against trading fluctuations, thus significantly reducing the risk they incur. Consequently, the argument that the firm should be managed in the exclusive interest of its shareholders because they are the ones incurring the risk loses a lot of its validity (Aglietta and Rebérioux 2005: 36).
There can be little doubt that the increasing emphasis on shareholder value, implying a redistribution of profits in favour of shareholders, has facilitated the accumulation of finance capital in the recent decades. However, this process was also conditioned by the stagnant effective demand and foreign competition in the US economy, leading to a low growth rate of real investments. From 2000 to 2006 private investments excluding housing rose by only 6.5%, while the gross domestic product (GDP) rose by 16.3% thanks to a relatively strong rise in private consumption (cf. Organisation for Economic Co–operation and Development, OECD, 2007: 239–261). Thus, stagnant demand for US produced goods facilitated the change from real to financial investments. Moreover, the run for shareholder value fuelled inflation in share markets around the whole world, which of course implied rapidly rising capital gains for shareholders as long as the party was going on. The New York Stock Exchange Index rose from a then historical peak of about 4 700 points in August 2000, to a new historical peak of about 10 600 points in July 2007.6 However, between 1 January and 11 October 2008, the total market value of shares in US corporations declined by 40%, from about 20 000 billion US dollar to 12 000 billion. Also in other countries, the fall of share prices was about 40%.7
Subprime lending, house price inflation and mortgage refinancing
Many commentators argue that subprime lending in the US caused the financial crisis. In my assessment this is an exaggeration. But, of course, subprime lending did play a role. According to the newsletter of US mortgage banks, Inside Mortgage Finance, total payments of subprime loans in the period 2000–2007 amounted to 2 500 billion dollar. In March 2007, the value of subprime mortgages in the US was estimated at 1 300 billion dollar.8
These figures represent modest amounts compared to estimates of the total Federal rescue package. In March 2009, Bloomberg News reported that that the US government and the Federal Reserve had used, lent out or pledged 12 800 billion US dollars, or 42 100 US dollar per household.9 In July 2009, the special inspector general for the Troubled Assets Relief Program (TARP), Neil Barofsky, stated that the total federal rescue packet could reach 23 300 billion dollar.10 These figures indicate that far more than non–performing subprime loans burdened the assets of US banks in the financial crisis. The defaults of subprime borrowers may have triggered the crisis, but were not its decisive cause.
Large–scale refinancing of real estate —primarily homes— made possible by a low interest rate and the price inflation of houses, was apparently a far more important cause.11 Only in 2005, 40% of existing mortgages were refinanced (Feldstein 2007: 7). Such transactions contributed considerably to the steep rise in the total debt of households especially from 2000 onwards.
Total household debt increased by 97% from 2000 to 2007, reaching 13 800 billion US dollar corresponding to 133% of disposable income in 2007. Mortgage debt contributed strongly to this increase, rising from 69% of total debt in 2000 to 76% in 2007 (table 1). However, it should be noted that the subprime debt of 1 300 billion US dollar represented only 12% of total mortgage debt. Through mortgage refinancing home owners obtained "free cash" for consumption. This explains why private consumption in the US rose by 20.1% from 2000 to 2006, which was more than the growth of GDP of 16.3%, although real wages increased very little (cf. OECD 2007: 239–261).
The virtual destruction of labour unions was an important condition for the low wage policy in the US. The proportion of unionised labour in the private sector declined from more than 30% in the 1950s to 24% in 1976 and barely 10% in the year 2000 (Brenner 2002: 53). The real wages of workers in the non–agricultural private sector (in 1982–dollars) peaked in 1972 at 8.99 dollar per hour, and by 2006 had fallen to 8.24 dollar, despite the enormous growth in productivity in that period (Foster and Magdoff 2009: 129–130). From 2001 to 2006, the average real wage in the US rose by less than half of the productivity growth. Through this process, the wage share in the US economy declined while the profit share rose correspondingly (cf. Mohun 2006: 358; Baker 2007: 4–8; Foster and Magdoff 2009: 129–130).12 Thus, credit financed private consumption compensated to a large extent for the stagnation in wage financed consumption and led to a higher overall effective demand and higher employment than would otherwise have been the case.
According to one estimate, consumers drew more than 9 000 billion US dollar in cash out of their home equity from 1997 until the end of 2006, an amount equal to more than 90% of disposable personal income in 2006 (Feldstein 2007: 7). Another estimate indicates that the "free cash" originating from this debt process rose from an average of 5.2% of disposable household income in the period 1991–2000, to 11.9% in 20012005 (Greenspan and Kennedy 2007: 25). Only a small rise in the interest rate was sufficient to bring a large number of households into economic distress with difficulties in servicing their debt. The bubble had to burst, sooner or later.
The turn to mandatory fully funded pensions
The essential aspect of the pension reforms in Western countries since around 1990 is the shift from mainly "pay–as–you–go" schemes where current payments of pensions were financed through current taxes, to fully funded pensions. In the fully funded schemes, a part of workers' income is deducted to be saved, individually or collectively, for later pension payments. The neoclassical argument for this change is that the transition to full funding would cause a once–and–for–all increase in total savings, and as a consequence an equivalent increase in the capital stock and output per capita. This output increase should prepare the society for the future aging of the population.
It is an open question whether fully funded pensions will actually lead to higher total savings. And, more importantly, this argument is based on the pre–Keynesian view that savings determine investment, not vice versa. Also, the argument ignores Keynes's saving paradox, that increased savings will result in lower effective demand and lower output in situations of less than full employment (cf. Cesaratto 2006).
On the other hand, it is evident that the fully funded schemes have led to an enormous rise in the assets and turnover of different types of institutionalised pension funds, as well as pension savings managed by insurance companies. According to estimates made by Morgan Stanley, by the end of 2007, pension funds globally managed a capital of 22 000 billion US$ (1.6 times the US GDP), while insurance companies managed a capital of 18 000 billion dollars.13
In the climax of the crisis virtually all pension funds around the world experienced that funding of pensions is a dangerous game. From the end of 2007 until the end of the first quarter of 2009, US private pension funds and state and local government employee retirement funds had a combined loss of financial assets of 3 195 billion US dollar, corresponding to a writing down of assets by 33 per cent.14
The growth of sovereign–wealth funds
Many countries with large and persistent trade surpluses, especially petroleum producing countries, do not need all their foreign exchange earnings as reserves with their central banks. This situation has given rise to the growth of sovereign–wealth funds. After the mid–1990s these funds have grown to a considerable size. At the end of 2007, the total sovereign–wealth funds globally amounted to 2 876 billion US dollar, most of which invested in shares and bonds. Of the total amount, 2 103 billion US dollar, or 73%, were petroleum related funds. Table 2 shows funds of 50 billion US dollar or more at the end of 2007.
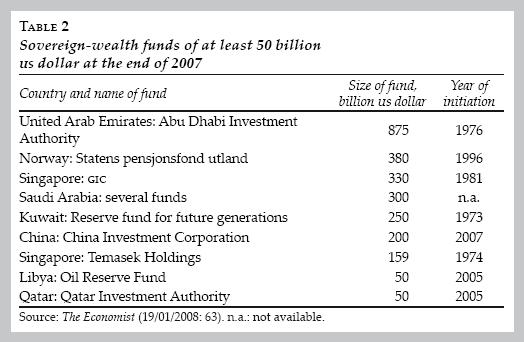
The majority of these funds (the Chinese fund is an exception) are solely hunting the largest possible and at the same time reasonably secure returns from investments in international financial markets. Thus they represent a considerable addition to the accumulation of finance capital. In general, the states leave the management of the funds to brokers and investment banks, which have cashed large fees for this activity. Since much of the funds are invested in shares, there is reason to assume that they contributed considerably to the price inflation in share markets up to 2007.
The rising deficits and foreign debt of the United States
The special role of the US dollar as trade and reserve currency in the world economy has implied a rising international demand for US dollar. This has not only permitted, but to a considerable extent necessitated the United States to run large and permanent deficits in foreign trade. The US had foreign trade deficits in all years from 1976 to 2009, and current account deficits in all years in the same period, except 1991. In the period 19822006, the accumulated trade deficit of the US amounted to 5 545 billion US dollars, while the accumulated current account deficit in the same period was 6 168 billion US dollar. In 2006, the current account deficit reached a historical peak of 788 billion US dollars, or 6% of GDP.15
The large current account deficits imply a rising foreign debt, and the net foreign debt of the US doubled from 2002 to 2009 (cf. table 3). Today, the US has by far the largest net foreign debt in the world, and in 2006, the net foreign debt of the US was twice as big as the total gross debt, of 3243 billion US dollar, of all developing countries (cf. International Monetary Fund, IMF, 2007: 272).16
Related to the trade deficits (TD), are general government (public) sector deficits (GD) and private sector deficits (PD), where PD + GD = TD.17 Thus, one should speak of a triple deficit in the US economy. For the 25 years 1982–2006, the accumulated public sector deficit in the US amounted to 5 624 billion US dollar. In 2010, it is estimated to reach 1 556 billion US dollar, corresponding to 10.6% of GDP.18 The rising deficits in 2009 and 2010 are mainly due to the rescue packets to the financial sector and the expansionary fiscal policy to counteract the crisis. However, before the crisis, the federal deficit rose from almost zero in 2001 to 4.6% of GDP in 2003 and 2004. This was due to the Busch administration's tax cuts, favouring the rich, as well as rapidly rising military expenditures in Iraq and Afghanistan.
There is an intimate relationship between the US public and private sector deficits and the current account deficits. Public deficits are covered mainly by issuing government securities (Treasury Bills and Bonds) which are mainly sold abroad. Dollars accumulated as trade surpluses by foreign countries are re–circulated back to the US mainly through purchases of US government securities which are sold to finance the budget deficit. Net foreign acquisitions of US government and government backed securities increased from 150.6 billion US dollars in 2000 to a historical peak of 963 billion dollar in 2008 (cf. table 3). The largest assets in US dollar are held by China (accounting for 27.8% of the US trade deficit in 2006), Japan and the oil producing countries in the Middle East.19 In 2007, dollar denominated US securities at an estimated value of 3 500 billion dollar were held by Saudi Arabia and other oil producers in the Middle East. By March 2010, China was holding US Treasury bills and bonds at an estimated value of more than 895 billion dollar.20 Thus, the US government's issuances of Treasury bonds serve a double purpose: They cover the government deficit as well as the current account (and trade) deficit.
The trade in US government securities has also represented an important income for US financial institutions involved in that trade, and in addition represented an enormous source of liquidity to the US financial sector. From surplus countries there has been an ever rising demand for US securities, and the money flooding into the US has bid up government bond prices, lowered interest rates and led to rising house prices. Even when the Federal Reserve started to raise short–term interest rates in 2004, long–term rates declined.21
The flow of dollar into US financial firms, including mighty investment banks and large universal banks, led to a soaring of profits in the whole sector, as well as an enormous growth of bonuses for top employees and claims for a more financial liberation.22 Kenneth S. Rogoff believes that with 800 billion US dollar of net capital flows pouring into the US in a year, "some slippage of regulatory and lending standards was perhaps inevitable".23 He argues that, "The u.s. conceit that its financial and regulatory system could withstand massive capital inflows on a sustained basis without any problems arguably laid the foundations for the global financial crisis of the late 2000s" (Reinhart and Rogoff 2009: 213). In any event, the US deficits, leading to a pumping up of the financial sector with liquidity, have been an important part of the basis of financial profit seeking. It should also be emphasised that that these mechanisms have increasingly made the US the effective demand locomotive in the world economy in the last 30 years.
NEW MEANS OF FINANCIAL PROFIT SEEKING
Credit derivatives
In order to make "money breed money" (Marx) finance capital has made ever new instrumental and institutional innovations, so–called financial innovations. Credit derivatives are possibly the most important new instruments of financial profit seeking in the last about 20 years. Technically the credit derivatives work in different ways. But they have two things in common: First, they serve to spread risk (and profits) from the original creditor to other actors in the financial system, and second they are in general traded "over the counter" (OTC), directly between financial actors and not via an official securities exchange.24 One could say that credit derivatives are securities with a price and yield which depends on the price of the "underlying asset", i.e. the current market value and return on the original credit, which is determined by the current value of the collateral and the ability of the original borrower to serve the loan. The rapid growth of these instruments started at the end of the 1990s. The total global notional amount of OTC derivatives outstanding rose from less than 100 000 billion US dollar by the end of 1998, to 683 800 billion in June 2008.25 Much of this increase was owing to the growth of credit derivatives, among them credit default swaps (CDSs).
According to the Bank for International Settlements (BIS), the worldwide estimated notional amount outstanding of CDSs rose from almost zero in the year 2000 to 58 200 billion US dollars by the end of 2007, and then fell to 32 700 billion by the end of 2009.26 When a financial institution (mostly a bank) "buys" a CDS contract, it purchases protection against a "credit event" of the original borrower ("the reference entity"). The credit event may be a default or other events in the original debt relationship. For this protection, with a stated expiry date, the protection buyer has to pay a fee, called "spread", to the seller (an investment bank or an insurance corporation), usually on a quarterly basis. Adverse developments with the original borrower will cause the "spread" on the CDS to rise. If the "reference entity" defaults, the CDS buyer delivers the defaulted assets to the protection seller at their face value.
The CDS has some similarity with debt insurance. However, the original borrower is not party to the contract, and CDSs can be freely traded like bonds. Moreover, unlike insurance, sellers of CDSs have not been required to maintain capital reserves to guaranty payment of claims. Also, investors can issue, sell and buy CDSs without owning any debt of the original borrower. Such "naked CDSs" allow traders to speculate on debt issues and the creditworthiness of borrowers. The CDS market and even more the "naked cds" market cause instability which can trigger severe problems in the real debt market, e.g. the market of government bonds.27
When a bank has insured a loan by buying a CDS contract, the accounts receivable on the assets side of its balance sheet attain the character of safe assets which do not need equity bolstering on the liabilities side of the balance sheet. The bank can therefore continue issuing new loans, financing these loans e.g. by borrowing in the interbank market, without being concerned about the credit worthiness of the borrowers. More surprisingly, also institutions selling CDS contracts apparently do not always care about the credit worthiness of the borrowers, possibly because the CDSs are mostly spread on a large number of original borrowers. Before the financial crisis, The American International Group (AIG) presented itself as "the biggest insurance company in the world", with a total market value of equity of almost 1 000 billion US dollar and subsidiaries in more than 130 countries. Within eight years up to 2008, AIG sold CDS contracts on debts and derivates probably amounting to more than 400 billion dollar. The enormous losses on CDSs in 2008–2009 had as a result that AIG in reality went bankrupt.28
The hunting for high and quick profits, low interest rates, rising house prices and an increasing use of CDSs contributed to an unrestrained growth in the total volume of credit in the US and several other countries from the mid–1990s until 2007. In this process, collateralised debt obligations (CDOS) played the same role as CDSs. A CDO represents a "package" of bonds, loans or asset–backed securities (abss) with different ratings (from AAA to C). As a rule, the bank sells its collateralised loans to a financial company (which may be its own "shadow bank" or an investment bank) specialised in "packaging" CDOS.29 The higher the share of risky loans in the CDO, the higher is, of course, the yield. CDOS often contain special conditions, for example that the buyer loses the whole investment if a certain percentage of the borrowers in the packet default. The CDOS are then sold worldwide. Important buyers of CDOS have been pension funds (ca. 25% of total sales value in 2006), all types of banks (ca. 25% in 2006), and hedge funds (ca. 50% in 2006). According to the Securities Industry and Financial Markets Association (SIFMA), the global issuance of CDOS rose from 68 billion US dollar in 2000, to a peak of 520.6 billion in 2006, and then declined sharply to 4.3 billion in 2009.30
The banks have to a large extent sold CDOS to their customers who have financed their purchases by borrowing money in the very same bank. In this way, the banks have earned double: a fee on the sale of CDOS and interest on loan to the purchaser.31 Attracted by the difference between the yield on CDOS and the interest rate on loans, also hedge funds have financed their purchases of CDOS through high "leverage", by borrowing up to 15 times their equity.32
When collateralised loans are converted to CDOS, the original creditor bank does not need to have coverage for these loans in equity and deposits on the liability side of its balance sheet. The bank earns a fee on selling the loan, and the loan disappears from its balance sheet. Therefore, as in the case of CDSs, there is no limit to how much credit the bank can create.33
The expansion of credit implies, at least temporarily, strongly increased profits in the financial system. But the final buyers of the CDOS may not know the composition of this complex security. The complexity becomes impenetrable when so–called "CDOS squared" are derived from CDOS, as has often been the case. The original creditor has spread the risk and for that reason has an incentive to earn more money by spreading more risk. No bank knows which other banks are holding what type of CDOS. The "instrument" which eliminates the risk of the original creditor bank, and makes that bank continue creating credit, results in an enormously increased risk for the financial system as whole. This explains why the interbank market, the aorta of the international financial system, ended so rapidly in almost total infarct when the financial crisis exploded in August 2008. The finance acrobat Warren Buffet had good reason to characterise CDOS and other credit derivatives as "financial weapons of mass destruction".34
HEDGE FUNDS
Hedge funds are financial investment companies open to a limited number of participants.35 Each investor contributes, as a rule, at least one million US dollar and often several hundred million dollars. The growth of hedge funds started after 1990. In that year, the assets under management by hedge funds worldwide was an estimated 39 billion US dollar, rising to almost 1 000 billion in 2004, and a historical peak of 1 868 billion in 2007. In 2008 there was an abrupt fall to about 1 400 billion, and then another increase to an estimated 1 668 billion by the end of March 2010. The number of hedge funds worldwide has varied more or less in step with the assets under management, rising from 610 in 1990 to more than 10 000 in 2007. In March 2010, 59% of all funds had address in Cayman Islands, obviously to avoid taxation. However, the fund managers have their offices in places such as New York, London, Zurich, Hong Kong and Singapore.36 The fund managers' annual fee has as a rule been 2% of partners' investment and 20% of annual profits. In 2005, the 25 American fund managers with the highest fees had an average income of 250 million dollar (Stulz 2007: 7).
Hedge funds invest in all types of liquid assets which can have relatively rapid and often large price changes, such as shares, bonds, currencies, credit derivatives, all types of raw materials from metals to petroleum and food grains. The binding time of the investors' money varies from some months to two years. The standard method of the funds' "hedging" is that they do not only invest in objects which they expect will rise in price, so–called "long positions", but also in objects which they guess will decline in price, so–called "shorting" or "short sales". By paying a fee to the owners, a hedge fund can for example borrow shares which they guess will decline in price. The shares are sold immediately. When the price of the shares has eventually fallen, the fund will buy them back, cashing the price difference between the sale and the buying back, and return them to the owner.
A famous case of shorting is George Soros's speculation against the British pound in 1992. His Quantum Fund borrowed an amount of British pound corresponding to 15 billion US dollar. Through shorting they brought the pound to fall and leave the Exchange Rate Mechanism of the European Monetary System. From this operation Quantum Fund cashed nearly 2 billion dollar. More recent examples are Pershing Square Capital's shorting of the shares in Fannie Mae and Freddie Mac, which accelerated their fall to bankruptcy. Also Greenlight Capital's shorting of the shares in Lehman Brothers throughout many months, contributed strongly to the steep fall of its share price, by 100% from July 2007 until its fall on 11 September 2008.37
The use of CDSs has greatly facilitated shorting of bonds. A hedge fund may for example borrow bonds, buy a CDS contract on the bonds and sell them immediately. This operation may lead to rising "spread" on the CDS and exert a strong downward pressure on the price and upward pressure on the interest rate on bonds. As George Soros notes: "Going short bonds by buying a CDS contract carries limited risk but unlimited profit potential, selling CDSs offers limited profits but practically unlimited risks. The asymmetry encourages speculating on the short side, which in turn exerts a downward pressure on the underlying bonds. [...] The unlimited shorting of bonds was facilitated by the CDS market" (Soros 2009: 166–167). Most probably shorting of government bonds contributed strongly to the acute Greek sovereign debt crisis in the spring of 2010.38
Big and quick money is the driving motive of the hedge funds. In their advertisements to potential partners they boast of adventurous annual returns of about 30% on the invested capital. But the average return has not been that impressive. For the period 1994–2005 the average yield on equity of all hedge funds in the world was estimated at 11% per year (European Central Bank, ECB, 2006, Statistical Annex: 26; Stulz 2007: 15).
Beginning with the scandal of the Long–Term Capital Management (LTCM) in 1998, a large number of hedge funds in the US have been wound up or closed down. It has been estimated that until 2006, about 10% of all hedge funds in the US "died" each year (Stulz 2007: 32). Only in 2006, 83 hedge funds in the US were wound up, many of them causing large losses for creditor banks.39 The illusion that hedge funds could make "absolute returns" regardless of the ups and downs of markets was shattered in 2008, when the funds' reported average return on equity was minus 19% according to data from Hedge Fund Research. The crisis wiped out about 25% of the hedge funds' assets and forced many of them out of business.40
The many failures of hedge funds well before the financial crisis of 20082009 did not discourage the banks from showering big loans upon them.41 In some cases, loans have financed up to 90% of the funds' investments, as was the case with LTCM. In early 1998, the fund held securities for about 129 billion dollar, had a debt of 124.5 billion dollar and equity of 4.72 billion dollar, in other words a leverage of 96.5%. Later that year, the fund lost 4.6 billion dollar within four months. Several large banks were heavily exposed to LTCM, and the authorities feared that the whole security market could collapse if the fund started panic sales of securities. For this reason, the Federal Reserve organised a comprehensive rescue, distributing the cost on 14 banks and brokers. Early in the year 2000, LTCM was liquidated.42
Through high leverage, hedge funds can cause irreparable losses for the biggest banks, and especially when hedge funds unite to practice shorting of shares, so–called crowding, they can bring any corporation and even large currencies to fall (cf. ECB 2006: 134–135). This is probably the reason why the German government has temporarily prohibited all short selling of bank shares, and why many governments require the hedge funds to operate more openly. The US financial reform bill, passed in July 2010, requires hedge funds with assets of over 150 million US dollar to register with the Securities and Exchange Commission (SEC), to hire or designate a compliance officer and to maintain records on trading positions and leverage.43 It remains to be seen whether these measures are sufficient to eliminate the destructive aspects of these funds.
Private equity funds
Private equity funds are "limited partnership" funds which are as a rule managed by specialised companies.44 The management fee of the manager (the "general partner") is about 2% per year of total committed capital. In addition the general partner receives a "carried interest" of 20% or more of the net profits on the total investment. Two types of funds are often categorised as private equity funds, viz. buyout funds and venture capital funds. Here, I will discuss only the buyout funds, which are by far the most important in terms of capital under management. In 2007 it was estimated that private equity funds worldwide managed a total partner capital of approximately 1000 billion dollar. Probably, at least 70% of this capital was managed by buyout funds (Metrick and Yasuda 2007: 2).
Private equity funds speculate in objects of low liquidity, mainly through buyouts of firms registered on the stock exchange. They have bought out companies ('portfolio companies') within virtually all branches, such as industrial companies, media and telephone corporations, food chains, hotel chains, health corporations, and pharmaceutical industries (ECB 2007: 13). Their standard method is to buy out companies with a high equity share which they think are undervalued on the stock exchange. The companies are immediately withdrawn from the stock exchange and their equity is charged to repay loans which were used to finance the buyout. This method is called "recapitalisation", which is actually recapitalisation of the investors and decapitalisation of the bought–out company (cf. ECB 2007: 17; BIS 2007: 129). Since the investments of private equity funds are long–term, the partners' committed capital which the general partner can draw on has a fixed term of typically 10 years. The profits on the investment are paid out to the partners at the end of the fixed term, when the investment has been realized (ECB 2006: 137).
Also the private equity funds have had their golden age after the mid–1990s, and especially after 2001. Globally, committed capital in the funds rose from 47 billion US dollar in 1990 to about 500 billion distributed on ca. 2 700 funds in January 2007.45 In 2001, private equity funds worldwide made buyouts of less than 50 billion US dollar, corresponding to ca. 5% of all acquisition and merger transactions. In 2006, total buyouts amounted to about 640 billion US dollar, which accounted for approximately 30% of total acquisition and merger transactions (bis 2007: 129, ECB 2007: 6).
An estimate from 2003, shows that about 30% of the committed capital came from pension funds, ca. 40% from banks and insurance companies, 20% from foundations, and less than 10% from individuals and families (SEC 2003: 7). In particular investment banks have often been involved both as advisors, partners and creditors (ECB 2007: 5, 26–28).46
Like hedge funds, the private equity funds have been reported to make adventurous profits. According to one estimate, by the London–based research company Preqin Ltd., funds with more than 2 billion dollar each in committed capital that were completed in 2001 and 2002, generated median rates of return of 34% and 33%, respectively.47 However, the average has been much lower. For the peak year 2006, the average return of European private equity funds was estimated at 14% (ECB 2007: 13).
In the 1990s, small and medium–sized companies were the favourite preys of private equity funds. But gradually they have moved to giant buyouts, often through "crowding" of several funds.48 After a buyout, unprofitable parts of the company are as a rule sold immediately or closed down. The remains of the company will be restructured, slimmed and split up before they are sold again and the profits are reaped. A regular feature of this method is dismissal of workers and draining of the company's equity capital. Uwe H. Schneider, professor of economics of law at the Technical University of Darmstadt, has studied private equity funds for many years. In an interview in 2006 he stated that,
Many of these alleged investors are in reality equity robbers. [...] At least 5 000 German companies employing 800 000 workers are owned by these so–called new investors. Too many among them do not have any long–term interest in research and innovation, in future products and creation of new jobs. [...] We are destroying our future.49
Like the hedge funds, the private equity funds have financed a large and increasing share of their buyouts by borrowing from banks or other credit companies. Worldwide, the total borrowing of the funds increased by a factor of 15 between 2001 and 2006, from an estimated 28 billion US dollar to about 420 billion dollar. In 2006, borrowing financed 66% of the total worldwide buyouts of about 640 billion dollar. In that year, 77% of buyouts by European funds were financed by borrowing (ECB 2007: 13). Up to 80% leverage has been quite frequent.50
In the last years before the financial crisis, several observers expressed surprise over the banks' rapidly increasing "risk appetite". Loans of relatively high risk and with correspondingly higher interest rate increased from 55% of total lending to private equity funds in 2001, to 90% in 2006 (ECB 2007: 14; BIS 2007: 129). One reason for this development was that the banks increasingly securitised their loans, through CDSs or CDOS, and in that way removed the impression of increasing risk from their balance sheets.51
The profitability of private equity funds depends on a combination of several critical factors. They need access to cheap credit, the companies they buy out must have a high share of equity capital and low debt, and there must be a reasonably stable general upturn on the stock exchange. During the crisis 2008–2009 this combination vanished. According to data compiled by Bloomberg News, "Managers saddled with $1.6 trillion in buyouts made during the three–year boom (2005–2007) have marked at least 6 of the era's 10 biggest deals at or below cost."52 Pension funds, endowments and mutual funds have cut their commitments to buyout funds by more than 50%, and the banks have become far more reticent in providing loans to the funds. In 2009, private equity funds worldwide raised a total capital of 281 billion US dollar, a 57% drop from the record 646 billion collected in 2007.53
Leverage within the financial sector
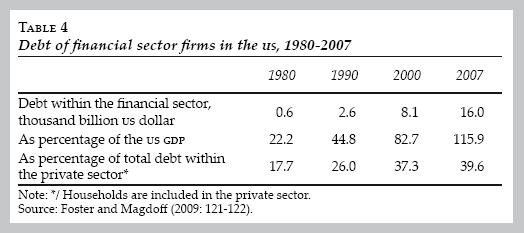
We have seen that buyers of credit derivatives as well as hedge funds and private equity funds have increasingly borrowed money to finance their positions. This explains why the total debt within the financial sector increased so strongly prior to the economic crisis. From 1990 to 2007, the debt of the US financial sector increased by an average of 11.3% per year, from 2 600 billion US dollar to 16 000 billion US dollar. As a share of the total debt within the private sector, the debt of the financial sector increased from 26% in 1990 to 39.6% in 2007. Between 1990 and 2007, the financial sector accounted for 44% of the total debt increase in the private sector (cf. table 4).
Extremely high leverages seem to be characteristic of financial investments. That may partly be explained by the institutional proximity between investors and creditors; both parties belong to the financial sector, and in many cases they even belong to the same company. They "understand each other". Partly it may be explained by particularities of the financial sector. We have seen that financial investments quite often yield quicker returns than real investments. Fixed real investments are long–term and may bind up capital for specific purposes over long periods of time. With a long time horizon both investors and creditors may be more careful in using high leverage. On the other hand, fixed investments which are necessary for financial activity (e.g. buildings and computers) are relatively small compared to total investments and can easily be converted to other purposes, while the financially invested capital generally has a very short turnover time. These general aspects add to the forces we have discussed in the foregoing sections. Under these conditions high leverage is a convenient method to attain and maintain extraordinarily high returns on equity capital.54
But why do the banks risk their capital by lending for financial investments with high leverage? We have seen that banks can evade lender's risk (cf. Minsky 1986: 192–193) by securitising their loans by means of CDSs or CDOS. Another aspect relates to the banks' costs of management of loans. Loans to households or companies in the real economy are mostly long–term, often more than 20 years, financing fixed investments in objects with a long life time. But a considerable part of the banks' financing of such lending is often short–term, through borrowing in the interbank market. This necessitates that the creditor bank must refinance its loans quite frequently. On the other hand, loans to firms in the financial sector are more frequently short–term, and will save the bank for the efforts of periodic refinancing. A third aspect is that many banks themselves have a very high leverage, created through borrowing in the interbank market. When extremely risky loans succeed, the banks' shareholders will pocket a high profit; when they fail, the costs to shareholders will be limited to the amount of equity.
A fourth aspect relates to how the creditor banks' aggregate willingness to lend affects the prices of the borrowers' collaterals. This is a major point in George Soros's 'theory of reflexivity': Asset prices rise because banks are willing to give loans, while the banks believe that the rise in asset prices is independent of their willingness to provide loans. Soros calls this belief a "misconception":
Every bubble consists of a trend that can be observed in the real world and a misconception relating to that trend. The two elements interact with each other in a reflexive manner. [...] In cases of debt leveraging the misconception consists of a failure to recognize a reflexive two–way connection between the creditworthiness of the borrowers and the willingness of the creditors to lend: usually there is a collateral involved, and the most common form of collateral is real estate. Bubbles arise when the banks treat the value of the real estate as if it were independent of the banks' willingness to lend against it. [...] [In the United States housing bubble] there was a prevailing trend –ever more aggressive relaxation of lending standards and expansion of loan–to–value ratios— and it was supported by a prevailing misconception that the value of the collateral was not affected by the willingness to lend. That is the most common misconception that has fueled bubbles in the past, particularly in the real estate area (Soros 2009: x, 65–66, 85; italics in original).55
The essence of Soros's theory of reflexivity is that not only is the price of assets influenced by demand and supply, but demand– and supply curves (if we can speak of such curves) are strongly influenced by price changes. Indeed, Soros's theory not only represents a critique of the efficient market hypothesis and the theory of rational choice; it invalidates essential aspects of neoclassical economics in general.
OVERACCUMULATION OF FINANCE CAPITAL
It is self–evident that 30%, or even 5%, real return on financial assets in economies which grow at 2.5% or less per year is impossible in the long run.56 For such returns to be realised even in the shorter term, there has to be a redistribution of incomes from wages to profits combined with a redistribution of profits from the productive sectors of the economy to the financial sector. We have seen that the former type of redistribution took place in the US to a considerable extent. As table 5 shows, there was also a formidable redistribution of profits from the productive sectors to the financial sector. The financial sector's share of total corporate profits was doubled from an average of 18.3% in 1980–1990, to 36.2% in 2001–2006, reaching a peak of 40.8% in 2001–2002. Moreover, the financial sector's share of total GDP rose from 4.8% in 1980–1982, to 8.1% in 2007. In the same period, manufacturing industry's share of total GDP declined by almost eight percentage points, from 19.4% to 11.7% (table 5). The expansion of the financial sector took place along with a virtual deindustrialisation in the US.
The decline of the financial sector's share of total corporate profits, from 40.8% in 2001–2002 to 33.1% in 2007 signifies that this redistribution process had reached an upper limit. But apparently, the accumulation of finance capital continued unabated up to 2007. We have seen that the volume of finance capital is not recorded in national accounts. However, there are clear indications of its growth and size. One indication is that the amount outstanding of OTC derivatives rose from 127 560 billion US dollar in June 2002 to a historical peak of 683 800 billion (47 times the US GDP) in June 2008, corresponding to an increase of 32% per year (cf. BIS 2003: A99; BIS 2010: A121). Another indication is that the global financial wealth of high net worth individuals (HNWI) increased from 30 700 billion US dollar in 2004 to a historical peak of 40 700 billion dollar in 2007 (Capgemini/Merrill Lynch 2010).57
Of course, there is no reason to believe that all cdt derivatives are profit yielding or interest bearing. On the other hand, financial wealth is possessed not only by HNWI. Large financial assets are held by less wealthy persons, as well as by institutions such as banks, insurance companies, pension funds and hedge funds. Against this background, a third indication seems to be reasonably accurate: One study reports that the global amount of profit–seeking financial assets increased three times more than the worldwide GDP, from 12 000 billion US dollar in 1980 to 196 000 billion in 2007, which was four times larger than the total world GDP in that year (Schnibben 2009: 99). To get an impression of the magnitude: An average return of 7% on 196,000 billion US dollar corresponds exactly to the total GDP of the US in 2007.
The volume of corporate profits in the US financial sector rose from 325.9 billion dollar in 2003, to 427.6 billion in 2006, then declined to 323.8 billion in 2007, and collapsed to 128 billion dollar in 2008.58 While profits stagnated or fell, finance capital continued growing, leading to a fall of the profit rate in that sector. In other words, the accumulation of finance capital exceeded its profit possibilities, which means overaccumulation of finance capital. Moreover the data signifies that when the volume of finance capital is included in the denominator of the profit rate, also the rate of profit in the US corporate sector as a whole declined at least since 2004. Thus, the increasing mass of finance capital became an unbearable burden to the economy as a whole.
Therefore the economic crisis had to come, with falling asset prices, a credit crunch, falling real investments, falling effective demand and rising unemployment. But could the present crisis have been averted by a "better" regulation of the financial sector? There is reason for some doubt. First, history teaches US that economic regulations in capitalism are virtually always behind the "innovations" of finance capital. Second, the analysis in the foregoing sections indicates that the accumulation model of the liberalised US economy had to lead to the crisis. In particular, the low wage policy leading to a rapidly increasing income inequality both necessitated and created new mechanisms for maintaining effective demand, as well as the accumulation of finance capital. What is at stake is not only regulations, but the entire accumulation model of financialised capitalism. This model contains strongly self–destructive features.
The mainstream argument in favour of free financial markets is that devices such as credit derivatives, hedge funds and private equity funds serve to "correct" asset prices and create market equilibrium. By contrast, with these devices capitalism has not only become gravely unstable, but has developed strongly cannibalistic features. The most visible achievement of the new financial innovations so far is enriching financial speculators, squeezing the productive sectors of the economy through a drastic redistribution of total profits from the real economy to the financial sector and through redistribution of incomes from wages to profits. The financial sector has grown to a gigantic parasitic machinery, which through the luxury consumption of its actors and recurring crises squander enormous economic and human resources in its hunting for a biggest possible share of total profits.
The rescue actions of the governments have prevented a total economic collapse. However, they also prevented large amounts of financial assets from being sufficiently depreciated. The present dilemma is that the situation of overaccumulation of finance capital still prevails, while political and economic forces prevent continued deficit government spending which could increase effective demand and stimulate employment.
REFERENCES
Aglietta, M. and A. Rebérioux, Corporate Governance Adrift—A Critique of Shareholder Value, Cheltenham, Edward Elgar, 2005. [ Links ]
Baker, D., The Productivity to Paycheck Gap: What the Data Show, New York, Center for Economic and Policy Research, 2007. Available in: <www.cepr.net/> [ Links ].
Bank for International Settlements (BIS), Quarterly Review September, 2003. [ Links ]
––––––––––, 77th Annual Report, Basel, 2007. [ Links ]
––––––––––, Quarterly Review June, 2010. [ Links ]
Bookstaber, R., A Demon of our own Design: Markets, Hedge Funds and the Perils of Financial Innovation, Hoboken, N.J., John Wiley & Sons, 2007. [ Links ]
Brenner, R., The Boom and the Bubble: the US in the World Economy, London, Verso, 2002. [ Links ]
Capgemini/Merrill Lynch, World Wealth Report2010. Available in: <www.capgemini.com/> [ Links ].
Cesaratto, S., "Transition to fully funded pension schemes: a non–orthodox criticism", Cambridge Journal of Economics, vol. 30, no. 1, 2006, pp. 33–48. [ Links ]
Crawford, A., "Germany to temporarily ban naked short selling", Bloomberg News, 18/05/2010. Available in: <www.bloomberg.com/apps/> [ Links ]
Culp, Ch.L. and J.P. Forrester, "The shape of CDOS to come", Cayman Financial Review, no. 18, 1st Quarter 2010, pp. 40–42. Available in: <www.caymanfinancialreview.com> [ Links ].
Duménil, Gérard and Dominique Lévy (2002), "The profit rate: where and how did it fall? Did it recover? (USA 1948—2000)", Review of RadicalPoliticalEconomics, vol. 24, pp. 437–461. [ Links ]
European Central Bank (ECB), Financial Stability Review, Frankfurt am Main, 2006. [ Links ]
––––––––––, Large Banks and Private Equity—Sponsored Leveraged Buyouts in the EU, Frankfurt am Main, 2007. [ Links ]
Evans, D., "FDIC may need $150 billion bailout as more banks fail", Bloomberg News, 25/09/2008. Available in: <www.bloomberg.com/apps/news> [ Links ].
Federal Reserve, Flow of Funds Accounts of the United States, 2nd Quarter 2010. Available in: <www.federalreserve.gov/releases/Z1/> [ Links ].
Feldstein, M., "Housing, credit markets and the business cycle", National Bureau of Economic Research (NBER), Working Paper no. 13471, 2007. Available in: <www.nber.org/papers/> [ Links ].
Foster, J.B. and F. Magdoff, The Great Financial Crisis, New York, Monthly Review Press, 2009. [ Links ]
Greenspan, A. and J. Kennedy, "Sources and uses of equity extracted from homes", Federal Reserve Staff, Working Paper no. 2007–20. Available in: <www.federalreserve.gov/PUBS/feds/2007> [ Links ].
Hilferding, R., Das Finanzkapital—Eine Studie über die jüngste Entwicklung des Kapitalismus, (East–)Berlin, Verlag J.WH. Dietz Nachf., [1910] 1947. [ Links ]
International Monetary Fund (IMF), World Economic Outlook—Spillovers and Cycles in the Global Economy, IMF, Washington D.C., 2007. [ Links ]
Kelly, J. and C. Alecsi, "Private equity funds loose commitments from pensions", Bloomberg News, 25/08/2010. Available in: <www.bloomberg.com/news/print/2010–08–25/private–equity–losing–commitment/> [ Links ].
Kopecki, D. and C. Dodge, "U.S. rescue may reach $23.3 trillion, Barofsky says", Bloomberg News, 20/07/2009. Available in: <www.bloomberg.com/apps/news/> [ Links ].
Lowenstein, R., When Genius Failed—The Rise and Fall of Long–Term Capital Management, New York, Random House, 2000. [ Links ]
Marx, K., Theorien über den Mehrwert. Dritter Teil, Frankfurt am Main, Europäische Verlagsanstalt, [1861–1863] 1968. [ Links ]
––––––––––, Capital, Volume Two, Harmondsworth, Penguin Books, [1884] 1978. [ Links ]
––––––––––, Capital, Volume Three, Harmondsworth, Penguin Books, [1894] 1981. [ Links ]
Metrick, A. and A. Yasuda, The Economics of Private Equity Funds, U.S. Department of Finance, The Wharton School, University of Pennsylvania, 2007. Available in: <www.chicagobooth.edu/research/workshops/finance/> [ Links ].
Minsky, H., Stabilizing an Unstable Economy, New Haven–London, Yale University Press, 1986. [ Links ]
Mohun, S., "Distributive shares in the US economy", Cambridge Journal of Economics, vol. 30, 2006, pp. 347–370. [ Links ]
Moses, A. and P. Dobson, "Credit swaps at record high as Greek crisis infects Europe". Available in: <www.bloomberg.com/news/2010–04–27/> [ Links ].
Organisation for Economic Co–operation and Development (OECD), Economic Outlook, no. 81, 2007. [ Links ]
––––––––––, Economic Outlook, no. 87, 2010. [ Links ]
Pittman, M. and B. Ivry, "Financial rescue nears GDP as pledges top 12.8 trillion", Bloomberg News, 31/03/2009. Available in: <www.bloomberg.com/apps/> [ Links ].
Rappaport, A., Creating Shareholder Value. The New Standard for Business Performance, New York, The Free Press, 1986. [ Links ]
Reinhart, C.M. and K.S. Rogoff, This Time is Different. Eight Centuries of Financial Folly, Princeton and Oxford, Princeton University Press, 2009. [ Links ]
Schnibben, C., "Lob der Gier", Der Spiegel, no. 20, 11/05/2009, pp. 96–109. [ Links ]
Schulz, B. and G. Braunberger, "Die bösen Buben der Kapitalmärkte", Frankfurter Allgemeine Zeitung, 24/09/2010, p. 23. [ Links ]
Securities and Exchange Commission (SEC), Implications of the Growth of Hedge Funds, Washington D.C., SEC, 2003. [ Links ]
Shaikh, A., "The first great depression of the 21st century", forthcoming in Socialist Register 2011, 2010a, pp. 44–63. [ Links ]
––––––––––, "Reflexivity, Path–Dependence and Disequilibrium Dynamics", typescript forthcoming in Journal of Post Keynesian Economics, 2010b. [ Links ]
Shirvani, E., "Naked–swap ban is misinformed assault on markets", Bloomberg News, 25/05/2010. Available in: <www.bloomberg.com/news/> [ Links ].
Soros, G., The Crash of 2008 and What it Means. The New Paradigmfor Financial Markets, New York, PublicAffairs, 2009. [ Links ]
Stulz, R.M., Hedge Funds: Past, Present and Future, WP 2007: 3, United States, Fisher College of Business, The Ohio State University, 2007. Available in: <www.ssrn.com/abstract=939629> [ Links ].
van Duyn, A., "Derivative dilemmas", Financial Times, 12/08/2010. [ Links ]
Wolff, E.L., "What's behind the rise in profitability in the US in the 1980s and 1990s?", Cambridge Journal of Economics, vol. 27, 2003, pp. 479–499. [ Links ]
Zacharias, A.; E.N. Wolff and T. Masterson, Levy Institute Measure of Economic Well–Being. New Estimates of Economic Inequality in America, 1959–2004, Annandale–on–Hudson, New York, The Levy Economics Institute, 2009. [ Links ]
NEWSPAPER ARCHIVE
Associated Press, "How severe is the subprime mess?", 13/03/2007. Available in: <www.msn_bc.com> [ Links ].
Bloomberg News, 19/06/2010. [ Links ]
Der Spiegel, no. 38, 2006. [ Links ]
––––––––––, no. 16, 2007.
––––––––––, no. 33, 2007.
––––––––––, no. 36, 2007.
––––––––––, 22/09/2008.
––––––––––, "Im Hauptquartier der Gier", no. 29, 2009.
The Economist, several years. [ Links ]
––––––––––, "Bigger, safer but duller", 28/08/2010.
––––––––––, Special Report on International Banking, 19/05/2007.
The Te/egraph, "Fears of dollar collapse as the saudis take fright", 20/09/2007. [ Links ]
Wall Street Journal, 11/10/2008. [ Links ]
WEB SITES
Bloomberg News: <www.bloomberg.com/apps/> [ Links ].
Board of Governors of the Federal Reserve System: <www.federalreserve.gov/releases/z1/> [ Links ].
Bureau of Economic Analysis: <www.bea.gov/> [ Links ].
InflationData.com: <http://inflationdata.com/inflation/images/> [ Links ].
International Swaps and Derivatives Association, Inc.: <www.isda.org/statistics/> [ Links ].
Securities Industry and Financial Markets Association: <www.sifma.org/research/global–cdo.html> [ Links ].
U.S. Census Bureau, Foreign Trade Statistics: <www.census.gov/foreign–trade/> [ Links ].
U.S. Government Printing Office: <www.gpoaccess.gov/usbudget/> [ Links ].
* A preliminary draft of this paper was prepared during a research stay at The Vienna Institute for International Economic Studies in September 2010. My special thanks to Dr. Josef Pöschl for his generous hospitality and kind helpfulness. The paper was presented as a lecture at División de Estudios de Posgrado, Facultad de Economía, at Universidad Nacional Autónoma de México (UNAM), México City in November 2010. I wish to thank all participants, in particular Alejandro Valle and Julio López, for their helpful comments. Also my thanks to Ignacio Perrotini, editor of Investigación Económica, and to two anonymous referees of this journal for giving me many valuable suggestions. Last, but not least, thanks to Amit Bhaduri for encouraging me to make arguments clearer.
** JEL: Journal of Economic Literature-Econlit.
1 For example, Anwar Shaikh: "[The general economic crisis] was triggered by a financial crisis in the US, but that was not its cause. [...] The mortgage crisis in the US was only the immediate trigger' (Shaikh 2010a: 44, 45).
2 An outstanding exception in this regard is Foster and Magdoff (2009).
3 I am fully aware that this is not in accordance with Marx's view. He wrote that, "Overproduction of capital and not of individual commodities —though this overproduction of capital always involves overproduction of commodities— is nothing more than overaccumulation of capital. [...] Overproduction of capital never means anything other than overproduction of means of production" (Marx [1894] 1981: 359, 364). In this respect, Hilferding's Das Finanzkapital did not deviate from Marx's view. Cf. Hilferding [1910] 1947: 353–355).
4 The last sentence was added by Engels in the second edition.
5 Hyman Minsky is an exception. He dealt with this aspect in his analysis of 'money–manager capitalism': "Banks and bankers are not passive managers of money to lend or to invest; they are in business to maximize profits" (Minsky 1986: 229).
6 Cf. InflationData.com: <http://inflationdata.com/inflation/images/>.
7 Wall Street Journal (11/10/2008: 1).
8 Cf. Evans (2008); and Associated Press (13/03/2007).
9 Pittman and Ivry (2009).
10 Cf Kopecki and Dodge (2009).
11 "Between 1996 and 2006 (the year when prices peaked) the cumulative real price increase was about 92 percent —more than three times the 27 percent cumulative increase from 1890 to 1996!" (Reinhart and Rogoff 2009: 207. Italics in the original). Cf. also Feldstein (2007: 1).
12 Stagnating real wages coincided with rising income inequality. The Gini ratio for monetary income rose from 0.39 in 1970, to 0.41 in 1982, and 0.47 in 2005 (Zacharias et al. 2009: 4). No other Western developed economy had so high a Gini ratio as the US in 2005.
13 Cf. The Economist (19/01/2008: 64).
14 Cf. Federal Reserve, tables L.118 and L.119, in: <www.federalreserve.gov/releases/Z1/>.
15 Cf. U.S. Census Bureau: <www.census.gov/foreign–trade/>; and OECD (2007: 285–289). In addition to the trade deficit, the current account deficit includes cross–border interest and dividend payments, as well as transfers including e.g. military expenditure abroad and foreign aid.
16 Here the term 'developing countries' comprises all the 143 countries which are not classified as advanced. Roughly speaking these are all countries in the world minus the OECD member countries. In 2006, the 56 developing countries with net foreign debt, i.e. the same situation as the US, had a total gross debt of 2 311.5 billion US dollar, equivalent to 33% of the net foreign debt of the US (IMF 2007: 272).
17 Accumulated over the period 2002–2006, these deficits were as follows: PD = 719; GD = 2 297; TD = 3 016, all in billion US dollar.
18 Cf. U.S. Government Printing Office: <www.gpoaccess.gov/usbudget/>.
19 Trade statistics available from u.s. Census Bureau, Foreign Trade Statistics, in: <www.census.gov/foreign–trade/>.
20 Cf. The Telegraph (20/09/2007); Bloomberg News (19/06/2010).
21 The chairman of the Fed, Alan Greenspan, said to the Congress in February 2005 that this was a "conundrum". Cf. The Economist (24/01/2009: 70).
22 "The top employees of the five largest investment banks divided a bonus pool of over $36 billion in 2007" (Reinhart and Rogoff 2009: 210).
23 Cf. The Economist (24/01/2009: 71).
24 In June 2008, the OTC traded derivatives amounted to 683 800 billion US dollars, while exchange–traded derivatives amounted to slightly more than 60 000 billion dollar, or less than 10% of the OTC traded. Cf. The Economist (14/11/2009: 89). Cf. also BIS (2010: A121).
25 van Duyn (2010: 5); BIS (2010: A121).
26 bis (2010: A121). The International Swaps and Derivatives Association (ISDA) reports a slightly lower figure for 2009, viz. 30 400 billion US dollar. Cf. International Swaps and Derivatives Association, Inc.: <www.isda.org/statistics/>. To give a picture of the dimensions: 58 200 billion was more than four times the GDP of the US in 2007.
27 That was the reason why the German government, impressed by the Greek crisis, temporarily prohibited transactions of "naked cds" in May 2010. At that time, there was an estimated 102 billion US dollars in net notional outstanding of CDSs on euro–area government debt, without doubt concentrated on the Greek debt. How much of this was "naked cds" is probably not known. Cf. Crawford (2010); and Shirvani (2010). With respect to speculation with CDS contracts see also the section on hedge funds below.
28 Cf. Der Spiegel (no. 29, 2009: 42–59); and The Economist (14/11/2009: 89). However, AIG was "too big to fail". It was subjected to a "managed bankruptcy" by the American government which injected 182 billion dollars and took over 80% of the shares. The director general of AIG, Robert Willumstad, who had held the position for only three months, was fired. But he left with a "golden handshake" of 7 billion US dollar.
29 The collaterals may be houses, real estate in general, shares, credit derivates and other assets.
30 See: Securities Industry and Financial Markets Association: <www.sifma.org/research/global–cdo.html>. Cf. also Culp and Forrester (2010). I have not succeeded in finding any estimate of the global amount of outstanding CDOS.
31 It has been estimated that in the ten years up to 2009, commercial banks in the US pocketed 115 billion US dollars from cash and derivatives trading (The Economist 14/11/2010: 91). The Economist quotes Kevin Mc–Partland, representative of the research firm tabb Group: "Banks lump their trading revenue together but the significant majority of it comes from derivatives" ibid.).
32 Cf. The Economist (21/04/2007: 74).
33 Thus, these credit derivatives are efficient means of endogenous money and credit creation tied up with the process of financial capital accumulation (cf. Minsky 1986: 223–253).
34 Cf. eg. The Economist (21/04/2007: 73).
35 According to US law on financial investment companies, each hedge fund could have at most 100 partners if it would avoid being registered by the US Securities and Exchange Commission (SEC) and being exempted from SECs controls. The lack of control and transparency gives way to fraud. From June 1999 to August 2006, SEC preferred indictments in 97 cases against advisors for having defrauded investors or having used investment funds to defraud others. According to sec, frauds in the period 2000–2003 amounted to 1.1 billion US dollar. The Economist (02/09/2006: 62); SEC (2003); Stulz (2007: 23).
36 Cf. The Economist (28/08/2010: 55); Schulz and Braunberger (2010: 23); and Bookstaber (2007: 5).
37 Cf. Der Spiegel (22/09/2008: 78).
38 The yield on the Greek two–year government bond rose abruptly to 18.99% by the end of April 2010, while the yield on 10–year bond rose to 10.05%, which was the highest since Bloomberg began collecting such data in 1998. Cf. Moses and Dobson (2010).
39 Among the most spectacular bankruptcies before the finance crisis in 2008 were Bayou Hedge Fund Group (bankrupt in 2005) and Amaranth Advisors (bankrupt in 2006) which lost 6.5 billion dollar in the hitherto largest hedge fund collapse in history. In August 2007, the US fund United Capital Markets declared itself "illiquid" and stopped all payments to its partners. Der Spiegel (no. 16, 2007: 88). Cf. also Stulz (2007).
40 Cf. The Economist (28/08/2010: 55), and (18/09/2010: 12).
41 In the section below on leverage, we will discuss why the banks continued to provide big credits in spite of these signs.
42 It is worth noting that in 1997, two highly influential members of the board of directors of LTCM, Myron Scholes and Robert C. Merton, shared the Nobel memorial prize in economics precisely for their contributions to finance theory! For a good account of the LTCM scandal, see Lowenstein (2000).
43 Cf. The Economist (28/08/2010: 55–56).
44 The term "limited partnership" refers to the limited liability of each provider of investment capital.
45 The Economist (10/02/2007: 74).
46 For example Merrill Lynch is reported to have earned 75 million dollar as advisory fee for the buyout of the US health corporation hca. In addition, they provided a loan of 22 billion dollar and invested 1.5 billion as partner in the buyout (cf. The Economist 19/05/2007: 15).
47 Cf. Kelly and Alecsi (2010).
48 Among giant buyouts are Hilton Hotels for 26 billion dollar and the British air traffic company BAA (owner of the airports Heathrow, Gatwick and Stansted) for 30 billion dollar. A consortium of private equity funds led by Kohlberg Kravis Roberts & Co. (KKR) bought out the US energy company txu for 43.2 billion dollar. As far as I know, the biggest buyout was the Canadian telecommunications company Bell Canada for 48 billion dollar (cf.The Economist 07/07/2007: 68; 23/09/2006: 69, and 19/05/2007: 15; Der Spiegel no. 36, 2007: 85; Kelly and Alecsi 2010).
49 Interview in Der Spiegel (no. 38, 2006: 100).
50 Cf. Der Spiegel (no. 33, 2007: 71).
51 Cf The Economist (19/05/2007: 15).
52 Kelly and Alecsi (2010).
53 Cf. ibid. and The Economist (04/09/2010: 72).
54 One example to illustrate the point: An investment bank or a hedge fund or a private equity fund (a financial investor) borrows 900 million US dollar at 3% interest to undertake a financial investment of 1000 million US dollar. The investor's guess is that the investment will yield a total return of 50 million US dollar (5%). If the investor's guess comes true, the return on equity will be 23 million US dollar, in other words 23%. The leverage has resulted in a percentage return to equity which is far above the return on total investment. Leverage can also be used to maintain a high return on equity. Assume that the investor has downgraded her/his guess and believes that the total return will be only 40 million US dollar (4%). However the investor wants to maintain the same return on equity. That is done by increasing the borrowing to 950 million US dollar. In this case the return on equity will be 11.5 million US dollar, or 23% as in the first example.
55 Shaikh (2010b) presents a nice formal model of Soros's theory of reflexivity.
56 From the year 2000 to 2007, the GDP of Germany increased by an average of 1.2% per year, in France 1.8%, in Great Britain 2.6%, in the US 2.4%, in the euro area 1.9%, and in the total OECD 2.4% per year (Cf. OECD 2010: 323).
57 High net worth individuals (HNWI) are defined as persons possessing a net financial wealth of more than 1 million US dollar. In 2007, HNWI counted 10.1 million people, implying that the average net financial wealth per HNWI person was about 4 million dollar (cf. Capgemini/Merrill Lynch 2010: 5).
58 Data from Bureau of Economic Analysis, table 6.16D, in: <www.bea.gov/>.

