


Servicios Personalizados
Revista
Articulo
 Inglés (pdf)
 Artículo en XML
 Referencias del artículo
 Enviar artículo por email
Indicadores
-
 Citado por SciELO
 -
 Accesos
Links relacionados
-
 Similares en
SciELO
Similares en
SciELO
Compartir

 Permalink
Investigación económica
versión impresa ISSN 0185-1667
Inv. Econ vol.69 no.271 Ciudad de México ene./mar. 2010
Looking for asymmetries over the Mexican business cycle
Búsqueda de asimetrías a lo largo del ciclo económico de México
Pablo Mejía–Reyes and Miguel Ángel Díaz–Carreño
Researchers of the Facultad de Economía of the Universidad Autónoma del Estado de México, <pmejr@uaemex.mx> and <madiaz@colpos.mx>, respectively.
Received May 2008
Accepted April 2009.
Abstract
The aim of this paper is to evaluate the existence of asymmetries in mean and variance in the dynamics of the main Mexican macroeconomic variables over business cycle regimes. Following the lines of the classical business cycle approach, a battery of statistics and autoregressive models is applied. Our main results can be summarised as follows: 1) there is evidence of asymmetries both in mean and variance in the cases of investment and imports, 2) industrial production, employment, unemployment rate and nominal interest rate exhibit asymmetries in mean only, and 3) exports, inflation rate and real exchange rate show asymmetries in variance only. One implication of these results is that linear models may be inappropriate to model these variables while nonlinear models may be useful to deal with their characteristics and dynamics.
Key words: business cycle, asymmetries, Mexico.
Clasificación JEL:* E32
Resumen
El objetivo de este documento es evaluar la existencia de asimetrías en media y varianza a través de los regímenes del ciclo económico en las principales variables macroeconómicas de la economía mexicana; para ello, se utilizan diferentes estadísticos y modelos autorregresivos. Nuestros resultados sugieren la existencia de asimetrías tanto en media como en varianza en los casos de la inversión, el empleo y las importaciones; sólo de asimetrías en media para la producción industrial, la tasa de desempleo y la tasa de interés nominal, y de asimetrías en varianza para la inflación, el tipo de cambio real y las exportaciones. Una implicación de nuestros resultados es que los modelos lineales pueden ser inapropiados para estas variables, por lo que los modelos no lineales son útiles para analizar sus características y dinámicas asimétricas a lo largo del ciclo económico de México.
Palabras clave: ciclo económico, asimetrías, México.
INTRODUCTION
In the context of the dominance of the Keynesian paradigm and the use of economic policies to stabilise economic fluctuations, the world economy experienced decades of sustained growth. Nonetheless, the mid–1970s witnessed a severe crisis and a deep recession that called the attention of researchers to revisit the analysis of the nature of business cycles (BC). Ever since, numerous theories have been put forward to investigate their causes, transmission mechanisms and effects.1 In turn, on the empirical side, different methodologies have been introduced to analyse the main features of business cycles, but soon two of them became the most popular in the literature. The first one is called growth cycles, an approach linked to the real BC theory proposed by Lucas (1977) and to the empirical methodology by Kydland and Prescott (1990).2
The application of this approach has contributed significantly to understand the dynamics of business cycles, but it has been criticised for being linear in nature, especially because several papers have presented evidence suggesting that many macroeconomic variables cannot be characterised as though they were generated by underlying linear processes. Therefore, conventional linear models may not be able to satisfactorily represent the effects of episodes of turbulence, economic crises and structural changes in the dynamics of economic series (see, for example, Neftçi 1984; DeLong and Summers 1986; Sichel 1989, 1993). This evidence has led researchers to develop appropriate methodologies to comprehend these BC characteristics by using the pioneering ideas of Mitchell (1927) and Burns and Mitchell (1946), who define cycle as a sequence of different regimes. A major issue in this view, known as the classical business cycles approach, is the detection of asymmetric characteristics (magnitude, duration and volatility) over the BC regimes (see also Hamilton 1989; Teräsvirta and Anderson 1992; Potter 1995). The present paper contributes to this tradition.
In spite of this, there seems to be only few studies analysing asymmetric characteristics for other macroeconomic variables in developing countries. For example, Mejía (2003c) uses the classical business cycles approach proposed by Artis, et al. (1997) to characterise the regimes of four macroeconomic variables of the Mexican economy and to measure their relation with the BC regimes. In turn, applying the techniques introduced by Harding and Pagan (2002, 2005), Du Plessis (2006) measures the duration, steepness and amplitude over the national BC regimes for a set of nine macroeconomic variables of seven emerging economies. In addition, he estimates the relation between these variables and the BC regimes by means of a concordance index. Let us notice that Mejía (2003c) and Du Plessis (2006) try to measure the synchronisation between the regimes of different variables and the regimes of the BC. In this paper, our objective is to set the scene to extend the analysis further in the said direction.
It is important to point out that the cost of estimating a nonlinear model for any purpose is higher than that associated to a linear model. Thereby, it is necessary to test the relevance of this kind of dynamics before taking on greater projects aiming to model them. Furthermore, before developing theoretical models in order to explain nonlinear dynamics and relations, it is necessary to demonstrate that this is a sensible issue. In this context, our objective is to provide empirical evidence on the importance of asymmetries over the BC regimes in the dynamics of a set of Mexican macroeconomic variables.3 To do so, we apply the asymmetry measures introduced by Sichel (1993), which evaluate asymmetries in mean. Afterwards, we explore whether the evidence of asymmetries can be associated to an asymmetric behaviour over the BC by estimating econometric models which try to distinguish the difference in mean and volatility over the BC regimes. Our results suggest that these types of asymmetries are significant in several cases. The need of researching further these characteristics is an immediate implication. This is our main contribution to the understanding of the dynamics of the Mexican economy's business cycle.
The rest of the paper is organised as follows: section 1 presents some basic definitions related to the classical business cycles approach; in section 2 we present the tests to be used and their statistical properties; in section 3 the data set is described and the results are presented and discussed; finally, some conclusions are stated.
BASIC DEFINITIONS
The analysis of classical business cycles is implicitly based on the definition by Burns and Mitchell (1946:3):
"Business cycles are a type of fluctuation found in aggregate economic activity of nations that organise their work mainly in business enterprises: a cycle consists of expansions occurring at about the same time in many economic activities, followed by similarly general recessions, contractions, and revivals, which merge into the expansion phase of the next cycle; this sequence is recurrent but not periodic; in duration business cycles vary from more than one year to ten or twelve years; they are not divisible into shorter cycles of similar character with amplitudes approximating their own."
Although modern theories emphasise only two regimes, expansion and recession, the representation of the cycle as a sequence of regimes has lasted up to now. One branch of the literature has devoted important efforts to the documentation of asymmetries over the BC regimes on the basis of some early observations. For long Mitchell (1927) claimed that "the most violent declines exceed the most considerable advances [...]. Business contractions appear to be a briefer and more violent process than business expansions". Likewise, Keynes (1936:314) argued that "[...] the substitution of a downward for an upward tendency often takes place suddenly and violently, whereas there is, as a general rule, no such sharp turning point when an upward is substituted for a downward tendency".
After the publication of Neftçi's (1984) seminal paper, a revival of the classical business cycles analysis in the spirit of Mitchell (1927) and Burns and Mitchell (1946) has been seen in the 1980s. Specifically, this approach emphasises the differences in the dynamics and relationships of economic variables between the BC regimes. For the purposes of this paper, it is of particular interest the fact that the mean growth rate is lower in recessions than in expansions, whilst volatility is higher in the former than in the latter; these patterns have been called asymmetries in mean and volatility respectively (see also DeLong and Summers 1986; Sichel 1989, 1993; Kähler and Marnet 1992).
Although the analysis of the nature of these patterns is still in its early stages, several theoretical explanations have been advanced. For example, Ishikawa (2003) claims that positive shocks can be interpreted as technological innovations, so economic agents may need some time to adopt a new technology and to learn how to use it efficiently. Therefore, the effects of such shocks diffuse over the economy with some time lag. On the contrary, negative shocks might immediately decrease the level or growth of productivity since no learning is needed to lose productivity. On the other hand, Chalkley and Lee (1998) suggest that recoveries from a recession are usually protracted by agents, since risk aversion prevents them to act promptly on receiving good news; conversely, the arrival of recessions is prompt, since risk aversion encourages them to act quickly on receiving bad news. Finally, Gilchrist and Williams (2000) develop a model where capacity constraints result in lower increases in expansions and larger decreases in recessions.
In a more general perspective, some other explanations have been proposed to give accounts of nonlinear dynamics and relationships between variables due to factors such as market frictions, multiple equilibria, non–reversible dynamics, regime shifts and structural instability, among others. On this basis, it has been possible to explain nonlinearities associated to asymmetric characteristics and dynamics of output, investment, employment, unemployment, real exchange rate, inflation rate and interest rate, among others.4
METHODOLOGY
The search for asymmetries over the BC in the dynamics of the Mexican macro–aggregates consists of two stages. Firstly, the claims of Mitchell and Keynes imply that economic downturns are brief and severe, whereas upturns are longer and more gradual. This implies that there should be significant skewness in a frequency distribution of the output growth rates (that is, the distribution should have significantly fewer than half its observations below the mean) and the median of the output growth rate should exceed its mean by an important amount. In addition, when kurtosis is significant there may be an important amount of outliers (DeLong and Summers 1986).5
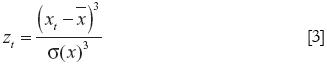
A more formal procedure consists of the application of the Sichel's (1993) tests, which allow for two types of asymmetry in mean being tested: steepness and deepness. Steepness occurs when contractions are steeper than expansions, whilst deepness is found when troughs are deeper than peaks' height. In that sense, the statistics are designed to test the detrended component xt of the variable yt (expressed in natural logarithms) for the presence of asymmetries according to:

where  is a non–stationary trend component and xt is a stationary component, possibly consisting of a cyclical component and a purely random variable. Along the definitions introduced by Sichel (1993), a time series exhibiting deepness should have fewer observations below trend than above it, but the average deviation of observations below trend should exceed the average deviations of observations above. Thus, 'deepness' is associated with significant negative skewness relative to trend, which suggests the following test statistic:

where  is the mean of xt, σ(x) is the standard deviation of xt and T is the sample size.
Given the possibility of serial correlation and heteroscedasticity in xt, an asymptotic consistent standard error of D(x) is needed. To obtain it, let us define the following variable:
The resulting estimated coefficient of the regression of this variable on a constant is identical to D(x) in [2], whilst the ratio of D(x) to the Newey–West (1987) standard error is asymptotically normal. Thus, conventional critical values can be used to test the null that the corresponding population parameter is zero.
Similarly, for a time series exhibiting 'steepness', sharp decreases should be larger but less frequent than more moderate increases, implying significant negative skewness in the first differences of the series. These properties suggest the following test statistic:
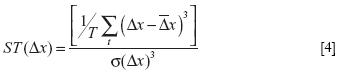
where  and σ(Δx) are the sample mean and standard deviation of Δx, respectively, and ST(Δx) and its standard error are calculated in a manner analogous to D(x).6
Second, it is important to underline that asymmetries identified with this methodology can be related or not to BC regimes: these statistics measure the degree of skewness in the distribution of different transformations of the series, but they are not designed to capture the correspondence between those asymmetries and the BC regimes. This issue is addressed by using a different framework. In particular, we specify and estimate autoregressive (AR) models of order q and test the residuals for specification errors that could indicate the existence of asymmetries both in mean and variance.7 This is a sensible approach to determine the presence of asymmetries given that linear and Gaussian models are incapable of generating spurious asymmetric fluctuations.8
Specifically, the Regression Specification Error Test (RESET) is applied to the residuals of the estimated models. The RESET, introduced by Ramsey (1969), is a general specification test with power on several possibilities among which we can find the omission of variables, incorrect functional form and correlation between the explanatory variables and the disturbance term as well as nonlinearity resulting from combinations of the powers and cross products of lagged values of the variable (in the context of autoregressive models). However, it is broadly known that this test has low power since it suggests neither the form of the nonlinearity nor the causes of the specification error because of which it can only give indicative evidence of nonlinearities in mean. On the other hand, the importance of nonlinearity in the conditional variance is evaluated according to the lines proposed by Engle (1982): if the conditional variance of the residuals of an AR model can be modelled as a function of its own lags, there is evidence of Autoregressive Conditional Heteroscedasticity (ARCH), which can be taken as an indication of nonlinearity in variance.9
It must be emphasised that the evidence of asymmetries and specification errors may be associated to differentiated (asymmetric) dynamics of the macroeconomic variables over the phases of the BC (expansion and recession). Nevertheless, that it is not necessarily the case since such evidence can be linked to some other characteristics of the series. Thus, we explicitly need to explore whether these asymmetries and specification errors can be actually associated to the BC regimes.
To carry on with this task, we apply the extended Acemoglu and Scott's (1994) specification proposed by Andreau et al. (2000). To evaluate the existence of asymmetries in the conditional mean linked to the BC regimes, the following regression is applied:
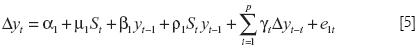
where y is a stationary variable (first difference) and S is a dummy variable that defines the BC regime at which the economy is: S = 1 when the economy is in recession and S = 0 if it is in expansion. As Millard et al. (1997) argue, pro–cyclical asymmetry exists when  is statistically significant and negative, and vice versa. Similarly, there is evidence of dynamic asymmetry if the persistence of y varies over the regimes, which requires
  being statistically different from zero. Since both effects generate asymmetries over the BC, we just refer to them as asymmetries in the conditional mean. In turn, to evaluate whether the arch patterns can be associated to asymmetries in volatility the following extension of the previous formulation is used:

where  is the squared of the deviations of the series with respect to its mean. In this formulation, the estimated intercept–coefficient
  measures the dependence of the variance of yt on the BC regimes, whilst the dynamic asymmetry coefficient
  evaluates whether the ARCH pattern changes over the BC regimes.10 Notice that equation [6] is estimated for the first difference of the (logs of the) series, given that volatility is interpreted as the evolution of the squared deviations of the series with respect to its mean.
RESULTS
The described methodologies are applied to analyse the dynamics of the following variables of the Mexican economy: industrial production (IP), manufacturing production (MP), investment (I), unemployment rate (UR), employment (E), inflation rate (P), nominal interest rate (NI), real interest rate (RI), real exchange rate (RER), exports (X), imports (M) and trade balance (NX). The monthly series have been seasonally adjusted by using the United States Census Bureau's X–12 seasonal adjustment program provided in EViews 6.0, when necessary. The period of analysis spans from 1970 to 2007 and the data source is the Instituto Nacional de Estadística, Geografía e Informática (inegi); see Data Appendix for details.11 The results are discussed in detail below.
Basic statiscal properties
As a first step in the analysis, we computed the basic statistics of the series and evaluated their stationarity properties with informative purposes; the results are shown in table 1. The basic statistics of the annual transformations of the series12 show a great heterogeneity in their performances. For example, it can be observed that the trade variables have exhibited greater average annual growth rates (around 10%) than the output and employment indicators (around 3.5%). On the other hand, variables such as inflation rate, unemployment rate, real interest rate and real exchange rate have experienced low annual variations, but very high volatility, as measured by their standard deviations and the ranges of their values.
Also notice that the basic statistics can provide preliminary evidence of asymmetric characteristics of the variables. As DeLong and Summers (1986) have pointed out, the aforementioned claims of Mitchell and Keynes imply that there should be significant skewness in a frequency distribution of the growth rates of output and the median should exceed the mean by an important amount. In addition, they argue that the excess of kurtosis can result from the significance of outliers. Several conclusions can be drawn from the statistics in table 1. First, the relationship between the mean and the median suggests that asymmetries can be important in the cases of the industrial and manufacturing production, the international trade variables and investment. Second, the skewness is negative in the previous five cases as well as in those of employment, the inflation rate and the nominal interest rate. In the other four cases (UR, RI, RER and NX) skewness is positive, suggesting that the distribution of their annual variations is positively biased. Third, there is an excess of kurtosis in nine out of twelve cases, which derives in leptokurtic distributions (reflecting the importance of extreme observations also shown in the range of the data). Fourth, the normality test proposed by Jarque and Bera (1980) summarises these properties of the series: the evidence does not support the null of normality of the variables (at 1% of significance). To sum up, this information suggests that asymmetries can be important in the cyclical fluctuations of these Mexican macroeconomic variables.
To complete the statistical characterisation of the series and following the tradition introduced by Nelson and Plosser (1982), we next determine the order of integration of the variables by using three different unit root tests: the Generalised Least Squares Dickey Fuller (DFGLS) test of Elliot et al. (1996), the Phillips and Perron (1988) (PP) test and the Kwiatkowski, Phillips, Schmidt and Shin (1992) (KPSS) test. The former two tests evaluate the null hypothesis of unit root, correcting serial correlation and heteroscedasticity, while the latter test the null of stationarity. These tests are applied to deal with the size and power problem of unit root tests pointed out in the literature: the robustness of the results is implicitly evaluated by using test that considered opposite cases under the null hypothesis, which reduces the possibility of erroneously reject the correct hypothesis.13
Specifically, we evaluate whether the series in levels (logs) are stationary around a deterministic linear trend (trend–stationary) and whether the differences of the logs are stationary around a constant (mean–stationary). The results, shown in table 1, suggest that the series are integrated of order 1, I(1), or nonstationary around a trend, except in a few cases. The DFGLS test suggests that real interest rate (RI), trade balance (NX) and real exchange rate (RER) are trend–stationary, whilst the PP test implies that this is the case of real interest rate (RI), imports (M) and trade balance (NX). Let us notice, however, that the KPSS test cannot reject the null of stationarity only in the case of trade balance (NX). Given the limitations that most unit root tests may have (see Maddala and Kim 1998), we conclude that the evidence of stationarity is only robust for NX. Therefore, all the other variables can be considered as I(1). On the contrary, the first differences of the logs of the series appear as stationary according to the three unit root tests. As it is very well known, these results imply that the shocks (both random and policy–induced) experienced by the stationary transformation of the variables can have transitory effects only, which implies that eventually the series revert to their means. These results are consistent with those reported in the literature by Cuadros (2000), Loría (2001), Esquivel and Razo (2002), Castillo (2002) and Galindo and Catalán (2003), who analysed the stationarity of several of the variables considered in this paper. It is worthwhile to point out that for a period similar to ours, only Galindo and Catalán (2003) analyse the stationarity of the real interest rate in the presence of structural change; their results nonetheless, suggest that this variable is stationary both considering it and without taking it into account.
So far our findings imply that several Mexican macroeconomic variables exhibit non–conventional features, which may have been generated by underlying nonlinear processes that yield asymmetric characteristics. In the next section we address this issue by using a more formal approach.
Evidence on asymmetries
The results obtained from the application of expressions [2] and [4] to measure asymmetries are reported in table 2. According to the argument suggested by Sichel (1993), the deepness test was applied to the de–trended component of each series, so we can check whether fewer observations lie below the mean than above and whether their average is larger than that of the observations above that same mean. The trend was removed by applying the corrected version of Hodrick and Prescott's (1997) filter (HPC) suggested by Ravn and Uhlig (2002). In turn, the steepness analysis is based on the first difference of each series, so we can evaluate whether decreases in the series are larger than increases. As requested by Sichel (1993), the HPC filter extracts ct to test for deepness and the first difference let us obtain Δct to evaluate steepness.14
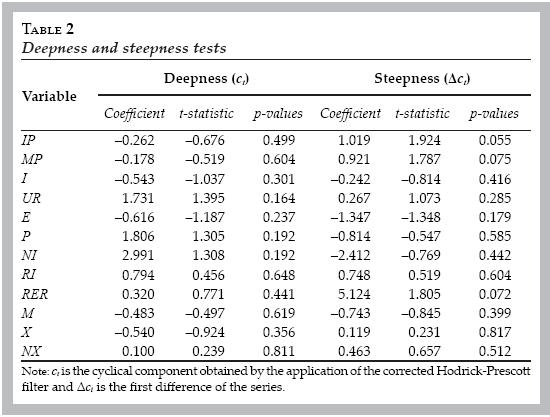
Table 2 contains the estimated values of D(x) and ST(Δx)their related t statistics and the p–values associated to the null that the statistics are equal to zero. According to these results there seems to be no evidence of deepness for any variable at any conventional level of significance. Moreover, steepness is significant only in the cases of industrial and manufacturing production and the real exchange rate. For the former two cases, these results could be considered as evidence of asymmetric dynamics over the BC given that industrial and manufacturing production are often used as indicators of the cycle. As for the case of the real exchange rate the evidence can be read in an opposite way: asymmetry is related to the fact that increments (depreciations) have been larger than decreases (appreciations); this has been documented above on the basis of the basic statistics.
Next, we analyse whether asymmetric characteristics of the series can be related to the regimes of BC by using an auto–regression framework, as it is largely done in this literature. Furthermore, the analysis is extended to address the significance of ARCH patterns and their relationship to the cycle regimes.
Autoregressive models and asymmetries over the BC
Aiming to detect specification errors that may indicate the existence of asymmetries both in mean and variance, we estimate ar models of order q. Specifically, as mentioned above, we evaluate the linear specification by using the RESET (Ramsey 1969) and the presence of ARCH patterns by means of the Engle's (1982) test. The order of the ar models for the first difference of each series was determined by following a 'general to specific' approach, starting from 12 lags up to 1.15 The model that minimises the Schwarz criterion was chosen as the final model; the results and the specification tests are presented in the first part of table 3.
The second column reports the order of the estimated ar model for each variable. According to the reset results, the null of adequate specification is rejected in all cases at least at 5% of significance, except for the investment indicator. Additionally, the null is also rejected at a significance level of 10% in the case of the real exchange rate. In turn, the null of no ARCH (of orders 1 and 2) is rejected at least at 5% of significance for most variables and only in the case of the rer this happens at a significance level of 10%. The statistical properties of the residuals are also reflected in Jarque and Bera's (1980) normality test: the null of normality is rejected in all cases at 1% of significance, except for the unemployment rate.
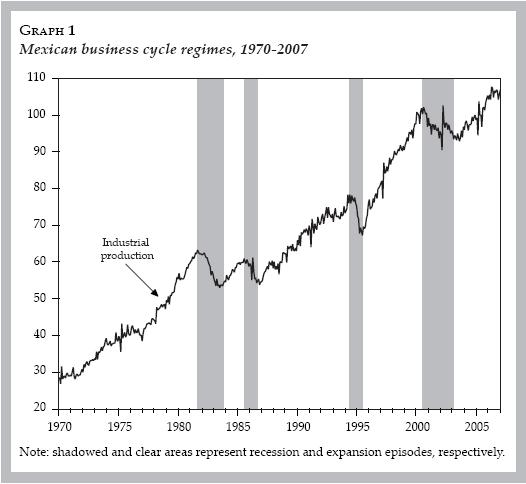
As it is well known, RESET is a general test that indicates an inappropriate specification, but it does not give any information about the cause of the problem. In turn, the ARCH test suggests the existence of heteroscedasticity possibly linked to clustering volatility. To determine whether this evidence can be associated to the BC regimes of the Mexican economy we estimate equations [5] and [6]; the results are reported in table 3. The variable St was defined on the basis of the BC regimes reported for Mexico by Mejía (2004)16 which can be observed in graph 1.
It is interesting to observe that the evidence of inadequate specification suggested by the RESET test can be associated to asymmetries in mean only in six out of twelve series. In the case of the industrial production, investment, employment and imports there is evidence of pro–cyclical asymmetry, given that is negative and statistically significant, which implies that the mean is lower during recessions than during expansions. Also, the fact that is statistically different from zero, at least at 10%, reflects the existence of dynamic asymmetry in these cases, suggesting that the persistence of the series varies over the BC regimes. Dynamic asymmetry is also present in the cases of unemployment rate and nominal interest rate. In turn, the evidence suggests that the net exports exhibit counter–cyclical asymmetry. Notice that this approach indicates that asymmetries in mean are more common than Sichel's tests, which may be related to the fact that regression [5] estimates explicitly the differences in mean across defined regimes, whilst the other tests are overall measures of skewness. Also, notice that the results reported in this section are in line with those extracted from the basic statistics of the data.
On the other hand, the corresponding tests indicate that all series exhibit ARCH patterns. As it is known, this statistical characteristic of the series can be modelled by using an AR specification in the squares of the estimated residuals. However, our interest here is to evaluate whether these patterns can be related to the BC regime. In other words, we wish to decide whether the ARCH behaviour varies across the regimes. The results presented in Table 3 show that is statistically significant, implying that volatility is larger during recessions than during expansions in four cases: inflation rate, real exchange rate, imports and exports. In other four cases, investment, exports, real exchange rate and inflation, is significantly different from zero, indicating that the arch component changes over the regimes. Overall, there is evidence of regime dependent volatility in eight out of 12 series.
These results are in line with those reporting a positive and significant linear relationship between production, investment, employment and imports (see for example Alper 2002; Mejía 2003c). Also, they are consistent with those presented by Arango and Melo (2006), who find asymmetric dynamics over the BC in the industrial production of Mexico. However, the most important implication of our results is that the reaction of several Mexican macroeconomic variables may be stronger during recessions than during expansions: their falls during the former may be larger in absolute value than the increments during the latter, whilst the volatility may be higher during the former than during the latter. Regarding industrial production, investment, employment and unemployment, these facts may be associated to the costs of adopting new technologies, the reactions before news by risk averse agents and capacity constraints (especially in the exporting sector) according to the lines suggested by Ishikawa (2003), Chalkley and Lee (1998) and Gilchrist and Williams (2000). Additionally, notice that recessions in Mexico have been characterised by high volatility explained by abrupt devaluations of the nominal and real exchange rates and sharp increments in inflation and interest rates. This instability negatively affected the consumers and producers decisions, who postponed their purchases of capital and consumption goods, both imported and domestically produced. In turn, the stabilisation of the economy may have caused an increase in the economic agents' expenses, which could have started the reactivation of the economy. However, it is sensible to think that agents became averse to risk, so their reaction could have been smaller than that during recessions.
CONCLUSIONS
This paper analyses the characteristics of a set of transformations of twelve macroeconomic variables of the Mexican economy in order to detect the presence of asymmetries both in mean and variance and, if so, to explore whether such dynamics can be associated to the regimes of the BC. The set of analysed variables includes the industrial and manufacturing production, investment, employment, unemployment rate, nominal and real exchange rate, nominal and real effective interest rate, inflation rate, exports, imports and trade balance. For most variables, even basic statistics suggest that the distributions of the growth rates of several variables are asymmetric: some real variables have a negative skewness, large range and excess of kurtosis. It is remarkable the fact that all of them have non normal distributions.
However, the results of the application of the statistical tests introduced by Sichel (1993) suggest the existence of asymmetries in mean only for industrial and manufacturing production as well as for the real exchange rate, and that refers to steepness. One fact that may explain why the Sichel's tests yield less evidence of asymmetries is that they are sensitive to outliers. Thus further research is needed to overcome this limitation of the test.
On the contrary, the estimated autoregressive models –which cannot induce spurious asymmetry– contain significant specification errors and ARCH patterns, which may be associated to asymmetries over BC regimes. A formal evaluation of this conjecture let us conclude that there exists evidence of asymmetries both in mean and variance in the cases of investment and imports; of asymmetries only in mean for industrial production, trade balance, employment, unemployment rate and nominal interest rate, and of asymmetries in variance for inflation rate, real exchange rate and exports.
These findings provide initial evidence of asymmetric characteristics over BC regimes and they are relevant in the sense that they suggest the need to use appropriate models to satisfactorily apprehend these characteristics for the Mexican macro–aggregates. This seems to be a sensible conclusion given that Mexico has experienced severe economic crises and deep structural transformations during the last decades. So, hardly the dynamics over time of the macroeconomic variables have remained unchanged in this period. In these circumstances, nonlinear models can be useful in two different areas: structural change modelling and BC regime dependent dynamics of the series. What is more, it is difficult to accept that the relationships between macroeconomic variables have remained stable. Therefore, modelling changes in the univariate dynamics of the Mexican variables as well as in the relationships between them are a promising area for future research. Furthermore, once this empirical evidence is well established, specific theoretical formulations should be advanced to explain it.
ACKNOWLEDGES
The authors acknowledge funding from this university under the research project 2359/2006–02 as well as the research assistance by Annel Hurtado–Jaramillo y Jeanett Campos–Chávez. The first author also would like to recognise sponsoring from Consejo Nacional de Ciencia y Tecnología (CONACYT), Project 138194–D. Comments from two anonymous referees have been very useful to improve this paper. As usual, remaining errors and omissions are the sole responsibility of the authors.
REFERENCES
Acemoglu, D. and A. Scott, "Asymmetries in the cyclical behaviour of UK labour markets", Economic Journal, vol. 104, 1994, pp. 1303–1323. [ Links ]
Agénor, P.R.; CJ. McDermott and E.S. Prasad, "Macroeconomic fluctuations in developing countries: some stylized facts", The World Bank Economic Review, vol. 14, no. 2, 2000, pp. 251–285. [ Links ]
Alper, E., "Stylized facts of business cycles, excess volatility and capital flows: evidence from Mexico and Turkey", Russian and East European Finance and Trade, vol. 38, no. 4, 2002, pp. 22–54. [ Links ]
Andreau, E.; D. Osborn and M. Sensier, "A comparison of the statistical properties of financial variables in the USA, UK and Germany over the business cycle", The Manchester School, vol. 68, no. 4, 2000, pp. 396–418. [ Links ]
Arango, L. and L. Melo, "Expansions and contractions in Brazil, Colombia and Mexico: A view through nonlinear models", Journal of Development Economics, vol. 80, 2006, pp. 501–517. [ Links ]
Artis, M.; Z.G. Kontolemis and D.R. Osborn, "Business cycles for G7 and European countries", The Journal of Business, vol. 70, no. 2, 1997, pp. 1–16. [ Links ]
Backus, D.K.; P.J. Kehoe and F.E. Kydland, "International business cycles: theory and evidence", in T.F. Cooley (eds.), Frontiers of Business Cycles Research, Princeton, Princeton University Press, 1995, pp. 331–356. [ Links ]
Burns, A. and W. Mitchel, Measuring Business Cycles, Studies in Business cycles, New York, National Bureau of Economic Research (NBER), no. 2, 1946. [ Links ]
Calderón, C. and R. Fuentes, "Characterizing the business cycles of emerging economies", World Bank/Central Bank of Chile, manuscript, 2006. [ Links ]
Castillo, R., "Foreign direct investment and the supply of credit in Mexico", Momento Económico, no. 123, 2002, pp. 38–44. [ Links ]
Chalkley, M. and I. Lee, "Learning and asymmetric business cycles", Review of Economic Dynamics, vol. 1, no. 3, 1998, pp. 623–645. [ Links ]
Cuadros, A., "Exportaciones y crecimiento económico: un análisis de causalidad para México", Estudios Económicos, vol. 15, no. 1, 2000, pp. 37–64. [ Links ]
DeLong, J. and L. Summers, "Are business cycles symmetrical?", in R.J. Gordon (ed.), The American Business Cycle, Chicago, Chicago University Press, 1986, pp. 166–179. [ Links ]
Du Plessis, S., "Business cycles in emerging market Economies: a new view of the stylised facts", Stellenbosch Economic Working Papers, no. 2, 2006. [ Links ]
Dufrénot, G. and V. Mignon, Recent Developments in Nonlinear Cointegration with Applications to Macroeconomics and Finance, Boston, Kluwer Academic Publishers, 2002. [ Links ]
Elliot, T; T. Rothenberg and J. Stock, "Efficient tests for an autoregressive unit root", Ecomometrica, vol. 64, 1996, pp. 813–836. [ Links ]
Engle, R., "Autoregressive conditional heteroscedasticity with estimates of the variance of the United Kingdom inflation", Econometrica, vol. 50, 1982, pp. 987–1007. [ Links ]
Esquivel, G. and R. Razo, "Fuentes de la inflación en México, 1989–2000: un análisis multicausal de corrección de errores", Estudios Económicos, vol. 18, no. 2, 2002, pp. 181–226. [ Links ]
Galindo, L.M. and H. Catalán, "La tasa de interés real en México: un análisis de raíces unitarias con cambio estructural", Momento Económico, no. 126, 2003, pp.15–22. [ Links ]
Gilchirst, S. and J. Williams, "Putty–clay and investment: a business cycle analysis", Journal of Political Economy, vol. 108, no. 5, 2000, pp. 928–960. [ Links ]
Granger, C. and T. Teräsvirta, Modelling nonlinear economic relationships, Oxford, Oxford University Press, 1993. [ Links ]
Hamilton, J., "New approach to the economic analysis of nonstationary time series and the business cycle", Econometrica, vol. 57, 1989, pp. 357–384. [ Links ]
Harding, D. and A. Pagan, "Dissecting the cycle: a methodological investigation", Journal of Monetary Economics, vol. 49, 2002, pp. 365–381. [ Links ]
––––––––––, "A suggested framework for classifying the modes of cycle research", Journal of Applied Econometrics, vol. 20, 2005, pp. 151–159. [ Links ]
Hodrick, R. and E. Prescott, "Postwar U.S. business cycles: an empirical investigation", Journal of Money, Credit, and Banking, vol. 29, no. 1, 1997, pp. 1–16. [ Links ]
Ishikawa, T., "Technology diffusion and business cycle asymmetry", Kyushu Kyoritsu University, manuscript, 2003. [ Links ]
Jarque, C. and A. Bera, "Efficient tests for normality, homoscedasticity, and serial independence of regression residuals", Economics Letters, vol. 6, 1980, pp. 255–259. [ Links ]
Johnson, C., "A switching regime model for Chilean growth", Central Bank of Chile, manuscript, 2001. [ Links ]
Kähler, J. and V. Marnet, "International business cycles and long–run growth: an analysis with Markov–switching and cointegration models", Recherches Économiques de Louvain, vol. 58, no. 3–4, 1992, pp. 399–417. [ Links ]
Keynes, J., The General Theory of Employment, Interest, and Money, London, Macmillan, 1936. [ Links ]
Kwiatkowski, D.; P. Phillips; P. Schmidt and Y. Shin, "Testing the null hypothesis of stationarity against the alternative of a unit root: How sure are we that economic time series have a unit root?", Journal of Econometrics, vol. 54, 1992, pp. 159–178. [ Links ]
Kydland, F. and E. Prescott, "Business cycles: real facts and monetary myth", Federal Reserve Bank of Minneapolis Quarterly Review, vol. 14, no. 2, 1990, pp. 3–18. [ Links ]
Loría, E., "La restricción externa dinámica al crecimiento de México, a través de las propensiones del comercio, 1970–1999", Estudios Económicos, vol. 16, no. 2, 2001, pp. 227–251. [ Links ]
Lucas, R., "Understanding business cycles", Carnegie–Rochester Conference Series in Public Policy, vol. 5, 1977, pp. 7–29. [ Links ]
Maddala, G. and I. Kim, Unit roots, Cointegration and Structural Change, Cambridge, Cambridge University Press, 1998. [ Links ]
Mejía, P., "Regularidades empíricas en los ciclos económicos de México: producción, inversión, inflación y balanza comercial", Economía Mexicana. Nueva Época, vol. XII, no. 2, 2003a, pp. 231–274. [ Links ]
––––––––––, No linealidades y ciclos económicos en América Latina, Zinacantepec, El Colegio Mexiquense/Universidad Autónoma del Estado de México, 2003b. [ Links ]
––––––––––, "¿Están sincronizadas las principales variables de la economía mexicana?", Momento Económico, no. 27, 2003c, pp. 27–38. [ Links ]
––––––––––, "Classical Business Cycles in America: are national business cycles synchronised?", International Journal of Applied Econometrics and Quantitative Studies, vol. 1, núm. 3, 2004, pp. 75–102. [ Links ]
Millard, S.; A. Scott and M. Sensier, "The labour market over the business cycle: can theory fit the facts?", Oxford Review of Economic Policy, vol. 13, no. 3, 1997, pp. 70–92. [ Links ]
Mitchell, W., Business cycles: The problems and its setting, New York, NBER, 1927. [ Links ]
Mora, J., "No linealidades y asimetrías en el PIB colombiano", Estudios Económicos, vol. 12, no. 2, 1997, pp. 183–195. [ Links ]
Neftçi, S., "Are economic time series asymmetric over the business cycle?", Journal of Political Economy, vol. 92, 1984, pp. 307–328. [ Links ]
Nelson, C. and C. Plosser, "Trends and random walks in macroeconomic time series: some evidence y implications", Journal of Monetary Economics, vol. 10, 1982, pp. 139–162. [ Links ]
Newey, W. and K. West, "A simple, positive semi–definite, heteroskedasticity and autocorrelation consistent covariance matrix", Econometrica, vol. 55, 1987, pp. 703–708. [ Links ]
Oliveira, A., "Are Mexican business cycles asymmetrical?", International Monetary Fund (IMF), Working Paper no. WP/02/150, 2002. [ Links ]
Phillips, P. and P. Perron, "Testing for a unit root in time series regression", Biometrika, vol. 75, no. 2, 1988, pp. 335–46. [ Links ]
Potter, S. M., "Nonlinear time series modelling: an introduction", Journal of Economic Surveys, vol. 13, no. 5, 1999, pp. 505–528. [ Links ]
––––––––––, "A nonlinear approach to US GDP", Journal of Economic Surveys, vol. 13, 1995, pp. 505–528. [ Links ]
Ramsey, J., "Tests for specification errors in classical linear least squares regression analysis", Journal of the Royal Statistical Society, vol. 31, 1969, pp. 350–371. [ Links ]
Ravn, M. and H. Uhlig, "On adjusting the Hodrick–Prescott filter for the frequency of observations", Review of Economics and Statistics, vol. 84, 2002, pp. 371–380. [ Links ]
Romer, D., Advanced Macroeconomics, New York, McGraw–Hill, 1996. [ Links ]
Salvatore, D., Statistics and Econometrics, New York, McGraw–Hill, 1982. [ Links ]
Sichel, D., "Are business cycle asymmetric? A correction", Journal of Political Economy, vol. 97, 1989, pp. 1255–1260. [ Links ]
––––––––––, "Business cycle asymmetry: a deeper look", Economic Inquiry, vol. 31, 1993, pp. 224–236. [ Links ]
Teräsvirta, T. and H. Anderson "Characterizing nonlinearities in business cycles using smooth transition regression models", Journal of Applied Econometrics, vol. 7, 1992, pp. 119–139. [ Links ]
Van Dijk, D., T. Teräsvirta and P. H. Franses, "Smooth Transition Autoregressive Models–A Survey Of Recent Developments," Econometric Reviews, vol. 21, no. 1, 2002, pp. 1–47. [ Links ]
*JEL: Journal of Economic Literature-Econlit.
1 The most important theories that try to explain business cycles correspond to the market–clearing models based on the classical view and the sticky prices models inspired in the Keynesian tradition. See Romer (1996) for an excellent exposition of the fundamentals.
2 This methodology consists of analysing the co–movement between the main (de–trended) macroeconomic variables over time. The coincidence between movements over (or below) the deterministic or stochastic trend is very important to determine the stylised facts. It has been widely used to study the experience of both developed countries (Backus et al. 1995) and developing economies (Agénor et al. 2000; Mejía 2003a).
3 In other words, we analyze asymmetries in the dynamics of these variables over the regimes of the reference cycle, which differs from the approach of Mejía (2003c) and Du Plessis (2006) who identify the asymmetries over regimes of the specific cycles of each variable.
4 See Granger and Teräsvirta (1993) and Dufrénot and Mignon (2002), for an overview of this literature; giving a full account of it would demand a large space and it is beyond the aim of this paper.
5 For a symmetrical distribution about its mean, the skewness is zero and for a symmetrical (unimodal) distribution, the mean, median and mode are equal. A distribution is negatively skewed if the left tail is longer. Then mode > median > mean. A peaked curve is leptokurtic, as opposed to a flat one (platykurtic), relative to one that is mesokurtic. The kurtosis for a mesokurtic curve is 3. Skewness can be measured by the third moment divided by the cube of the standard deviation. Kurtosis can be measured by the fourth moment divided by the standard deviation raised to the fourth power (see Salvatore 1982). This methodology has been applied by Mejía (2003b, 2004).
6 It should be noted that although the preceding discussion focuses on the recessionary interpretations of deepness and steepness, a time series may also exhibit asymmetry of a converse nature. Similarly, a series may exhibit 'expansionary steepness' and positive skewness in first differences, due to sharp increases being larger but less frequent than rather moderate decreases.
7 We used autoregressive models 'without holes', which means that the chosen model includes all the lags from 1 up to q.
8 In particular, given that an AR model of a variable xt has a moving average representation, it can be expressed by a linear combination of identically, independently and symmetrically distributed Gaussian disturbances. See Teräsvirta and Anderson (1992), Granger and Teräsvirta (1993), Potter (1999) and Van Dijk et al. (2002) for a deeper discussion on these issues. Potter also offers a wide exposition on the methodological aspects of nonlinearity testing.
9 See Granger and Teräsvirta 1993, Chapter 6, for a wide discussion on this issue.
10 Notice that existing asymmetries in the conditional variance can be in fact a consequence of asymmetries in mean, given that the effects on the conditional mean are not excluded.
11 Data was obtained from the web site: <http://www.inegi.gob.mx>.
12 For variables expressed in dollars, people and indexes, such as industrial and manufacturing production, investment, employment, real exchange rate, imports and exports, we considered the statistics of the annualised growth rate, whilst for the rest of the variables –unemployment rate, inflation, nominal and effective real interest rate (expressed in percentages) and trade balance– we based the calculations on the annualised variations.
13 However, we are aware that this practice does not completely overcome those limitations. It is also important to keep in mind that there are some other problems related to the analysis of stationarity, namely the effects of structural changes and regime–switches on the stationarity of the series (see Maddala and Kim 1998). However, the analysis of these issues would require a specific paper and it is beyond our aims in this one.
14 These filters satisfy the requirements established by Sichel (1993) so they do not induce spurious asymmetry. These criteria are: a) the detrending filter has a linear representation; b) the filters induce stationarity, and c) the filters extract the appropriate component for the asymmetry test.
15 The procedure is as follows: AR models ('without holes') of a decreasing order are estimated and then the associated values of the Schwarz criterion are compared; here we report the results for the model that minimises it.
16 The regimes for the more recent period were determined by using the same methodology (see Artis et al. 1997).

