nueva página del texto (beta)
 Inglés (pdf)
 Artículo en XML
 Referencias del artículo
 Enviar artículo por email
 Citado por SciELO
  Similares en
SciELO
Similares en
SciELO 
 Permalink
Introduction1
Income from work is the major source of income for most European and Spanish families. According to the information available, around 70% of the family income of European families comes from work (79% in the Spanish case). Therefore, whatever happens to income distribution and poverty will be highly related to the evolution of wages and employment. Poverty is usually associated with situations of exclusion from the labour market. In fact, the poor are over-represented among the unemployed or those too young or too old to work, or those with dependents and out of the labour force, or those handicapped and lacking the required skills to get and maintain a job. However, as we will have the opportunity to see further on, a large proportion of families below the poverty line can be considered from all perspectives as working families, i.e. households with one or more of their members gainfully employed.
Spain has experienced an impressive employment growth from 1994 to 2004. In fact, according to Organization for Economic Co-operation and Development (OECD) data, the unemployment rate came down from 24.2 to 11% along this period. However, very scant attention has been put in the lowest bound of the labour market, i.e., poorly remunerated employees. The aim of this paper is to analyze the evolution of low paid work in a context of high job creation as has been the case of the Spanish economy in the last decade.2 In order to do so, this paper is organized in four sections. In the first one, after defining what is considered low wage employment, we briefly review the evolution of wage inequality in Spain. This analysis sets the stage for section two, in which we will estimate the incidence, intensity, severity, and evolution of low wage work in Spain since the early nineties. In this section, we identify who the low wage workers are, in which sectors they work and in what areas of the country they live. The third section is devoted to studying the relationship between low wages and poverty. Finally, in the fourth section, the major conclusions are summarised.
Low wages and wage inequality in Spain
Defining a threshold under which a wage is considered “low” is necessarily something subjective. Even if we choose to use an “objective” procedure to define what should be considered as a low wage, taking as reference, for example, a fixed set of goods and services that a worker should be able to afford with his/her wage in order not to be considered a low wage earner, such a process is not necessarily less subjective than choosing ex ante a certain floor, as we could always discuss why some goods or services were chosen and not others. In fact, the so-called “absolute” poverty line built following the former method is subject to well-known criticism. In any case, to our knowledge there has not been any intent to set a low wage threshold using this approach.
The common and pragmatic way of “solving” this problem, is to subjectively define a low wage threshold as an X percentage of the average or the median wage, without much hassle about whether the X percentage should be one or the other. The European Union, for example, sets the percentage at 60% of the median wage, probably just reflecting their current definition of poverty risk (60% of the national median equivalised income). Other studies such as those of Marx and Salverda (2005) and Fernández, et al. (2004) choose 2/3 of the median wage as the cut-off line for low wage workers, following the proposal of the OECD’s Employment Outlook 1997. In order to guarantee comparability with Eurostat, in this paper we have decided to use the low wage line proposed by this institution. Therefore, in the following pages we will assume the Eurostat definition of low wage workers, as workers with wages under 60% of the median wage, offering estimates of the incidence of low wages attending to both net and gross wages to gauge the distributional impact of income tax and social security contributions. In any case, we have replicated the analysis using a 2/3 cut-off line (Appendix I), both to gauge the implications of using an alternative low wage threshold and to allow comparisons to other papers that use such criteria. As total wage is the product of the hourly wage by number of hours, the percentage of low wage workers is going to be affected by both low hourly wages and low working hours. In order to offer more information about the nature of low wage work, hourly low wage work will be estimated as well, defined in this case as the percentage of workers with hourly earnings below 60% of the median hourly wage.
This relative definition of low wages implies that the growth of the average wage, when accompanied by changes in the distribution of wages, can lead to changes in the proportion of low wage workers even if there is no variation in the actual wage received by the worker, who all of the sudden, because of changes in the wages of the rest of the workers, is transformed into a low wage worker. Owing to this circumstance, in what follows we will review the evolution of wage inequality in Spain. But before doing so, a brief account of the recent evolution of wages will be offered.
During the last decade, Spanish real wages have been stagnant: from 1996 to 2005, the increase of real wage cost per worker (and index that we will take as a proxy of average wage) rose a total of 0.47%. If we take 2000 as the starting year for the comparison, total wage real costs in fact decreased by a total of 0.45%, according to data from the Quarterly Labor Cost Survey and the Wage Survey. Thus, from an aggregate point of view, we can say that during the last decade, the improvement of the Spanish labour market was limited to the much needed generation of employment: in the same period total employment increased by 53.6% (from 12 to 19 millions), but in a context of aggregate wage freezing. This wage moderation, demanded both by the government and employers’ associations, and backed by the major Spanish trade unions, is considered as one of the key elements behind the gargantuan employment growth experienced in Spain in the last decade.
In this context of stagnant wages it is also interesting to know what has happened to their distribution. The most important source for studying the evolution of wage inequality in Spain is the European Community Household Panel (ECHP), developed to study the distribution of income in European households. Although it is known that the ECHP underestimate wages by around 25% (Sanz, et al., 2004), this source has the advantage of supplying data of family income, and is thus a good source (in fact the only source) for studying the relationship between wages and poverty.3
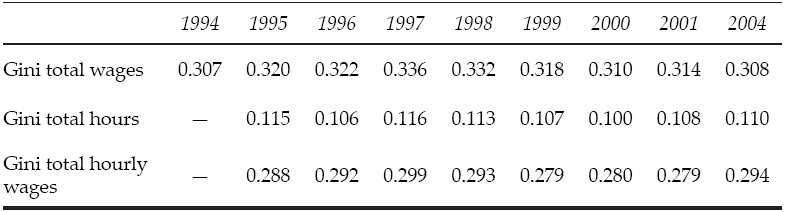
According to the ECHP, from 1994 to 2004, the last year available,4 gross wage distribution of total employees, as measured by the Gini Index (Table 1), remained roughly constant, going from 0.307 in 1994 to 0.308 in 2004 (reaching a maximum of 0.336 in 1997). The behaviour is basically the same in terms of hourly wages (0.294 in 2004, with a maximum in 1997 of 0.299). In any case, differences in working time are very few, with a Gini Index for the number of hours worked of only 0.110.
Table 1: Distribution of gross wages (Gini Index) in Spain 1994-2004
Note: Working hours in the 1994 wave of ECHP are encoded in a different way to the rest of the years. Therefore, we can exclude them here and hereafter from the analysis for the year 1994.
Source: Authors´ analysis of ECHP (1994-2001) and SILC (2004).
One way to gauge with more precision the role of working hours in explaining wage distribution is to look at the distribution of working hours according to the different quintiles of hourly wage. As we can see in Table 2, through the whole period workers in the first quintile of hourly wages have longer working time. In fact, this quintile is the only one with hours well above the average. In this respect, low hourly wage workers show the highest weekly hours of work of all employees. This could be interpreted in terms of the existence of a strategy to compensate, at least partially, low hourly wages with longer hours. In any case, the dispersion of hours as shown by the standard deviation is lower in the last few years, as it is the relative difference between the average working time and the 1st quintile working time (down from 9 to 6% from 1994 to 2004). Finally, in this respect, it is worth mentioning that when we rank workers according to their gross wage, the first quintile shows lower and not higher working time (34.8 hours versus an average of 40.6). This result can be explained by the concentration of part-time work in this quintile.
Table 2: Working hours by hourly wage level in Spain 1995-2001 and 2004

Source: Authors’ analysis of ECHP (1994-2001) and SILC (2004).
In Figure 1 we have set the evolution of wage distribution throughout the period in the context of the evolution of the Spanish economy as reflected in the Gross Domestic Product (GDP) growth rate. As we can see, there is a slight negative correlation between the behaviour of the Gini Index of wage inequality and the growth rate of the economy, as on average years with higher GDP growth are related to lower Gini values, although the relationship is far from tight (the correlation coefficient of the whole period is -0.527). As in this period the evolution of employment in Spain mimicked the evolution of GDP, leaving no room for the improvement in productivity, the relationship between employment growth and wage dispersion is almost identical, i.e., the years with higher employment growth show a reduction in the level of wage inequality.5

Low pay in Spain
In the previous section we have seen how during the last decade Spain has witnessed an important growth in total employment, in a context of roughly constant wage dispersion and stagnation of productivity and wages. How have low paid workers fared in the same period?
In order to measure the incidence of low pay we have used a headcount index (LW 0) calculated as follows:

N denotes total employees and z is the low pay line. w i refers to the wage measure, which can be the (total or hourly) gross or net wage depending on cases. 1(.) is an indicator function that equals 1 if its argument is true and 0 otherwise. LW 0 is simply the fraction of employees with low wage.
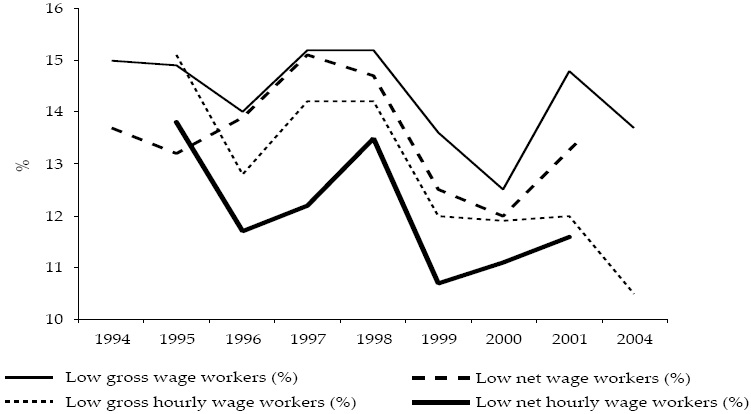
The computation of the level of low wage work using the ECHP denotes that the incidence of low pay in terms of gross wages has diminished from 1994-2004, especially in terms of hourly wages (Figure 2), with a percentage of low paid work in 2004 around 13.8% in terms of gross wage and 10.7% in terms of gross hourly wages.6 The proportion of low paid workers taking as reference net wages is lower and shows a more declining trend than taking account of before tax wages.
Source: Authors´ analysis of ECHP (1994-2001) and SILC (2004).
Figure 2: Low pay incidence in Spain 1994-2001 and 2004
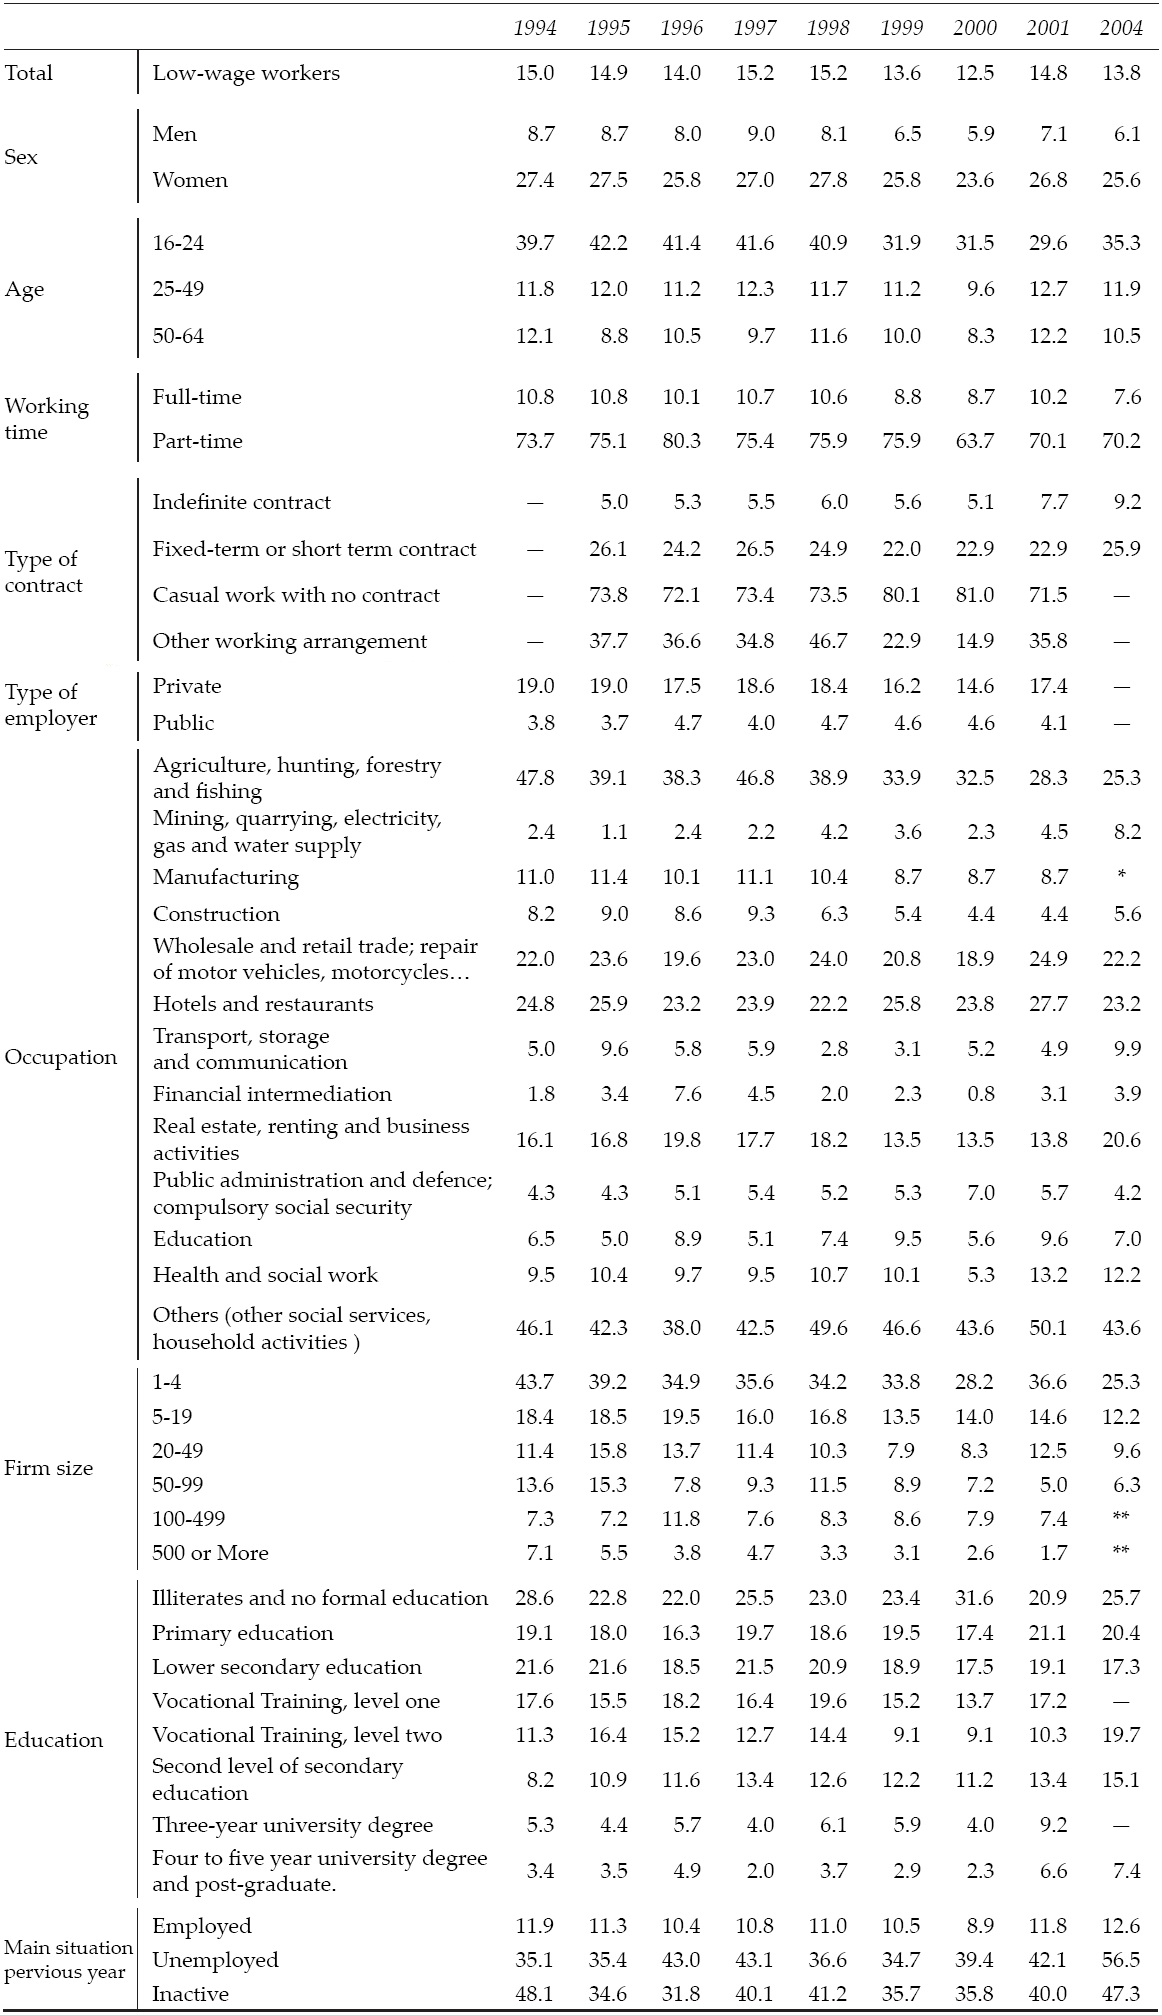
The incidence of low paid work is, nevertheless, very different among different groups of workers (Table 3). Firstly, the percentage of low wage female employment is more than three times higher than the equivalent among males, although the distance is narrower in terms of hourly wages, reflecting the much higher percentage of women in part-time employment, and therefore with a higher risk of holding low wage jobs. In fact, more than 2/3 of low part-time employees belong to this category of low wage workers. As expected, young workers and workers with temporary contracts also have a higher incidence of low wage work: as much as one third of the workers under 25 have low wage jobs and almost a quarter of temporary workers belong to this category. In the third place, the incidence of low pay is higher in the private sector than in the public administration. Fourthly, the proportion of low paid employees decreases with firm size. By occupation, low wage work is more abundant in agriculture and other related activities, real estate, renting and services to firms, retail and other social services, and hotels and restaurants. The low pay incidence in agriculture and other related activities shows a decreasing trend that could be related to the modernization of agriculture associated with the process of “deagriculturalization” of the economy (a reduction of 36% in the share of agriculture in total employment from 1994 to 2004). Regarding educational levels, the highest percentage of low wage work is among people with no education, and the lowest one among workers with a university degree, although it is interesting to notice that in the last two waves of the survey there was a surge of low wage work among this group of workers. Finally, the rate of low wage work of those employees who were either inactive or unemployed the previous year is four times higher than the rate of those who were already employed.
Table 3: Low-wage workers by occupational and individual characteristics in Spain (gross wages) 1994-2001 and 2004 (per cent)
Notes: * Included with Mining in 2004. ** The range for 2004 is 1-10, 11-19, 20-49, and 50 or more.
Source: Authors’ analysis of ECHP (1994-2001).
To conclude this analysis, we have conducted a probit regression in order to determine the impact of different characteristics of the worker, firm and sector of activity on the probability of having a low wage job (Table 4). This time the analysis was done in terms of hourly wage, to neutralize the effect of holding a part-time job on the probability of belonging to the group of low wage workers. In order to have a bigger sample, we pooled the data corresponding to the years 1995-2001, adding a dummy variable to identify each of the years included. As we can see, being a woman, having basic education, working in a small firm,7 with a casual working agreement (no contract), having been previously unemployed or inactive, and working in the retail trade, hotels and restaurants, transport and storage and other social services (including household activities) among other sectors, contributes positively to the probability of having a low remunerated job (low hourly wage). In contrast, working part-time, once we control for the rest of the factors, has a negative impact on the probability of low remuneration by hour.
Table 4: Marginal effects of different characteristics on the probability of being a low wage worker in Spain

* significant at 5%; ** significant at 1%.
Note: Education has been recoded in the following way: elementary education includes illiterate people and individuals with no formal education or primary education; basic education comprises lower secondary education or vocational training (level one); intermediate education refers to vocational training (level two) and upper secondary education; high educational level includes university education.
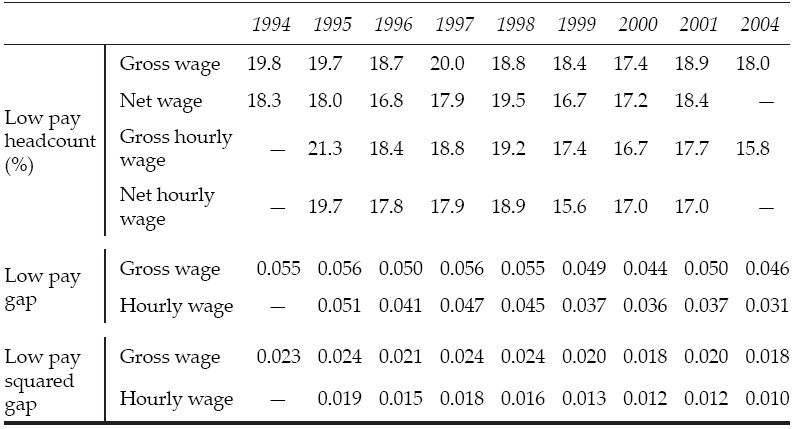
The percentage of low wage work, as in all headcount indexes, gives a concise and clear picture of the extension of this phenomenon in Spain, but it does not supply information about the intensity of the low wage, i.e., how low are low wages in relation to the low wage line. One possible way to capture this dimension of low wage intensity, widely used in other contexts, is to calculate the distance between the remuneration of low wage workers and the low wage threshold.8 In this way, we have a measure of the “low wage gap” (LW 1):

In the same way, with the purpose of giving information about the distribution of wages within the group of low wage employees -in other words, the severity of low pay- ,we can obtain a “squared low wage gap” (LW 2):
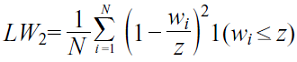
The calculations referred to the intensity and severity of low pay are shown in Figure 3 in terms of gross wages and gross hourly wages. As we can see, the low gross wage gap shows an important reduction in the period, going from 4.2 to 3.2% of the low wage line. The hourly wage gap, a more precise way of measuring the gap as it excludes the effect of low working hours, shows a similar trend, although the reduction is more intense: from 2.8 to 1.9%. The reduction in the value of the squared low pay gap from 1994 to 2004 shows that not only the low wage gap is lower at the end of the period, but wages of low wage workers are also closer to the low wage line.
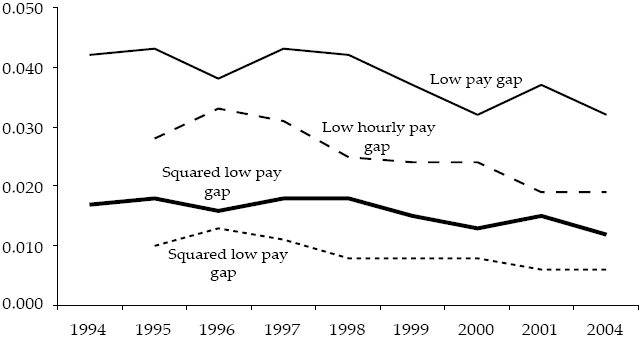
Source: Authors’analysis of ECHP (1994-2001) and SILC (2004).
Figure 3: Intensity and Severity of low pay in Spain (gross and gross hourly wages) 1994-2001 and 2004
Another interesting question in relation to low pay in Spain is its geographical distribution. Are low wages roughly equally distributed throughout the Spanish regions? Or alternatively, are low wages concentrated in some areas? We have seen that some sectors of economic activity are more prone to low wage work than others, so if regions differ in their economic structure, a different intensity in low wage work across the different regions of the country is to be expected. Table 5 shows the rate of low wage work in the 17 Spanish Autonomous Regions for 2004 and also includes the distribution of low wages across the different regions.
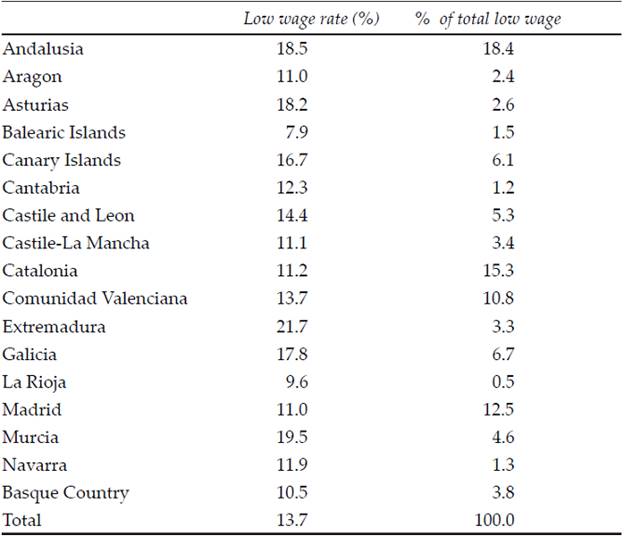
As we can see, there are important differences in low wage rates among the different Spanish regions, with the regional distribution of low wage rate closely following the relative pattern of economic development as shown by the per capita GDP (see Figure 4). All the regions with higher than average income per capita show a lower low wage rate, while the opposite is true for regions with lower income per capita, with the exception of Castile-La Mancha and Cantabria in 2004, which, having lower GDP per capita than average, also have a low pay rate below the national average.
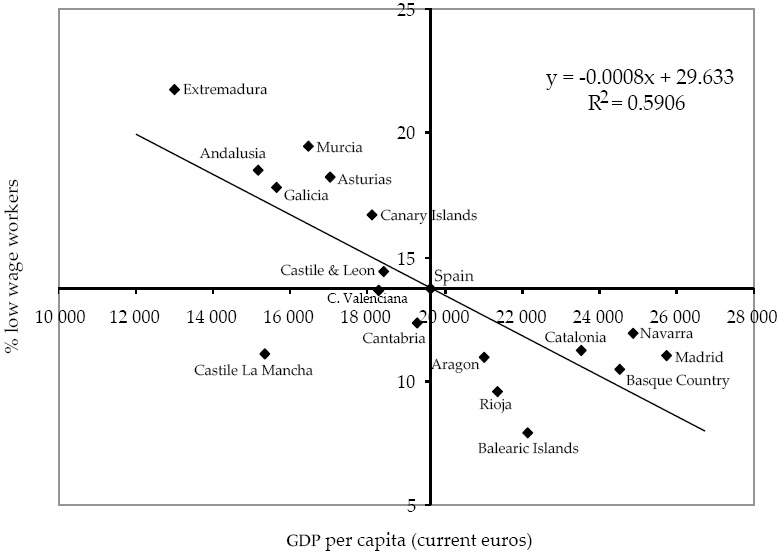
Source: Authors’ analysis from SILC (2004) and Regional National Accounts.
Figure 4: Low wage (%) and GDP per capita in Spanish Regions, 2004
The last question to address in this section is to what extent having a low wage job is a single episode suffered by workers, who in due time will be able to promote to non-low-wage jobs, or whether low wage workers are trapped in the lower segment of the labour market. One of the questions included in the ECHP, in which the workers are asked to compare their current and previous work, with four possible answers: much better, slightly better, similar and worse, offers a first approach to this issue. If low wage work was just a temporary situation, the proportion of low wage workers answering much worse (those coming from better jobs or downward flexibility) would be high and the proportion of low wage workers answering similar (those remaining in low age for more than a year) low. As we can see in Figure 5, the data does not confirm this hypothesis, as the most common answer, around 45%, is similar. At the same time, the percentage answering worse is very low -and decreasing-, pointing to the existence of very little downward flexibility.9

The overlap between low pay and poverty
Once we know the intensity and characteristics of low wage employment in Spain, the next step is to study the implications of having a low wage job in terms of poverty risk for the worker. Hereafter, all data referred to poverty involves the use of 60% of the national median equivalised income -using, as Eurostat, the OECD modified equivalence scale- as the poverty line.
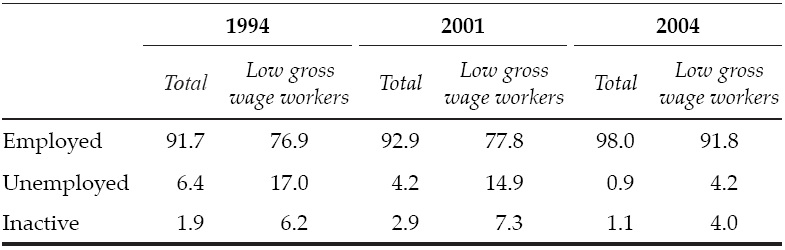
One possible strategy, followed by Marlier and Phontieaux (2000) of Eurostat, is to link the present economic status of the person interviewed to his/her economic situation in the previous year. Obviously, this option has two problems. First, economic status and income data belong to different periods, something that can lead to inconsistencies. Second, it is quite possible that a low paid worker in a given period had a different economic status the previous year (unemployed, self-employed, employed with a wage above the low wage threshold, etc.). In fact, as we can see in Table 6, an important percentage of current employees were either unemployed or inactive in previous years, especially in the group of low paid workers in 1994 and 2001. Therefore, the conclusions obtained from this type of analysis can suffer from important shortcomings.
Table 6: Most frequent status last year for current employees over 24 years old in Spain 1994,2001 and 2004
Source: Authors’ analysis of ECHP (1994-2001) and SILC (2004).
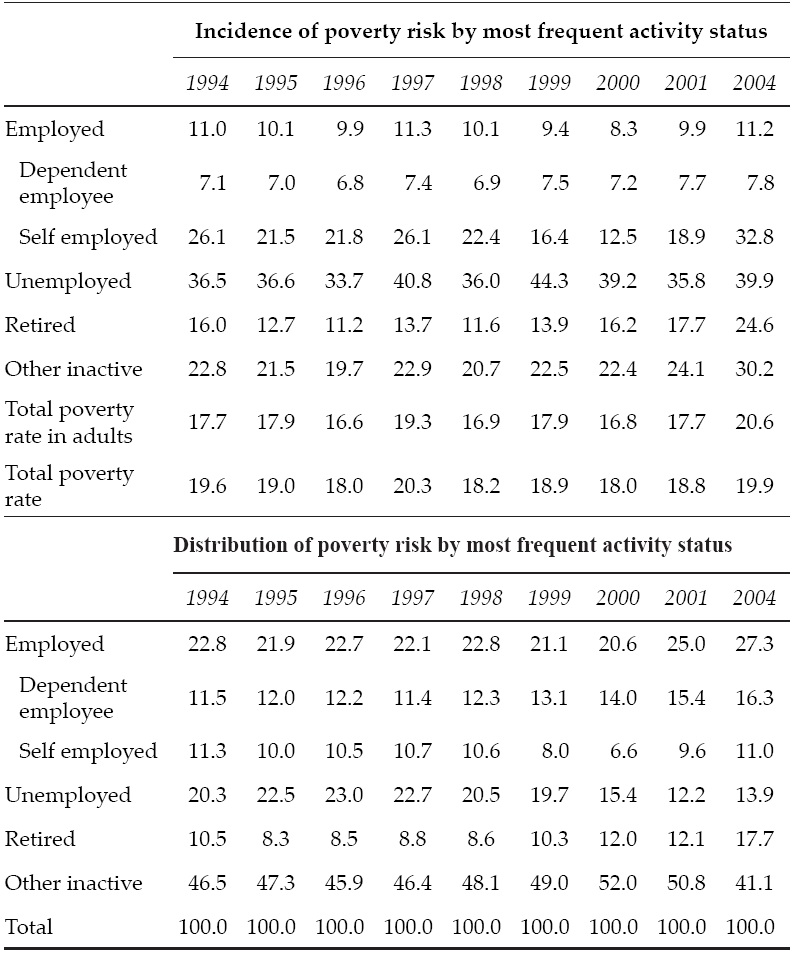
An alternative and preferable strategy from our point of view is to use contemporary data for income and economic status. In Table 7 we show the poverty rates according to the different most frequent activity as well as the distribution of population at poverty risk by most frequented economic status obtained using this approach. As we can see, in Spain employment is the most effective way of protection against the risk of poverty: the incidence of poverty risk among those employed is almost half the total incidence rate.10 It is interesting to note, however, that the lower percentage of the at-risk-of-poverty rate among workers in Spain is explained by the lower percentage existing among employees, as in the case of the self-employed the at-risk-of-poverty rate is similar to the average rate, pointing to the existence of a higher rate of low remuneration jobs among the self-employed.11
Table 7: Incidence and distribution of poverty by most frequent activity, Spain 1994-2001 and 2004
Source: Authors’ analysis of ECHP (1994-2001) and SILC (2004).
Nevertheless, as a group, workers make the second biggest category of those at poverty risk after the group of “other inactive persons” (all inactive persons minus the retired and unemployed). As we can see, in absolute terms, one quarter of the population at poverty risk is gainfully employed in the labour market. Thus, the traditional single case association between poverty and joblessness has to be revised.
We face a similar problem in deciding when to consider somebody below the poverty line as a low paid worker. Economic categories are quite often constructed by taking a binary world as reference: you are either working or not working, for example, but reality is much fuzzier: a person can work during certain days or weeks and remain unemployed others. If we want to associate the economic status of the person with his or her situation with to the poverty line, then we have to classify her as employed, low wage employed, unemployed or inactive. In order to solve this problem, we have followed the strategy of Nolan and Marx (1999) and limited our analysis of the overlapping of low wage and poverty to those workers who maintained their status as employees all year long.
As Figure 6 shows, limiting the sample to the above-mentioned workers has some impact on the rate of low wage rate as some workers who are unemployed or inactive through part of the year are excluded from the category. Focusing on the relation between employment, low wages and poverty in this subset of workers, the percentage of working poor during the period fluctuates around 5%, rising from 4.8 in 1994 to 5.8% in 2004. In this last year almost one third of the working poor had low wages as defined in this paper, and the rest were workers with wages over the low wage line but with household characteristics that pushed them under the poverty line. In this respect, there has been an important reduction in the percentage of working poor with low wages during the period. This reduction shows clearly in the evolution of the correlation coefficient between poverty and low wages: from 0.290 in 1994 to 0.179 in 2004. Finally, in 2004 almost 1/5 of low wage workers lived in poor households. The rest of the low wage workers lived in households with other sources of income (or otherwise lived alone) allowing the household unit to push itself over the poverty line.

Conclusions
The aim of this paper has been to study in a comprehensive way and with the most updated information available the evolution, characteristics and welfare implications of low wages in Spain from 1994 to 2004. From the analyses performed here the following conclusions can be highlighted:
Gross wage distribution of total employees has remained roughly constant. The behaviour is basically the same in terms of hourly wages.
The proportion of low paid workers in terms of gross wages has remained roughly constant from 1994 to 2004, fluctuating between a minimum of 12.5% in 1999 and a maximum of 15.2% in 1997. The computation of the level of low pay using net wages and hourly wages leads to a similar conclusion. Thus, it seems the high growth of employment experienced by the Spanish economy has not been driven by an increase in low paid work. In fact, there has been a reduction in the intensity and severity of low pay along the analysed period.
Being a woman, with basic education, working in a small firm, with a casual working agreement (no contract), previously unemployed or inactive, and working in the retail trade, hotels and restaurants, transport and storage and other social services (including households activities) among other sectors, contributes positively to the probability of having a low remuneration job (low hourly wage).
Employment is the most effective way of protection against the risk of poverty: the incidence of poverty risk among those employed is almost half the total incidence rate. In addition, according to our results, the relation between low pay and poverty has weakened along the period 1994-2004.
How these results should be interpreted? Considering the gargantuan increase in employment experienced by the Spanish economy in the last decade, one can wonder how it is that such an increase in labour demand has done so little in improving low pay (that is, in reducing the proportion of low paid workers). In this respect, it is important to keep in mind that low wage has been measured using a relative threshold, which means that the wage of low paid employees can grow without an improvement in the low wage rate. The evolution of the low wage rate is closely related to earnings inequality, making the results more difficult to interpret. Nevertheless, several trends of the Spanish economy could explain the small improvement accomplished. A first candidate is the concentration of employment creation in sectors with low productivity, low wages and high earnings dispersion (Muñoz de Bustillo, 2007). A second candidate is the huge increase in immigration experienced in the same period. In 1994 there were less than half a million immigrants in Spain, most of them from other European Union member countries; ten years later immigration rate had jumped from 1.4 to7 % (more than 3 million people), mostly from less developed countries. Such increase in labour supply, concentrated mostly in low productivity sectors (construction, hotels and restaurants, domestic service and others), most probably has also exerted a downwards pressure on low wages in a context of high growth creation. Last, the recuperation in employment in Spain has profited from a policy of wage moderation backed by the two major Spanish Trade Unions. This context of very moderate wage increase has probably affected with more intensity those sectors with lower relative wages, often sectors with low trade union penetration.12
From a different perspective, this huge employment creation in the context of stable wage dispersion questions the existence of a “trade-off ” between earnings dispersion and employment creation alleged by mainstream neoclassical labour market analysis.13 In this respect, the Spanish case shows that further wage inequality is not a requirement for employment growth (Howell, 2005).