


 nueva página del texto (beta)
 Inglés (pdf)
 Artículo en XML
 Referencias del artículo
 Enviar artículo por email
 Citado por SciELO
  Similares en
SciELO
Similares en
SciELO 
 Permalink
1. INTRODUCTION
The physics of the so-called narrow-line region of active galactic nuclei (AGN) has been amply studied (cf. Osterbrock 1978, and references therein). AGN emission line spectra can be divided into two categories1: TypeI when the full width half-maximum (FWHM) of the permitted lines are significantly larger than the forbidden lines, and TypeII where both the permitted and forbidden lines have similar FWHM. The broad-line region (BLR) observed in TypeI objects originates from high density gas (> 108 cm−3) much closer to the black-hole (BH) than the narrow-line region (hereafter NLR), the latter being observed in both TypeI and II objects. The AGN unified model sustains that both types relate to the same phenomenon, with the differences being the visibility of the central engine. It proposes that the BLR is hidden from direct view in TypeII due to an optically thick dusty torus-like gas structure surrounding the central engine (black hole, accretion disk, and BLR) (Antonucci 1993). Whether the BLR is observed or not depends on the viewing angle of the nucleus. Seyfert2’s, QSO2’s and narrow line radio galaxies (NLRG) are classified as TypeII while Seyfert1’s, quasars, QSO1’s and broad-line radio galaxies (BLRG) are of TypeI because their BLR is visible.
While it is customary to assume for Hii regions the low density regime (hereafter LDR) when evaluating the plasma temperature using the [OIII[ λ4363Å/λ5007Å line ratio (hereafter labeled R OIII), this is inappropriate for the NLR, at least in TypeI objects. Osterbrock (1978) interpreted the relative strength of the λ4363Å line, which was measured to be higher in Seyfert1’s and BLRG than in Seyfert2’s, as evidence of densities in the range 106−107 cm−3 within the NLR of TypeI AGN. This interpretation was confirmed by the study of Baskin & Laor (2005, hereafter BL05) who compared the R OIII they measured in 30 quasars. Their singledensity calculations showed that the broad range of observed R OIII ratios implies high plasma densities, ranging from possibly 105 up to 107 cm−3, providing convincing evidence of the important role of collisional deexcitation in TypeI AGN, where the temperature cannot be directly inferred from the R OIII ratio. In the case of TypeII objects (Seyfert2’s and NLRG), the R OIII ratio is on average smaller (< ∼ 0.019) although selection effects may possibly bias such an assessment. Prevailing NLR photoionization models consider a distribution of clouds that extends over a wide range of values of densities and ionization parameter, whether the targets are TypeI (Baldwin et al. 1995; Korista et al. 1997) or TypeII objects (Ferguson et al. 1997; Richardson et al. 2014). With respect to the spatially resolved emission line component of AGN, the so-called extended NLR (hereafter ENLR), it consists of off-nuclear line emission from plasma at typically LDR densities (e.g. Tadhunter et al. 1994; Bennert et al. 2006a,b) where the R OIII ratio should provide a reliable temperature measurement.
The original element of the current work is the use of the weak [ArIV] λλ4711,40Å doublet to evaluate to what extent the R OIII measurements of our selected Seyfert2 sample is affected by collisional deexcitation. To cover the multi-density case, we developed an algorithm, OSALD, to calculate density and temperature line ratio diagnostics appropriate to isothermal plasmas in which the density follows a power law distribution rather than taking on a single value. This algorithm offers the option of including a foreground dust extinction component whose opacity, rather than being uniform, correlates with the emission plasma density. Our main conclusion is that (at least for the subset of TypeII objects where the [ArIV] doublet is observed) there is no evidence of significant collisional deexcitation. Hence, in those cases the R OIII ratio constitutes a direct temperature indicator. Oddly, LDR photoionization calculations result in temperature discrepancies with the observations, underscoring the so-called temperature problem (Storchi-Bergmann et al. 1996; Bennert et al. 2006a; Villar-Martín et al. 2008; Dors et al. 2015, 2020). In a follow-up paper, we evaluate different physical processes to address this issue.
Our reference sample is described in §2 and a comparison with single-component photoionization models is presented in §3. A modified interpretation of the NLR R OIII ratios observed near ' 0.017 in TypeII and some TypeI AGN is proposed in §4. These are subsequently compared with calculations made with the algorithm OSALD (§5), which considers a power law density distribution.
2. REFERENCE DATA SET OF R OIII RATIOS IN AGN
In what follows, the term NLR will be used exclusively in reference to the spatially unresolved nuclear component. For any line emission that originates beyond the spatially unresolved central component2 of the active nucleus, it will be referred as ENLR3 in all cases where the gas is deemed photoionized by the AGN rather than by hot stars.
In order to evaluate the impact of collisional deexcitation on the [OIII] emission lines among TypeI and II AGN, our data set consists primarily of the quasar sample of BL05 (excluding upper limits data), to which we added the four narrow-line Seyfert1 studied by Rodríguez-Ardila et al. (2000a, hereafter RA00) which were originally observed by Rodríguez-Ardila et al. (2000b). To have access to measurements of the λλ4711,40Å doublet, we relied on the Seyfert2 sample of Koski (1978, hereafter Kos78). Finally, to ensure that our sample covers cases where the emission plasma is negligibly affected by collisional deexcitation, we included diverse ENLR observations from the literature. Figure1 describes the behaviour of the dereddened [OIII]/Hβ (λ5007Å/λ4861Å) and R OIII (λ4363Å/λ5007Å) line ratios of our AGN sample.
2.1. Detailed Description of the Dereddened R OIII Data Set
The data set was extracted from the following sources:
A- NLR of TypeI AGN
(a) Based on the prominent work of BL05, the sample consists of 30 TypeI quasars with z < 0.5, mostly from the bright quasar survey of Boroson & Green (1992). Objects where only upper limits of [OIII]λ4363Å were reported have been excluded. The sample is represented by bluish open squares in Figure1. The authors used the [OIII]λ5007Å profile of each object as template for extracting the NLR Hβ and [OIII]λ4363Å line fluxes. Since the latter line is weak, its measurement required a proper subtraction of the underlying FeII emission multiplets. BL05 used the IZw1 Feii template provided by T. Boroson (private communication) to subtract the FeII multiplets. All the line fluxes were corrected for dust reddening and possible slit losses.
(b) The measurements of the four narrowline Seyfert1 nuclei (hereafter NLS1) from RA00 (yellowish open triangles) were annexed. As detailed in their study, the authors used their own spectrum of IZw1 to subtract the various Feii underlying features present in their NLS1 spectra. They compared different ways to extract the Hβ NLR contribution, favouring in the end the procedure of fitting a narrow and broad Gaussian component to the Hβ profiles. The broad to narrow Hβ flux ratios in these objects cover the range of 1.8 to 3.4.
(c)For comparison purposes, we included the measurements of two well-studied Seyfert1.5 galaxies (light-green open stars): NGC5548 (Kraemer et al. 1998a) and NGC72134 (Filippenko & Halpern 1984).
B- NLR of TypeII AGN
(a) To characterize the behaviour of high excitation TypeII objects, we adopt the pioneering work on Seyfert2’s by Koski (1978, hereafter Kos78), which provides the unique characteristic of reporting reliable measurements of the weak [ArIV] λλ4711,40Å doublet ratio, an essential density indicator for evaluating in §4.2 and §5.2 to what extent the observed R OIII is affected by collisional deexcitation. Table 1 lists the reddening corrected ratios of the high excitation subset of their sample (i.e. with [OIII]/Hβ ≥ 10), which consists of seven Seyfert2’s. Two objects, Mrk348 and 3C33, were left out of Table 1 since their measurement of the [ArIV] ratio unrealistically exceeded the low density limit value. They presumably indicate emission from LDR plasma. The average R OIII ratio from Table 1 is 0.0168 (i.e. 10 −1.77 in Figure1), which is represented by a large black disk whose radius of 0.088dex corresponds to the R OIII RMS dispersion. The average [OIII]/Hβ is 12.3 ± 1.1.
(b) As a complement to TypeII objects, we averaged the measurements of the four Seyfert2’s IC5063, NGC7212, NGC3281 and NGC1386 observed by Bennert et al. (2006b, hereafter Be06b). It is represented by a small black circle corresponding to a mean R OIII of 0.0188. Pseudo error bars represent the RMS dispersion of 0.042dex.
(c) The black diamond labelled a41 with R OIII = 0.0155 represents the high ionization end of the sequence of reconstructed spectra of Richardson et al. (2014, hereafter Ri14) which was extracted from a sample of 379 AGN. These were identified by applying the Mean Field Independent Component Analysis (MFICA) tool to their Sloan Digital Sky Survey (SDSS) sample of ≈ 104 emission line galaxies in the redshift range 0.10 < z < 0.12 (see also Allen et al. 2013). They meticulously reviewed each spectrum to ensure that no BLR component was present.
(d) Ground-based observations of the Seyfert2 NGC1068 nucleus by Kos78 is represented by the black open octagon while the black open triangle corresponds to the HSTFOS measurement of the nucleus at a much higher spatial resolution of
C- Spatially resolved ENLR emission
(a) The red filled dot stands for the average ratio from the ENLR of four TypeII AGN (two are Seyfert2’s: ESO362-G08 and MRK573, and two are NLRGs: Pks0349−27 and Pks0634−20) which were studied by Storchi-Bergmann et al. (1996, hereafter SB96). The mean R OIII ratio is 0.0169 ± 0.0029, which includes measurements on both sides of the nucleus, except for ESO362-G08 (Binette et al. 1996, hereafter BWS). Pseudo-error bars denote an RMS dispersion of 0.07dex.
(b) The Seyfert2 IC5063. The red pentagon represents the average ratio R OIII = 0.0188 (with dispersion of 0.042dex) from the extranuclear radial emission of the Seyfert2 IC5063 which Be06b observed with a S/N > 3 from
(c) The CentaurusA (NGC5128) filaments. The red square represents the average ratio of seven optical filaments studied by Morganti et al. (1991, hereafter Mo91) and situated along the radio jet at a mean distance of 490pc from the nucleus of the radio-galaxy CentaurusA (mean R OIII = 0.0145 with a dispersion of 0.13dex).
(d) Detached cloud emission aligned with radio-galaxy jets. The large red dot represents the well studied 8kpc distant cloud associated to the nucleus of radiogalaxy Pks2152−699 (Tadhunter et al. 1987, hereafter Ta87).
(e) Two detached emission line ‘knots’ of NGC1068 labelled 1 and 2 (red triangles) which were studied by Kr98 using HSTFOS archive data. The positions are off and centered from the nucleus by
TABLE 1 REDDENING-CORRECTED SEYFERT2 RATIOS FROM KOSKI (1978)
| (1) Index # |
(2)a Seyfert 2 |
(3) [OIII]/Hβ |
(4) ROIII |
(5) [ArVI]+ |
(6) RHo/Ar |
(7)b
|
(8)c nsng cm-3 |
(9)d oK |
| 1 | Mrk 573 | 12.12 | 0.0149 | 1.167 | 1.52 | 0.039 | 1.85 × 10³ | 13 360 |
| 2 | Mrk 34 | 11.46 | 0.0131 | 1.203 | 2.03 | 0.051 | 1.64 × 10³ | 12 720 |
| 3 | Mrk 78 | 11.94 | 0.0117 | 1.267 | 2.22 | 0.053 | 1.14 × 10³ | 12 210 |
| 4 | Mrk 176 | 14.36 | 0.0223 | 1.045 | 0.45 | 0.013 | 2.84 × 10³ | 15 940 |
| 5 | Mrk 3 | 12.67 | 0.0189 | 0.837 | 1.95 | 0.072 | 7.21 × 10³ | 14 670 |
| 6 | Mrk 1 | 10.95 | 0.0192 | 0.825 | 1.59 | 0.059 | 7.25 × 10³ | 14 760 |
| 7 | NGC 1068 | 12.42 | 0.0177 | 0.790 | 2.42 | 0.097 | 8.77 × 10³ | 14 210 |
aThe line ratios from the 7 Seyfert 2's were reddening corrected by Koski (1978) using the observed Balmer decrement.
The measurement uncertainties were estimated at ±10% for the strong line uxes and ±20% for the weak lines.
bThe inferred fractional contribution of He I λ4713Å to the blended λ4711Å+ line.
cThe densities nsng were determined using the deblended λ4711Å/λ4740Å doublet ratio.
dThe temperature

Fig. 1 AGN dereddened line ratios of [OIII]/Hβ vs. R OIII from: A- TypeI AGN with measurements of (1) 30 quasars studied by BL05 (bluish open squares), (2) four narrow-line Seyfert1 galaxies from RA00 (yellowish open triangles), (3) two Seyfert1.5, NGC5548 and NGC7213 (open stars), B-TypeII AGN represented by open black symbols consisting of (1) the average of seven Seyfert2’s from Kos78 (large circle), (2) the average of four Seyfert2’s from Be06b (small circle), (3) the high excitation Seyfert2 subset a41 from Ri14 (diamond), (4) the nucleus of NGC1068 through groundbased observations by Kos78 (black hexagon) and HST-FOS observations analysed by Kr98 (black open triangle), and C- ENLR measurements (all as red filled symbols) consisting of (1) the average from BWS of two Seyfert2’s and two NLRGs (red dot), (2) the long-slit observations of the Seyfert2 IC5063 by Be06b (pentagon), (3) the average of seven spatially resolved optical filaments from the radio-galaxy CentaurusA (red square) by Mo91, (4) the 8kpc distant cloud from radiogalaxy Pks2152−699 by Ta87 (large dot), and (5) the HST-FOS measurements of two ENLR knots from NGC1068 (red triangles). The colour figure can be viewed online.
3. PHOTOIONIZATION CALCULATIONS AT LDR DENSITIES
All our calculations will be presented in Figure 3 in which the reference data set is represented using the same symbols but coloured in gray. For an isothermal plasma at a fixed temperature, densities much above LDR would cause an increase of the R OIII ratio, shifting its position to the right in Figure 3 due to collisional deexcitation. The segmented cyan arrow describes the increase in R OIII expected from a 14000°K plasma slab whose density successively takes on the values of 102 (LDR), 10 4.5 , 105, 10 5.5 , 106 and 10 6.5 cm−3. It illustrates the density range implied by the BL05 and RA00 TypeI AGN if they shared the same temperature. For a 15000°K plasma, the critical densities5 for deexcitation of the [OIII] λ5007Å and λ4363Å lines are 7.8 × 10⁵ and 2.9×107 cm−3, respectively, while for the[ArIV] λ4711Å and λ4740Å lines these are 1.7 × 10⁴ and 1.5 × 105 cm−3. Let us compare the data with the values predicted by photoionization calculations.
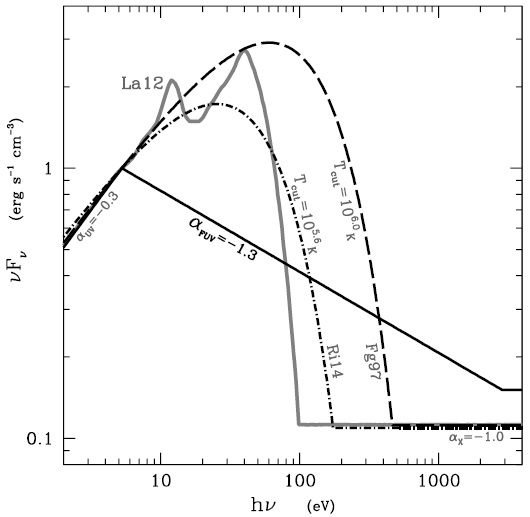
Fig. 2 The four SEDs described in §3 and adopted in our LDR single-component photoionization models of Figure 3: (1) the SED assumed by Ri14 with T cut = 10 5.62 °K in their LOC model calculations (dot-dashed line), (2) a similar SED but with a higher T cut of 10 6.0 °K as explored by Fg97 (long dashed-line), (3) a power law SED with α FUV = −1.3 adopted by BWS (black continuous line), (4) the double bump thermal SED proposed by La12 (thick gray line). Each SED is expressed in νF ν units and normalized to unity at 5eV (2000˚A). In the X-rays, they all convert into a power law of index −1.0.

Fig. 3 Same data set from Figure1 except that it now includes the Seyfert1 NGC4151 (c.f. §5.2.3) instead of NGC1068. The gray open symbols correspond to the NLR from TypeI objects, black symbols to TypeII and gray filled symbols to ENLR measurements. Four sequences of LDR photoionization models are shown (solid lines) along which the ionization parameter Uo increases in steps of 0.5dex, from 0.01 (light gray dot) up to 0.46. Some models fall outside the figure limits. The sequences are labelled according to the SED defined in §3.2: (A) Fg97 (magenta), (B) Ri14 (light green), (C) BWS (dark green) and (D) La12 (blue). The models are all ionization bounded, dustfree, isochoric with
3.1. Above Solar Gas Metallicities
The abundances we adopt correspond to 2.5Z ʘ, a value within the range appropriate to galactic nuclei of spiral galaxies. For instance, the landmark study by Dopita et al. (2014) of multiple HII regions of the Seyfert2 NGC5427 favour abundances significantly above solar. Using the Wide Field Spectrograph (WiFeS: Dopita et al. 2010), the authors could determine the ISM oxygen radial abundances using 38 HII regions spread between 2 and 13kpc from the nucleus. Using their inferred metallicities, they subsequently modelled the line ratios of over 100 ‘composite’ ENLR-HII region emission line spaxels, as well as the line ratios from the central NLR. Their highest oxygen abundance reaches 3 Z ⊙(i.e. 12 + log(O/H = 9.16). Such a high value is shared by other observational and theoretical studies that confirm the high metallicities of Seyfert nuclei (Storchi-Bergmann & Pastoriza 1990; Nagao et al. 2002; Ballero et al. 2008). Our abundance set relative to H corresponds to twice the solar values of Asplund et al. (2006) except for C/H and N/H, which are set at four times the solar values owing to secondary enrichment, resulting in a gas metallicity of Z tot=2.47Z ⊙ by mass. For the He/H abundance ratio, we assume the solar value of 0.085.
3.2. Four Alternative Ionizing Energy Distributions
The four spectral energy distributions (hereafter SED) selected are shown in Figure 2. They are representative of published work concerning AGN photoionization models and can be described as follows:
-
A: the long dashed-line represents the SED used by Ferguson et al. (1997, hereafter Fg97) in their calculations of local optimally emitting cloud (LOC) models for the NLR. It is characterized by a thermal bump of the form
with α UV = −0.3 and T cut = 10 6.0 °K.
B: the dot-dashed line represents the ‘optimized SED’ used by Richardson et al. (2014, hereafter Ri14) in their calculations of LOC models. It shares the same index α UV as the Fg97 SED above, but assumes a lower T cut of 10 5.52 °K to describe the thermal bump. It is significantly softer than the Fg97 SED, yet due to collisional deexcitation being important in LOC models, these qualitatively reproduces the R OIII and Heii/Hβ (λ4686Å/λ4861Å) ratios of their reconstructed Seyfert2 emission line spectra.
C: a power law of index α FUV = −1.3 in the far-UV domain (continuous black line) which was used by Binette et al. (1996, hereafter BWS) and Binette et al. (1997) in their matterbounded cloud calculations.
D: the thick continuous gray line represents the sum of two distinct thermal bumps as proposed by Lawrence (2012, hereafter La12) who postulated that the accretion is entirely covered by intervening thick BLR clouds, which would absorb Lyα as well as the softer ionizing radiation, thereby accounting for the observed UV steepening short-ward of 1050Å. The author proposed that the absorbed EUV energy is reprocessed into emission at much shorter wavelengths, which generates the second peak near 40eV.
Each SED converts in the X-rays into a power law F ν ∝ ν −1 and results in an α OX index6 of −1.35 except the BWS SED (α OX = −1.30).
3.3. Isochoric Single-Component Photoionization Calculations
Sequences of photoionization models are shown in Figure 3 corresponding to the four SEDs of Figure 2. LDR was assumed as it is the appropriate density regime for the ENLR plasma and for at least a significant subset of the AGN sample, as argued in §4. They were calculated using the most recent7 version Ig of the code mappings i (Binette et al. 2012) All models share the same density of
If we define the photoheating efficiency of each SED as the temperature of the plasma averaged over the region occupied by the O+2 ion, we obtain for the Uo = 0.1 model the following values of 11300, 9700, 8400 and 8320°K, assuming the SED which we labelled BWS, Fg97, La12 and Ri14, respectively (Figure 3). The BWS SED possesses the highest efficiency but it is more speculative as it excludes the possibility of thermal dump (or peak) in the far-UV. Such a feature is to be expected if the continuum originates from an accretion disk, which is widely accepted as being the primary mode of energy generation in AGN. The double-peak reprocessed SED of La12 presents the advantage of accounting for the ‘universal’ knee observed at 10eV. The position of the second peak at 40eV, however, would need to be shifted to higher energies in order to increase the photoheating efficiency.
It is currently not possible to determine which abundances are the most appropriate to the environment of active nuclei although it is generally accepted that metallicities above solar are most likely. If one assume the more conservative metallicity of 1.5Z ⊙ of Fg97 and Ri14, a shift towards the right takes place, as shown by the dotted line arrows in Figure 3, assuming an ionization parameter of Uo = 0.1.
What is the origin of the gap between the photoionization models and AGN observations? The positions of models on the left of Figure 3 correspond to LDR conditions. It is a justified option for the ENLR, as argued in AppendixA. As shown by BL05 as well as by the density sequence using the BWS SED in Figure 3 (gray dotted line), all models can be shifted towards higher R OIII values by assuming plasma densities much above 10 4.3 cm−3. This is the main reason why direct measurements of the density governing the [OIII] lines are so important if we wish to determine the NLR temperature. Measurements of the weak [ArIV] doublet can give us access to this information, as explored below.
4. MIGHT THE AGN BUILDUP NEAR R OIII ≃ 0.018 REPRESENT A FLOOR TEMPERATURE?
The work of BL05 presented convincing evidence that the quasars (open squares) with R OIII reaching ≈ 0.2 are the manifestation of collisional deexcitation from high density plasma. Their singledensity photoionization calculations suggest densities of ≃ 10 6.5 cm−3. Interestingly, the four quasars on the extreme left appear to clump at R OIII = 0.0195 with [OIII]/Hβ ≃ 10.5 in Figure 3. At this position, single-density photoionization calculations from BL05 suggest densities near 10 5.2 cm−3. If we consider an isothermal 14000°K plasma (c.f. cyan arrow), the density we infer is very close to LDR, at 10 3.3 cm−3. Our initial analysis of R OIII among Seyfert2 galaxies indicated that these show R OIII values similar to the leftmost quasars, which made us question whether collisional deexcitation is related to their position in Figure 3. Our analysis of the NLR data of Seyfert2 galaxies, however, lead us to question whether collisional deexcitation is related to the position of these quasars on the left. It is noteworthy that, for instance, a similar position is occupied by: (1) the sample of four Seyfert2 nuclei of Be06b (dark-green dot), (2) the reconstructed Seyfert2 subset a41 from Ri14 (black diamond) which is based on an ample sample of SDSS spectra, and (3) the seven high excitation Seyfert2’s of Kos78, as shown by the black disk, which represents the average R OIII. We would argue that the accumulation of AGN on the left is most likely representing a floor AGN temperature where collisional deexcitation is not significant. To support our hypothesis, we will make use in §4.2 of the density indicator provided by the λ4711Å/λ4740Å doublet ratios of Kos78.
4.1. Why do ENLR Observations Coincide with the Leftmost NLR R OIII Observations?
Because ENLR emission operates in the low density regime (c.f. AppendixA), it provides ideal measurements to compare TypeII objects with. In Figure 1, we added the following spatially resolved ENLR emission measurements: (1) the CenA filaments (red square, Mo91), (2) the average ENLR ratios of four TypeII AGN (red dot, BWS), (3) the radial ENLR emission from the Seyfert2 IC5063 (red pentagon: Be06b), and (4) the ionized cloud 8kpc distant from of Pks2152-69 (large red dot, Tadhunter et al. 1987). All gather relatively close to the leftmost TypeI quasars (open squares) as well as to the mean Seyfert2 ratio of the Kos78 study (large black circle). Interestingly, the Seyfert2 reconstructed subset a41 (black diamond) of Ri14 occupies a similar position. The simplest interpretation would be that collisional deexcitation is not significant, not only within the spatially resolved ENLR but among the leftmost objects as well, and that they all share a similar electronic temperature.
4.2. Combination of the [ArIV] and [O III ] Diagnostics
To evaluate the NLR density, we will rely on the observations of Kos78 who measured the weak [ArIV] λλ4711,40Å doublet of his Seyfert2 sample, an unusual feature among AGN surveys. The observations were carried out with the image-dissectorscanner mounted on the 3m Shane telescope at the Lick Observatory. The integration times were typically 32min (A. T. Koski, PhD thesis 1976). In Columns(3-4) of Table 1, we present the reddeningcorrected line ratios of [OIII]/Hβ and R
OIII. In the context of high excitation planetary nebulae, Kewley et al. (2019) pointed out that the [ArIV] and [OIII] emission regions significantly overlap and that their respective ratios can be considered representative of the high excitation plasma. A concern, however, is that the weak HeIλ4713Å line lies very close to the [ArIV] λ4711Å line. Given the much wider profiles of the NLR lines in comparison to planetary nebulae, both lines will overlap. Hence the need to apply a deblending correction. The procedure we adopted for the single-density case is described in AppendixB.1. It essentially makes use of the dereddened Heiλ5876Å line (Column6) to calculate a reliable estimate of the contribution of the HeIλ4713Å line to the blended9 [ArIV]+ λ4711Å+/λ4740Å doublet ratio (Column5). The estimated fractional contribution of the blended HeI line to [ArIV]+ is
4.3. Density Bias due to a Limited Spatial Resolution
In TypeI AGN, due to the favorable orientation of the observer with respect to the ionizing cone (Antonucci 1993), the densest NLR components are visible and possibly dominate the integrated line flux, causing the R OIII ratios to occupy values up to 0.2 due to collisional deexcitation, as proposed by BL05.
In TypeII AGN on the other hand, since the inner regions occupied by the accretion disk and the BLR are not visible, important selection effects take place. The NLR is likely not fully observed due to obscuration associated to the ionizing cone. Differences in spatial resolution as a result of the object distance and the size of the spectrograph aperture inevitably affect the sampling of the NLR volume. The angular resolutions characterising our Seyfert2 sample are the following. The reconstructed NLR spectrum of Ri14 was based on SDSS observations of Seyfert2’s of similar redshifts (0.10 - 0.12) with a fiber aperture size of
Unlike the BL05 quasar sample where collisional deexcitation is the evident cause of the wide spread of R
OIII values, the NLR of Seyfert 2’s appears relatively unaffected by deexcitation, at least among ground-based observations. The much superior resolution from HST observations, however, reveals the presence of much denser components within the inner nucleus. A case in point are the HST-FOS observations of NGC1068 (Kr98) with an angular resolution from of
5. MULTI-DENSITY TEMPERATURE ANDDENSITY DIAGNOSTICS
We expanded the functionality of the R OIII temperature diagnostic by combining the latter with the [ArIV] density indicator, allowing us to evaluate the impact of collisional deexcitation among the observed R OIII ratios. To this effect, we developed the algorithm OSALD (see AppendixC for further information), which integrates the line emissivities from an isothermal plasma that extends over a wide density range, up to a cut-off density, n cut. At a given temperature, if n cut has a high value, the integrated R OIII ratio rises above the LDR value. Since our diagnostics depends on measurements of the [ArIV] doublet, we are limited to the Kos78 sample of Table 1.
We have explored two options concerning the nature of the density cut-off: (1) that it simply consists of a sharp cut-off, or (2) corresponds to a gradual cut-off due to a foreground dust extinction layer whose opacity correlates with plasma density. The calculations assuming the first option are summarised in AppendixE and result in essentially the same temperatures as derived from the single density case explored in §4.2. We will now consider the second option, where we explore the possibility that the NLR emission becomes gradually more absorbed towards the nucleus.
5.1. Components of the Dust Screen Approach with OSALD
One particularity of our proposed approach is that it implies fitting the observed R OIII ratios presented in Table 2 rather than the dereddened ratios of Table 1 and Figure 1.
TABLE 2 OSALD PARAMETER FIT OF OBSERVED LINE RATIOSa
| Objects | Target line ratios | Blending corrections | Parameter values | |||||||
| (1) Index # |
(2) AGN |
(3) Hα/Hβ |
(4) ROIII |
(5) [ArIV] |
(6) RHe/Ar |
(7) |
(8) [ArIV] |
(9) |
(10) nopa cm−3 |
(11)b TOIII °K |
| 1 | Mrk 573 | 3.62 | 0.0119 | 1.156 | 2.03 | 0.044 | 1.108 | 0.16 | 1.56 × 10³ | 12 760 |
| 2 | Mrk 34 | 4.10 | 0.0110 | 1.193 | 2.46 | 0.047 | 1.140 | 0.41 | 1.85 × 10³ | 12 660 |
| 3 | Mrk 78 | 5.31 | 0.0075 | 1.238 | 4.05 | 0.062 | 1.166 | 1.10 | 2.48 × 10³ | 11 510 |
| 4 | Mrk 176 | 6.55 | 0.0139 | 1.045 | 0.90 | 0.013 | 1.031 | 1.74 | 6.54 × 10³ | 15 210 |
| 5 | Mrk 3 | 5.31 | 0.0141 | 0.850 | 3.00 | 0.068 | 0.796 | 1.08 | 1.37 × 10⁴ | 14 560 |
| 6 | Mrk 1 | 5.00 | 0.0136 | 0.814 | 2.71 | 0.067 | 0.762 | 0.91 | 1.40 × 10⁴ | 14 150 |
| 7 | NGC 1068 | 4.47 | 0.0129 | 0.763 | 3.56 | 0.106 | 0.690 | 0.61 | 1.49 × 10⁴ | 13 500 |
a The line ratios were not corrected for reddening. A foreground dust screen was assumed instead whose opacity increases exponentially:
bThe averaged temperature for the sample is 〈TOIII〉 = 13480 ± 1180°K.
5.1.1. A Density Cut-Off Generated by a Dust Extinction Gradient
The dust opacity is described by an exponential function of density
5.1.2. Extinction Curve and Line Transfer Algorithm
The line transfer algorithm implemented in osald fully takes into account the effect of multiple scattering across the foreground dust layers. Its characteristics are described in AppendixC of Binette et al. (1993). As for the extinction curve, we adopt the one inferred by Martin & Rouleau (1991) in their study of the Orion nebula, which differs from the standard ISM curve in that grains of size smaller than 0.05µm are absent, resulting in a flatter curve with less extinction in the UV (Baldwin et al. 1991; Magris C. et al. 1993). It is qualitatively in line with the evidence presented by Maiolino et al. (2001a,b) that small grains are depleted in the dusty medium which is responsible for the absorption of the X-rays and the reddening of the BLR lines. The V -band dust opacity
5.1.3. Transposition to a Simplified SphericalGeometry
The algorithm consists in integrating the line emission measures10 of an isothermal multi-density plasma (MDP) of temperature T e . The calculations can be transposed to the idealized geometry of a spherical (or conical) distribution of ionization bounded clouds whose densities n decrease as r −2. The weight attributed to each plasma density component is set proportional to the covering solid angle11 Ω(n) subtended by the plasma shell of density n. In the case of photoionization models, such a distribution would result in a constant ionization parameter Uo and the integrated columns N Xk of each ion k of any cloud would be to a first order constant. For the sake of simplicity, to describe Ω(n) we adopt the power law (n/n low)ϵ, which extends from n low = 100 up to 108 cm−3. If we transpose this to a spherical geometry where both Uo and Ω are constant (i.e. = 0), the area covered by ionization-bounded emission clouds would increase as r 2, thereby compensating the dilution of the ionizing flux and the density fall-out (both ∝ r −2). In this case, the weight attributed by osald to each shell is the same; otherwise, when ϵ ≠ 0 the weight is simply proportional to Ω(n). MDP calculations are not a substitute to photoionization calculations. They are only intended as diagnostics that could constrain some of the many free parameters that characterize multidimensional NLR models, including those which might consider a non-uniform dust distribution.
5.1.4. Selection of the Distribution Index
To guide us in the selection of , we followed the work of Be06b who determined that, for a spectral slit radially positioned along the emission line cone, the surface brightness of the spatially resolved ENLR is seen decreasing radially along the slit as r δ (with δ < 0), where r is the projected nuclear distance on the sky. From their [OIII]λ5007Å and Hα line observations of Seyfert2’s, Be06b derived average index values of δ [OIII] = −2.24±0.2 and δ Hα = −2.16±0.2, respectively. Let us assume that such a gradient extends inward, i.e. inside the unresolved NLR. For our assumed spherical geometry where the Hα luminosity across concentric circular apertures behaves as r-2ϵ (see §C.2), is given by −(1 + δ)/2. Hence we adopt ϵ≈ +0.6 so that a long slit projected onto our spherical geometry could reproduce the observed δ [OIII] value of Be06b. Out of curiosity, we have explored other positive values and found that changes in ϵ were not critical and did not affect our conclusions.
5.1.5. Importance of Deblending the [ArIV]+ λ4711Å+ Lines
As emphasized by Kewley et al. (2019), care must be taken when interpreting the [ArIV] doublet since the weak nearby HeIλ4713Å line is nearly superposed to the [ArIV] λ4711Å line, hence the need to apply a proper deblending correction to the measured [ArIV] ratios. The procedure adopted is described in AppendixB.1. Because of the relative weakness of the HeIλ4713Å line, there is no direct evidence of its presence in AGN spectra given its closeness to the [ArIV] λ4711Å line. To deblend the flux contribution from the Heiλ4713˚A line, we first evaluate its expected flux using the strong HeIλ5876Å line and then subtract it from the [ArIV] λ4711Å line. Since we are dealing with He recombinations lines, the dependence of the HeI ratio on temperature or density is relatively minor. Hence, obtaining a reliable estimate of the HeI fractional contribution,
Another potential blending consists of the first two lines of the [NeIV] quadruplet which comprise the lines λ4714.36, λ4715.80, λ4724.15 and λ4726.62Å (García-Rojas et al. 2015). For convenience, we will refer to them as consisting of two doublets centered at λλ4715Å and λλ4725Å, respectively. Up to densities of ≈ 106 cm−3, the unblended λλ4725Å doublet is calculated to be on average 35% brighter than the λλ4715˚A doublet. In those cases where the λλ4725Å doublet is detected, we can reliably determine the blended λλ4715Å doublet flux and then subtract it from the blended [ArIV]+ λ4711Å+ lines. Further information about the deblending procedure is given in AppendixB.2. No detection of the [NeIV] λλ4725Å line was reported by Kos78.
5.2. Results from the Multi-Density Plasma Models
5.2.1. The Reference Seyfert2 Sample
The results from the calculations using osald are presented in Table 2, where we have assumed a power law index of ϵ= +0.6. In Column(7),
To facilitate the evaluation of these fits, we show in Figure 4 how the parameters compare for each object between Table 1 (triangles) and Table 2 (stars). Panel(a) represents the target R
OIII ratios, dereddened vs. observed, Panel(b) the deblending correction
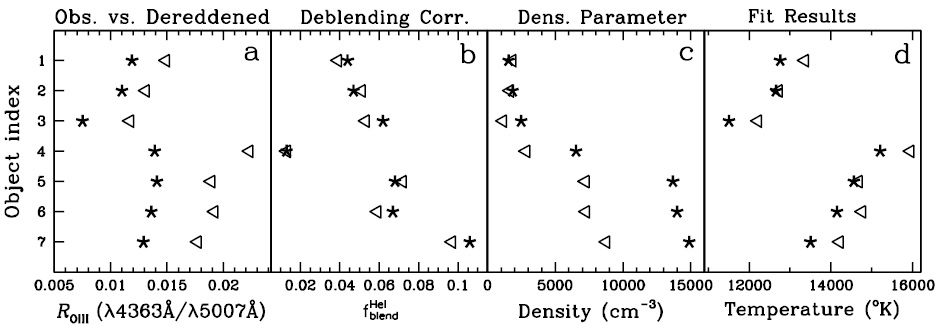
Fig. 4 Comparison between parameters and plasma temperatures shown in Table 1 (open triangles) and Table 2 (stars). An index number (1 - 7) identifies the object name in Column(2) of either table. Panel a: target R
OIII ratios, dereddened (open triangles) vs. observed (stars). Panel b: deblending corrections
Having considered an explicit density distribution, with either dust obscuration (Column10) or without (see TableB1 in AppendixE), we derive temperature values that do not differ much from the single density case of Table 1. This supports our contention that collisional deexcitation is not affecting significantly the R
OIII ratios observed by Kos78. Given the relative proximity in Figure 3 of the Ri14 subset a41 (black diamond) to the Kos78 sample (black disk), we might conjecture that LDR possibly applies to the a41 sample as well since, at a redshift of z = 0.11, the large projected scale of the
5.2.2. Probing the Possible Blending of [ArIV] by [NeIV]
We present complementary calculations in Table 3 where we have assumed the hypothetical case of the λλ4725Å doublet reaching 30% of the observed [ArIV] λ4740Å line intensity. The blending contributions from the Hei and [NeIV] λλ4715Å lines, that is
TABLE 3 EXPLORATION WITH OSALD OF BLENDING DUE TO [NeIV] λλ4714,16Å
| Objects | Target line ratios | Dual blending correctionsa | Parameter values | |||||||||
| (1) Index # |
(2) AGN |
(3) Hα/Hβ |
(4) ROIII |
(5) [ArIV] |
(6) RHe/Ar |
(7) |
(8) [ArIV] |
(9) |
(10) [ArIV] |
(11) |
(12) nopa cm-3 |
(13) TOIII oK |
| 1 | Mrk 573 | 3.62 | 0.0119 | 1.156 | 2.03 | 0.053 | 0.30b | 0.203 | 0.921 | 0.15 | 3.59 × 10³ | 12 710 |
| 2 | Mrk 34 | 4.10 | 0.0110 | 1.193 | 2.46 | 0.056 | 0.30b | 0.196 | 0.953 | 0.40 | 4.56 × 10³ | 12 610 |
| 3 | Mrk 78 | 5.31 | 0.0075 | 1.238 | 4.05 | 0.075 | 0.30b | 0.190 | 0.979 | 1.09 | 6.45 × 10³ | 11 470 |
| 4 | Mrk 176 | 6.55 | 0.0139 | 1.045 | 0.90 | 0.017 | 0.30b | 0.220 | 0.845 | 1.73 | 1.47 × 10⁴ | 15 120 |
| 5 | Mrk 3 | 5.31 | 0.0141 | 0.850 | 3.00 | 0.089 | 0.30b | 0.307 | 0.609 | 1.08 | 2.76 × 10⁴ | 14 390 |
| 6 | Mrk 1 | 5.00 | 0.0136 | 0.814 | 2.71 | 0.089 | 0.30b | 0.326 | 0.575 | 0.91 | 2.85 × 10⁴ | 13 950 |
| 7 | NGC 1068 | 4.47 | 0.0129 | 0.763 | 3.56 | 0.146 | 0.30b | 0.373 | 0.502 | 0.61 | 3.11 × 10⁴ | 13 250 |
| 8A | NGC 4151c | 5.29 | 0.0222 | 0.727 | 2.40 | 0.064 | - | - | 0.684 | 1.07 | 2.16 × 10⁴ | 18 050 |
| 8B | '' '' | '' | '' | '' | '' | 0.088 | 0.30d | 0.377 | 0.496 | 1.07 | 4.64 × 10⁴ | 17 610 |
| 8C | '' '' | '' | '' | '' | '' | 0.148 | 0.62e | 1.32 | 0.294 | 1.08 | 1.49 × 10⁵ | 16 180 |
| 9 | Mrk 477 | 4.00 | 0.0215 | 0.693 | 7.05 | 0.295 | 0.30 | 0.35 | 0.535 | 0.34 | 22 200 | 16 350 |
| 10 | J1653+23 f | 4.08 | 0.0192 | 1.16 | 4.76 | 0.099 | 0.42 | 0.25 | 1.05 | 0.39 | 2 840 | 16 050 |
| 11 | J1300+53 | 3.79 | 0.0257 | 1.13 | 3.21 | 0.070 | 0.38 | 0.22 | 1.06 | 0.239 | 2 200 | 18 320 |
aThe fraction of [ArIV]+ contributed by blending is the sum of
bThe quoted [NeIV] doublet ratio of 0.30 is our estimated upper limit for the Kos78 sample.
cThe line ratios measurements of the Seyfert I NGC 4151, are from Boksenberg et al. (1975).
dEye estimate of the [NeIV] λ4725Å doublet from the Boksenberg et al. (1975) spectrum.
eValue of the [NeIV] λ4725Å doublet deduced from Table I of Boksenberg et al. (1975).
fObservations carried out with the spectrograph OSIRIS mounted on the 10.4 m Gran Telescopio Canarias.
5.2.3. Detection of [NeIV] in Nearby Seyfert1 NGC4151
The critical densities of the [NeIV] quadruplet lines all lie above 106 cm−3. Because the [ArIV] doublet emissivities at such densities are significantly reduced due to collisional deexcitation, a positive detection of the [NeIV] λλ4725Å doublet might relate to having plasma densities much above those deduced from the Kos78 sample. This might be the case in TypeI AGN. Interestingly, the detection of the [NeIV] λλ4725Å doublet was reported early on in the Seyfert1 NGC4151 by Boksenberg et al. (1975). The line ratios of interest for this object are shown in Table 3. A labeled star depicts its position in Figure 3. Eye estimates of the [NeIV] λλ4725Å doublet (from the published figure) suggest a value of ≈ 0.3 with respect to the [ArIV] λ4740Å line, while the measurements reported in their TableI would imply a higher value of 0.62. In Table 3, we present three osald fits in which the [NeIV]/[ArIV] ratio (Column8) successively takes on the values of 0, 0.3 and 0.62. The two [NeIV] deblending corrections result in n opa values higher by factors of 2.2 and 7.5 for models 8B and 8C, respectively, with the deblended [ArIV] doublet ratios dropping to 0.496 and 0.294 (Column10). The impact on the inferred temperature is significant, with TOIII from model 8C being 1870°K lower, at 16180°K, showing minimal evidence of collisional deexcitation being present. It would be interesting to repeat this exercise if we could obtain higher S/N spectra.
5.2.4. The Particular Case of QSO2’s
Through our literature search of TypeII AGN measurements of the λλ4725Å [NeIV] doublet, we came across three objects classified as QSO2’s, that is, TypeII quasars corresponding to the high luminosity counterpart of Seyfert2’s. They are Mrk477 (Villar Martín et al. 2015), SDSS J1300+54 and SDSS J1653+23 (Villar-Martín et al. 2017) at redshifts z of 0.037, 0.088 and 0.103, respectively. Their spectra were extracted from the Sloan Digital Sky Survey data (SDSS; York et al. 2000) and the line ratios relevant to our analysis are given in Table 3.
What stands out from these objects is their larger R OIII ratios. The deblended [ArIV] doublet ratios (Column8) do not imply significant collisional deexcitation, except at a reduced level in Mrk477 where n opa reaches ≃22200cm−3. Yet the TOIII values inferred (Column13) for the three QSO2’s are much higher than in Seyfert2’s, which questions the plausibility of LDR conditions. It is possible that AGN’s where the [NeIV] λλ4725Å can be detected might indicate the presence of a double-bump in their density distribution. We tentatively explored the addition of an additional denser plasma component (≳106 cm−3) to our power law. Our fit to the [ArIV] doublet was not very sensitive to this component since both λλ4711,40Å lines are affected by collisional deexcitation at the high density end. Even though the temperatures we inferred came out at values lower than in Column(13), the exercise was not convincing as the number of free parameters exceeded the number of variables. A possible interpretation is that the super-luminous QSO2’s scale up in size to the extent that their inner NLR become partly visible, as is the case of the high spatial resolution HST measurement of the nearby Seyfert2 NGC1068 (c.f. red triangles in Figure 1).
6. TEMPERATURE PROBLEM WITH PHOTOIONIZATION
In conclusion, after integrating the emissivities of the [OIII] and [ArIV] lines over a continuous distribution of densities, we find that the impact of collisional deexcitation on the λ4363Å/λ5007Å (R OIII) ratio is not significant among ground-based observations of the seven Seyfert2 sample of Kos78 who provided measurements of the [ArIV] density indicator and, therefore, their R OIII ratio provides us with a reliable measurement of the NLR temperature. A comparison of the values of R OIII observed among quasars, Seyfert2’s and spatially extended ENLR plasma, as displayed in Figure1, argues in favor of a floor temperature for the NLR, which we situate at ≳ 13500°K. Our photoionization models using mappings ig and assuming standard SEDs and low densities predict R OIII values significantly below those observed in Seyfert2’s. This discrepancy defines what we would label the R OIII-temperature problem.
In the current work, we found complementary evidence that the orientation of the emission line cone with respect to the observer’s line-of-sight affects our characterisation of the NLR, whether in Seyfert2’s (Kos78 sample) or in quasars (BL05 and RA00 samples). We do not exclude the existence of a much denser NLR component being present in groundbased observations, but we would propose that, at least among Seyfert2’s with z ≳ 0.02, the latter would be strongly diluted by the much brighter low density NLR component, which we evaluate to have a density ≲ 10 4.3 cm−3. In quasars, where a larger fraction of this dense and luminous component becomes visible, the resulting R OIII ratio progressively increases up to values of z ≈ 0.2 due to collisional deexcitation, as proposed by BL05 using dual-density photoionization models. It would be interesting to investigate whether the [NeIV] λ4725Å doublet becomes intrinsically stronger in TypeI objects. A few luminous AGN in which we reported the detection of the [NeIV] doublet in §5.2.3 and 5.2.4 appear to favor a density distribution akin to a double-bump, such as the dual-density approach of BL05, rather than the single power law we have assumed.

