


 nueva página del texto (beta)
 Inglés (pdf)
 Artículo en XML
 Referencias del artículo
 Enviar artículo por email
 Citado por SciELO
  Similares en
SciELO
Similares en
SciELO 
 Permalink
1. INTRODUCTION
A tidal dwarf galaxy (TDG) can be defined as a massive (around 108 M ⨀ baryonic mass) gravitationally bound, self-rotational object of gas, dust, and stars, that is formed during a merger or interaction between massive galaxies (Duc et al. 2000). The first time the idea of small galaxies being formed from the debris of interaction between galaxies was proposed by Schweizer (1978). Since then, this topic has been very active, identifying these galaxies and studying their main properties e.g. (Schechtman-Rook & Hess 2012; Smith et al. 2010; Bournaud et al. 2004; Duc & Mirabel 1999; Duc et al. 1997; Duc & Mirabel 1994; Mirabel, Dottori, & Lutz 1992). These objects typically have an average radius of 6 kpc, an average SFR of 8 𝗑 10-2 M ⨀yr-1, and a metallicity of 8.5 dex (Duc & Mirabel 1999). Some authors, such as Duc & Mirabel (1999), even mention that TDGs have an average (B-V ) color index of 0.3. However, this result is somewhat difficult to establish since Smith et al. (2010) find very dispersed values for the color index (g-r), as well as for the (FUV -g) index, the latter having a very large range of values for all TDGs. Also, they might be relatively longlived objects, more than 1 Gyr, since after their formation at the interaction, they remain orbiting the parent system, or they are expelled from it. However, not all of the objects in the tidal tails of the interacting systems are real galaxies. Some are just gas condensations too small to form a gravitationally bound object (a galaxy) and will dissipate after a few Myr (Bournaud et al. 2004). Others are the result of something called the “whip effect”, which is a phenomenon that occurs when different parts of the tidal tail are superimposed on the line of sight. Using only direct images, it is difficult to differentiate between real tidal dwarf galaxies, gas condensations, and whip-effect objects. Only spectroscopy and, particularly, HI dynamic and position-velocity diagrams, can help to tell them apart. In this sense, the number of real or genuine TDGs is very small, although there are many more tidal objects which cannot be classified as real TDG, but only as TDG candidates. Also, there are some objects which are in the outermost part of the tidal tails, which have low metallicity and mass. The difficulty here is to determine if these dwarf galaxies are tidal objects or original dwarf galaxies, as in the case of NGC4656 UV (Schechtman-Rook & Hess 2012). Then, it can be seen that the identification and classification of tidal galaxies is a difficult task, and it takes quite a long time to obtain a definitive classification.
In this investigation, we used the C-A-S system (Conselice et al. 2003) to separate tidal objects from other types of galaxies, and we checked if it is possible to differentiate between the genuine TDGs candidate TDGs and other tidal objects. The C-A-S system, (Concentration, Asymmetry, and Clumpiness) has recently been used to differentiate morphological types of galaxies (Conselice 2003). It has been found that the C-A-S space, or just the C-A plane, is a powerful tool to distinguish between elliptical, spiral, irregular, and starburst galaxies, where each type of galaxy occupies a different region of the C-A-S space (Conselice 2003; Conselice et al. 2003). Moreover, dwarf elliptical galaxies have different values of concentration and asymmetry than their larger counterparts (Yagi et al. 2006; Conselice et al. 2002; Conselice 2003). Therefore, our goal is to verify if TDGs are located in a separate place in the C-A plane, so they can be easily traced, and if the C and A parameters are different from those of genuine TDGs as well as for the rest of tidal objects.
This paper is structured as follows; § 2 is a description of the sample, the data acquisition, and the determination of parameters. § 3 presents the result of the C-A plane study for the TDGs and dwarf galaxies. We investigate the possible correlation of C and A with the stellar mass and star formation in § 4, along with a discussion of the results, and finally, our conclusions are listed in § 5.
2. SAMPLE, DATA ACQUISITION, AND DETERMINATION OF THE PARAMETERS
As we said, the main goal of this investigation is to study if there are differences in the concentration, C, and asymmetry, A, between tidal dwarf galaxies, candidates, and the rest of the dwarf galaxies. In addition, we can check if the C-A plane can be used to identify TDGs from other types of tidal objects, like projection effects in the tidal tails.
2.1. Sample Selection
In order to verify how useful the C-A plane is to identify TDGs, we selected a sample of tidal objects, which includes confirmed TDGs as well as candidates, which are those objects whose self-rotation has not been confirmed yet. We selected 17 objects that come from pre-merger binary pairs with optical tails, merger systems, and interacting galaxies.
In order to choose the objects of our sample we followed five criteria: (a) only objects classified previously in the literature, as TDGs or TDG candidates, (b) objects with a radius strictly less than 6 kpc, in order to be considered as dwarf galaxies, (c) objects in the tidal tails or in the vicinity of galaxies that show evidence of interactions, (d) objects with images in the optical from SDSS and (e) with images in the UV by GALEX.
The final sample was reduced to a total of 17 objects, eight of which were confirmed TDGs, five TDG candidates, and four were objects with a very low probability of being TDG. However, there was not enough evidence to affirm the opposite. Due to the criteria imposed for the selection of the sample, the distance, magnitude, as well as other properties of the objects, are very different.
In the following, we summarize some of the properties of the selected objects, and some others are listed in Table 1.
TABLE 1 SAMPLE OF TIDAL DWARF GALAXIES
| IDa (1) | Name (2) | RA [J2000] (3) | Dec [J2000] (3) | Dis[Mpc] (4) | Radiib[kpc] (5) |
| 1 | Arp 105N3 | 11:11:12.8 | 28:45:57.14 | 134.25 | 4.71 |
| 2 | Arp 105S2 | 11:11:13.4 | 28:41:15.96 | 134.25 | 4.71 |
| 3 | Arp 112E3 | 00:01:34.5 | 31:26:33.70 | 66.09 | 5.31 |
| 4 | Arp 181W1 | 10:27:26.3 | 79:49:12.79 | 143.56 | 5.30 |
| 5 | Arp 181E1 | 10:27:40.1 | 79:49:45.3 | 143.56 | 3.88 |
| 6 | Arp 202W1 | 09:00:09.3 | 35:43:40.26 | 48.70 | 2.63 |
| 7 | Arp 226NW1 | 22:20:33.5 | -24:37:22.07 | 66.14 | 3.85 |
| 8 | Arp 226E1 | 22:20:55.7 | -24:41:10.21 | 66.14 | 4.47 |
| 9 | Arp 242N2 | 12:46:10.4 | 30:45:11.31 | 101.44 | 4.15 |
| 10 | Arp242S3 | 12:46:12.0 | 30:42:02.34 | 101.44 | 5.62 |
| 11 | Arp244S1 | 12:01:26.6 | -19:00:49.33 | 30.38 | 3.95 |
| 12 | Arp245N1 | 09:45:44.1 | -14:17:34.55 | 39.15 | 5.81 |
| 13 | Arp305E1 | 11:58:41.5 | 27:29:34.90 | 55.12 | 4.86 |
| 14 | NGC4656N3 | 12:44:14.4 | 32:16:43.88 | 13.41 | 5.40 |
| 15 | Arp270S2 | 10:49:34.5 | 32:52:38.31 | 28.14 | 1.91 |
| 16 | Arp270N2 | 10:49:44.2 | 33:00:42.40 | 28.14 | 0.76 |
| 17 | HolmbergIX2 | 09:57:31.5 | 69:02:43.69 | 1.90 | 0.86 |
a Column (1) is the identification number in each object of our sample.
b The radii in Column (6) are the r(80%), obtained as described in § 2.2.
1 Tidal dwarf galaxies confirmed, TDG.
2 Tidal dwarf galaxies candidates, TDGc.
3 Non-likely tidal dwarf galaxies, nlTDG.
The main properties of the sample are listed in Table 1. An ID number is given in Column 1, while the name is given in Column 2. This name is that of the parent system along with a letter that describes the location of the TDG. The right ascension and declination are listed in Column 3, while the distance to the system (aka, the interacting parent galaxies) is presented in Column 4. This distance is important, because the farther the system is the more difficult it is to distinguish tidal features, and the more easily the low surface brightness structure is lost in the images. In Column 5 are listed the radii of the TDGs, as the r 80 described in § 2.2.
Smith et al. (2010) proposed that Arp 181N, Arp 181S, and Arp 202W could be TDGs. This was confirmed later by Sengupta et al. (2013). Moreover, Scott et al. (2018) found evidence that Arp 202W lacked a significant old stellar population, so they concluded that it might have been formed in the extended dark matter halo of one of its parent galaxies. Also, both systems in Arp 226, Arp 226NW, and Arp 226E, have been confirmed as TDGs by their metallicity and HI gas dynamics (Lelli et al. 2015). The Arp 244 system was the first where the existence of TDG candidates (Arp 244W and Arp 244E) was reported (Schweizer 1978; Mirabel, Dottori, & Lutz 1992). The high-resolution mapping of HI made by Hibbard et al. (2001) and Gordon, Koribalski, & Jones (2001) corroborated the neutral gas counterpart of these two objects. More recent authors have confirmed that these objects are TDG (Smith et al. 2010; Hibbard et al. 2005). Finally, there are two other systems with genuine tidal objects: Arp 245N, which has been proposed as a tidal galaxy still in formation (Smith et al. 2010; Brinks et al. 2001; Duc et al. 2000), and Arp 305E, which Hancock et al. (2009) proposed as a TDG after studying its star formation and age, all of which was later confirmed by Sengupta et al. (2017).
However, there are some other galaxies the nature of which has aroused some doubts. Duc & Mirabel (1994), Duc et al. (1997), and Smith et al. (2010) suggested that Arp 105N and Arp 105S might be tidal objects. However, Bournaud et al. (2004) showed that Arp 105N is a “whip effect” object, but confirmed that Arp 105S could be a TDG at an early state. Anyhow, we will keep Arp 105N in our sample in order to see if such a kind of object can be distinguished from a real TDG in the C-A plane. A similar situation applies for Arp 242, where Arp 242N is considered as a TDG (Smith et al. 2010), but Bournaud et al. (2004) did not get any conclusion on Arp 242S. Therefore, it will be considered as a TDG candidate in this investigation. Arp 112E, also called KUG 2359+311, was considered as one of the reddest TDG candidates by Smith et al. (2010). However, Fu et al. (2020) could not observe HI gas in this object, nor any bridge of gas between it and Arp 112. This could indicate two things: it is a normal dwarf galaxy in the vicinity of Arp 112, or KUG 2359+311 is a TDG that has run out of gas. Only Smith et al. (2010) proposed Arp 270N as TDGc, and we will consider it as such in this investigation. Sabbi et al. (2008) found that Holmberg IX is a stronger TDG candidate. Moreover, Schechtman-Rook & Hess (2012), using a photometric analysis, also found evidence that Holmberg IX could be a TDGc, although it was not a definitive conclusion. Finally, according to Schechtman-Rook & Hess (2012), NGC 4656 might have, at least, two tidal objects: NGC 4656N and NGC 4656UV. Although Zasov et al. (2017) concluded that NGC4656UV is rather an LSB-dwarf galaxy with dark matter, which agrees with Muñoz-Elgueta et al. (2018), where it is proposed that NGC 4656 and 4656UV are a pair of interacting galaxies and NGC 4656UV does not have a tidal origin.
In conclusion, in our sample, there are 8 confirmed TDG, 4 candidates, and 5 objects which might not be TDG, which we call non-likely tidal dwarf galaxy (nlTDG). Although there are a few more TDGs and candidates, these are the ones with good resolution in their optical images, deep enough to allow a good determination of C and A. They also have UV images, in order to get the SFR. Therefore, they are the only ones included in this investigation.
The images used in this work for the determination of C and A were selected from the SDSS in the g filter (Blanton et al. 2017; Doi et al. 2010), except for Arp 244, where an image from the DSS in the V filter was used. For the determination of the parameters C and A, the MIDAS software was used. The images used for the star formation in the ultraviolet are from the GALEX space observatory database (Bianchi, Shiao, & Thilker 2017).
2.2. Determination of the C and A Indexes
The concentration index, C, quantifies the concentration of the light in a galaxy, and it is defined as
where r(80%) and r(20%) represent the radius that encloses, respectively, 80% and 20% of the light curve of the source in units of 1.5 Petrosian reverse radii (Bershady et al. 2000). This index has been used extensively to classify galaxies into two broad classes, early and late (Doi et al. 2010; Bell et al. 2003). The correlation between the C index and the stellar mass is very interesting, in the sense that massive galaxies have a higher C index (Conselice 2006a).
In order to determine C, we followed the methodology described below. First, from a two-dimensional Gaussian fitting the optical center of the galaxy was determined. This point will be the center of elliptical rings, from which the intensity against the radius can be plotted for each object. This can be integrated to get the flux vs. radius plot. Then, we selected those radii which contain 80% and 20% of the total flux of the object, respectively. The distance from the center of the galaxy to these points is the r 80 and r 20, respectively. These values are the values we used in Section 2.1. The software MIDAS was used. For a more detailed process, the reader should refer to Vega-Acevedo (2013).
The definition of the asymmetry index A used in this paper is
where I is the original image and R is that same image rotated by 180 degrees around the optical center (determined as previously said). The rotated image was created with the software as well as the |I − R| one. Both parts of the equation were obtained with the addition of the flux of all the pixels inside the r 80, and a subsequent division of these two quantities, the total flux in the |I − R| image and in the I image. The MIDAS software was also used for this procedure (Vega-Acevedo 2013).
The asymmetry index takes values from 0, for galaxies completely symmetrical, to 1 where the galaxy is completely asymmetrical (Conselice et al. 2003, 2000).
The A index has been used to identify recent merger systems that are very distorted. Based on asymmetry measurements on images of nearby merger remnants, it can be considered that a galaxy is a merger remnant if its asymmetry index is larger than a certain value A > A m , with A m = 0.35 (Conselice et al. 2003). Note that this criterion applies to disk-disk mergers only. Spheroid-dominated mergers suffer much weaker morphological distortions, hence this asymmetry criterion cannot be used.
The final values of A and C for this sample of tidal dwarf galaxies are listed in Columns 2 and 3 of Table 2, while the stellar mass and the star formation rates are listed in Columns 4 and 5, respectively.
TABLE 2 SAMPLE VALUES
| IDα | A | C | M*[M⨀] 108 | SFR[M⨀ yr-1] |
| 1 | 0.5 ± 0.1 | 1.7 ± 0.3 | 3.3 ± 0.5 | 61.9 ± 0.5 |
| 2 | 0.4 ± 0.1 | 1.7 ± 0.3 | 6.1 ± 0.5 | 38.5 ± 0.5 |
| 3 | 0.6 ± 0.1 | 2.1 ± 0.3 | 1.6 ± 0.5 | 28.8 ± 0.5 |
| 4 | 0.8 ± 0.1 | 1.7 ± 0.3 | 0.4 ± 0.5 | 8.0 ± 0.5 |
| 5 | 0.7 ± 0.1 | 1.6 ± 0.2 | 1.0 ± 0.5 | 7.9 ± 0.5 |
| 6 | 0.6 ± 0.1 | 2.1 ± 0.3 | 0.2 ± 0.5 | 3.9 ± 0.5 |
| 7 | 0.2 ± 0.1 | 1.5 ± 0.2 | 3.5 ± 0.5 | 17.9 ± 0.5 |
| 8 | 0.7 ± 0.1 | 1.6 ± 0.2 | 8.3 ± 0.5 | 10.8 ± 0.5 |
| 9 | 0.3 ± 0.1 | 1.7 ± 0.3 | 1.7 ± 0.5 | 39.2 ± 0.5 |
| 10 | 0.6 ± 0.1 | 1.8 ± 0.3 | 0.8 ± 0.5 | 20.2 ± 0.5 |
| 11 | 0.1 ± 0.1 | 1.5 ± 0.2 | 1.2 ± 0.5 | 29.9 ± 0.5 |
| 12 | 0.1 ± 0.1 | 1.6 ± 0.2 | 1.2 ± 0.5 | 11.1 ± 0.5 |
| 13α | 0.5 ± 0.1 | 2.4 ± 0.4 | - | 2.5 ± 0.5 |
| 14 | 0.5 ± 0.1 | 2.0 ± 0.3 | 0.40 ± 0.5 | 2.7 ± 0.5 |
| 15α | 0.5 ± 0.1 | 1.5 ± 0.2 | - | 0.7 ± 0.5 |
| 16 | 0.6 ± 0.1 | 1.9 ± 0.3 | 1.4 ± 0.5 | 5.0 ± 0.5 |
| 17α | 0.4 ± 0.1 | 2.0 ± 0.3 | - | 0.8 ± 0.5 |
aThe stellar mass obtained for these objects is smaller than 0.1 𝗑 108M⨀.
3. THE C AND A PLANE
Many researchers have used the position in the concentration−asymmetry plane (C-A) to classify galaxies by their morphology (Bershady et al. 2000; Lauger et al. 2005; Menanteau et al. 2006; Yagi et al. 2006; Huertas-Company et al. 2008; Neichel et al. 2008). Based on their results we checked if tidal dwarf galaxies were in a separate place in this plane and, therefore, easily spotted.
The A parameter, listed in Table 2, ranges between 0 and 1, the smaller the values the more symmetric the galaxy. Only three of our galaxies have low A values (< 0.2), but also only three have very high asymmetry values (> 0.7). Therefore, most of the TDGs, about 60% of the galaxies, have intermediate A values. Also, it can be seen that most of the TDG are more asymmetric than the average dwarf galaxies, as can be seen in Table 2 and Figure 1, where the histogram distribution of the A values for the TDGs in our sample is shown in (d) panel. In the other panels the distribution for elliptical (a), spiral (b) and irregular galaxies (c) are shown for comparison. These values have been obtained from Conselice (2006a) and Vega-Acevedo & Hidalgo-Gámez (2014). There are large differences between TDGs and elliptical and spiral, the latter having small A values, no larger than 0.3. On the contrary, irregulars and TDGs show a broad range of asymmetry values, although the peak for Irr (including dwarf) is at lower values than for TDGs. This is also seen in Table 3, where the average values of the asymmetry index are shown for some of the galaxies types. TDGs have the largest one, while Irr and dIrr have a smaller average A value (in this investigation we separated between dwarf and normal irregular galaxies).
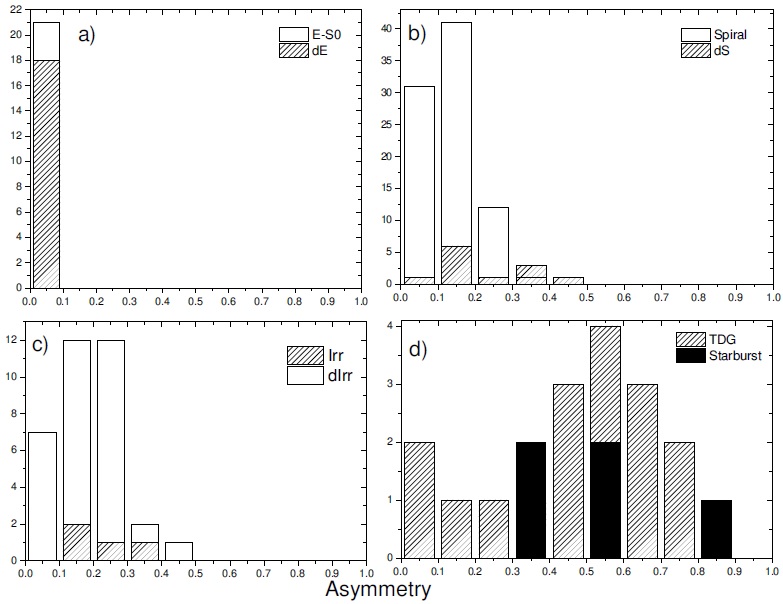
TABLE 3 AVERAGES AND 1σ VARIATIONS OF C AND A FOR GALAXY TYPES
| Type | C | A |
| TDGs | 1.7 ± 0.2 | 0.5 ± 0.2 |
| Ellipticalsa | 4.4 ± 0.3 | 0.0 ± 0.1 |
| Dwarf ellipticalsa | 2.5 ± 0.3 | 0.0 ± 0.1 |
| Spirala | 3.3 ± 0.6 | 0.1 ± 0.1 |
| Dwarf Spiralb | 2.4 ± 0.6 | 0.2 ± 0.1 |
| Irregularsa | 3.3 ± 0.5 | 0.3 ± 0.2 |
| Dwarf irregularsa | 2.9 ± 0.3 | 0.2 ± 0.1 |
The error for C and A corresponds to a 1σ variation from the average.
a Data taken from Conselice (2003).
bData taken from Vega-Acevedo & Hidalgo-Gámez (2014).
Another interesting aspect to notice is those TDGs with very small asymmetry indexes. As can be seen in Table 2, at least two of them have A values lower than 0.1 (Arp 244S and Arp 245N). We think there are two reasons for such unexpected values: one is that these are not TDGs but some other tidal features, more symmetric, which might not be the case based on the large number of investigations that confirmed the tidal nature of these particular objects (Smith et al. 2010; Hibbard et al. 2005; Smith et al. 2010; Brinks et al. 2001; Duc et al. 2000). The second one is the lack of low surface brightness structure in the images used for the A determination. This might lead to a lower value of the asymmetry because only the central part of the galaxies was used, which are always more symmetric than the outer parts (Vega-Acevedo 2013). Therefore, it is important to use the deepest images for the A determination (Vega-Acevedo 2013). However, as this investigation used archive data, such a requirement could not always be fulfilled.
Concerning the asymmetry for the different types of tidal objects, the TDGc have the lowest average value (0.38) while the nlTDGs have the highest (0.52), although the differences are of the same order of the dispersion.
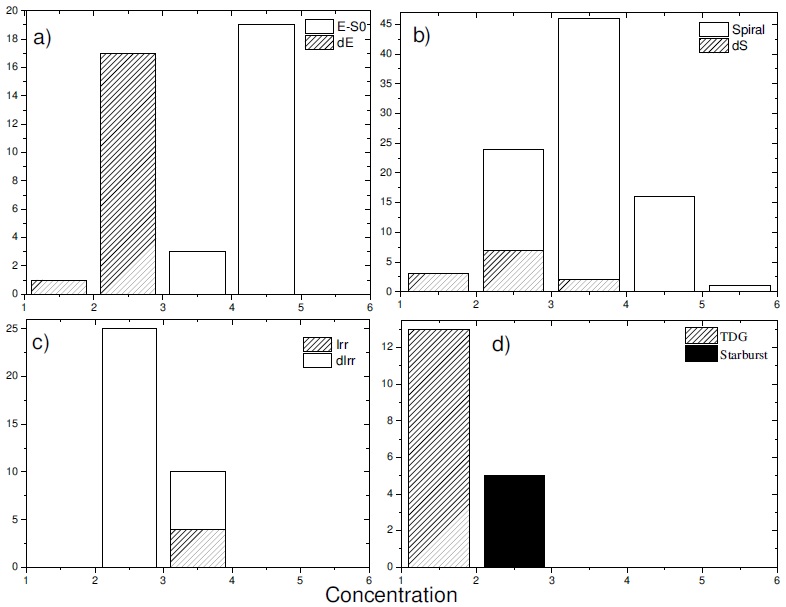
Low values of the C parameter indicate a low concentration of light at the center of the galaxy, which is more common in late-type galaxies (spiral and irregular galaxies). Therefore, Bell et al. (2003) differentiated late and early galaxies based on this parameter. Actually, according to them, a value of C higher than 2.6 indicates an early galaxy. Only one of the galaxies (Arp 305N) in our sample has C close to this value, while the other 16 are well into the late-type values. Figure 2 shows the histogram distribution of the C values for different morphological types of galaxies. It is clear that TDGs have the narrowest distribution and the lowest C values. Only some of the dS and dE have similar C values, but the average values (listed in Column 1 of Table 3) are very different. The concentration average value is very similar for the three types of dwarf galaxies. Moreover, it is also interesting to notice that dwarf galaxies always have lower concentration values than their larger counterparts, although all dwarf galaxies have larger C values than the TDGs. Again, the nlTDG have the highest average concentration values (1.9), while the TDGc have the lowest ones (1.7). In any case, it can be concluded that TDGs have different values of the A and C index than any other types of galaxies, including dwarf ones.
3.1. C-A Plane
As seen so far, tidal dwarf galaxies might have particular values of the A and, especially, the C indexes. As pointed out by several investigations (Conselice et al. 2000; Conselice 2003; Vega-Acevedo & Hidalgo-Gámez 2014), galaxies with different morphologies have different positions in the C-A plane, and they can be differentiated very easily. This is one of the advantages of the CA system. Therefore, we have plotted the TDG of our sample in the C-A plane along with the elliptical, irregular, spiral and starburst galaxies, in Figure 3. There are two interesting conclusions from this figure. Firstly, TDGs are not located near the starburst galaxies. However, both groups of galaxies have a broad range of A values. Secondly, the C indexes for TDGs are very low. They are the lowest values for all the types of galaxies, despite the low concentration that dwarf galaxies have, as already noted. Therefore, the identification of TDGs can be done very easily using the C-A plane because they are located in a specific strip in this plane, at C values smaller than 2.
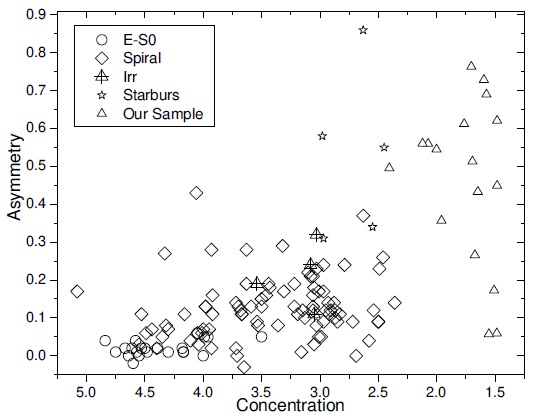
Fig. 3 This figure shows the C-A plane for the different morphological types of galaxies. Circles correspond to elliptical or spheroidal galaxies (E, S0), diamonds to spiral galaxies, cross triangles to irregular galaxies, five-pointed stars to starburst galaxies, and triangles to the objects in our sample. All the data not in our sample were taken from Conselice et al. (2003).
In Figure 4 we show the C-A plane again, but for dwarf galaxies only. Along with the data points of dE, dS, dI, and TDG, there are the regions of early, and late-type proposed by several authors (Bershady et al. 2000; Conselice et al. 2003), separated by a dotted line. One of the most striking aspects is that more than 90% of the dwarf galaxies have a concentration index lower than 3, including dE, but no specific value of A. This is contrary to what happens to large galaxies, where more than 75% of them have C > 3. Both dS and TDG are located in the late-type region, while dE are located at the bottom of the plane (early region), with very low A indexes and intermediate C values. Previous investigations proposed that the structure of dS can be explained by minor interactions (Vega-Acevedo & Hidalgo-G´amez 2014). This might explain the similarities in the C index between dS and TDG’s (see Figure 4). The main caveat is the low number of dS galaxies analyzed so far. On the contrary, the dIrr galaxies are distributed at large C indexes (> 2.5) and from early to late-type, although almost 70% of the dI are in the late-type regions.
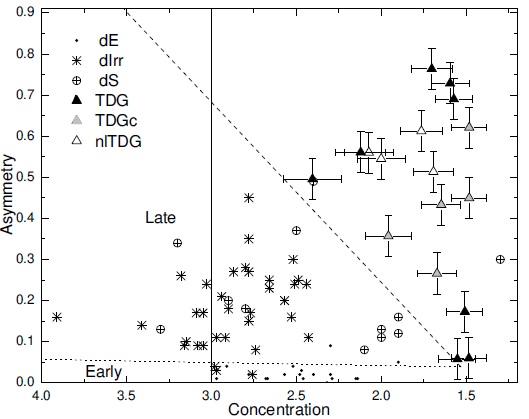
Fig. 4 Asymmetry vs concentration for dwarf galaxies only. This figure shows the C-A plane with different types of dwarf galaxies. Black dots correspond to dwarf elliptical galaxies (dE), stars to dwarf irregular galaxies (dIrr), crossed circles to dwarf spirals (dS), black triangles to tidal dwarf galaxies confirmed (TDG), grey triangles to tidal dwarf galaxies candidates (TDGc), and white triangles represent the non-likely tidal dwarf galaxies, (nlTDG). The dotted lines separate the early from the late galaxies, and the late from TDGs, while the vertical line represents the maximum value usual for dwarf galaxies. The data for dE and dIrr are from Conselice et al. (2003), while the data for dS are from Vega-Acevedo & Hidalgo-Gámez (2014).
In this figure, it can be seen that TDGs have the same characteristics as other kinds of dwarf galaxies, but they are separated from both dI and dS. They have the smallest C indexes of all the dwarf galaxies, 1.5 < C < 2.5, and can be localized in a region over the dashed line in Figure 4, which is given by:
No other dwarf galaxy is located to the right of this line except for one dS. Although more data on late-type dwarf galaxies are needed to reinforce this conclusion, this might indicate the TDGs to be morphologically different from the rest of the dwarf galaxies, with a different origin and evolution.
It is interesting to notice that there is no real difference in the position in the C-A plane between genuine TDG, candidate TDG, and the nlTDG objects.
4. DISCUSSION
Although the C parameter values are very similar for most of the galaxies in our sample of tidal dwarf galaxies, the asymmetry parameter is spread all over the whole range. The relationship between the asymmetry parameter and the star formation rate (Vega-Acevedo & Hidalgo-Gámez, in preparation) is well known, so we would like to study the influence of the SFR on the C-A plane, if any. We will also explore how the stellar mass might affect the position of the galaxies in this plane.
The star formation rate for the galaxies in our sample is listed in Table 2, Column 4, and it was determined from the UV flux from GALEX with the calibration proposed by Hunter, Elmegreen & Ludka (2010),
The main caveat is the lack of an extinction correction, which could systematically overestimate the SFR. Although it is possible to use IR flux to correct the UV flux from extinction (Rosa-González, Terlevich & Terlevich 2002), the small resolution of the infrared images does not allow to obtain the precise IR fluxes of the tidal dwarf galaxies.
The stellar masses, listed in Table 2, Column 3, were determined with the calibrations by Bell et al. (2003). In particular, we used the following relation
where the stellar luminosity is given in solar units, and where α g = −0.499 and b g = 1.519 (Bell et al. 2003); and the (g-r) were obtained using the g and r images inside the r 80. From the values listed in Table 2, it is clear that most of the TDG’s in our sample have stellar masses smaller than 2 𝗑 108 M ⨀, with a median value of 2.4 𝗑 108 M ⨀ ., which is very similar to the one determined by Kaviraj et al. (2012) for a sample of 407 TDGc, of 1.9 𝗑 108 M ⨀ .
Similarly, the SFR is very low (< 0.1 M ⨀ yr−1) for half of the sample with an average value of 0.17M ⨀yr-1. These values are similar to the typical values in a sample of late-type galaxies (Magaña-Serrano et al. 2020), although it is very small compared to the SFR of interacting galaxies, which is of the order of 1-3.5M⨀yr-1 (Pearson et al. 2019).
We can explore again the C-A plane adding these two parameters. They are shown in Figure 5, where the different colors indicate different stellar masses in the top panel, and different SFRs in the bottom one. No clear differences can be seen; galaxies with large and small stellar mass are located at the same place in the C-A plane, although all the galaxies with high SFR but one (Arp 112) have C values smaller than 1.8.
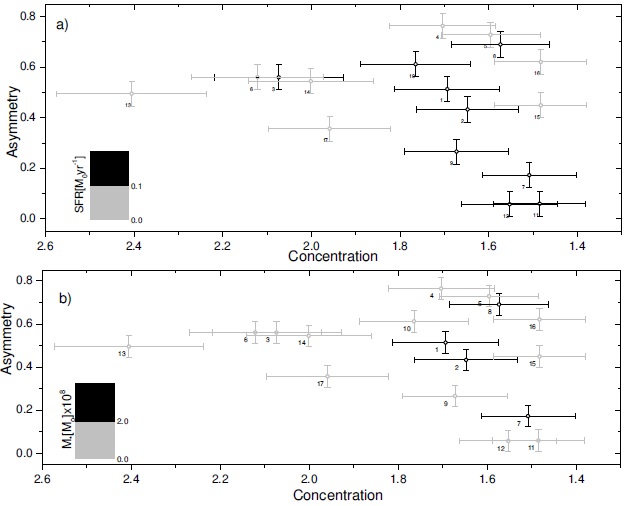
Fig. 5 C-A plane. In the top panel, the black points represent objects with SFR over 0.1M ⨀yr-1, while the grey points represent objects with SFR lower than 0.1M ⨀yr-1. In the bottom panel, the black points represent objects with stellar mass larger than 2 𝗑 108 M ⨀, and the grey points represent those with stellar mass smaller 2 𝗑 108 M ⨀.
In Vega-Acevedo (2013), as well as in other authors (Conselice et al. 2003; Mayya & Romano 2001), a relationship between the asymmetry parameter and the SFR was obtained for normal galaxies. We can see that the TDG in Figure 6 can be grouped into two categories: those with a SFR lower than 0.1M ⨀yr-1 seem to follow a linear correlation, while TDGs with a higher SFR do not show a clear correlation, only a dispersion diagram, with no particular value of the asymmetry. Moreover, there are no real differences between the candidates, the confirmed TDGs, and the nlTDG in the diagram, although three out of five of the latter are located at the high SFR locus. More data are needed to confirm the lack of trend for galaxies with high SFR. We must notice that the SFR determined in Vega-Acevedo & Hidalgo-Gámez (2014) used the H α flux, which gives smaller values than the UV flux, so small differences are expected.
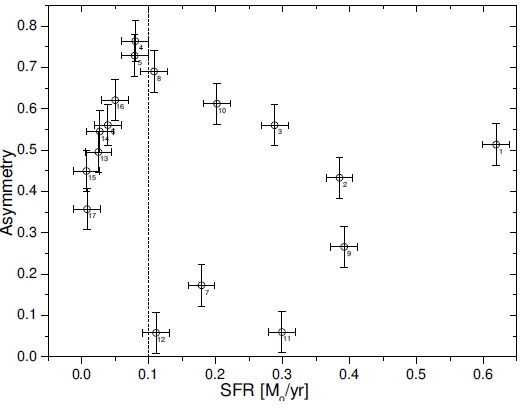
Fig. 6 Asymmetry vs the star formation rate. The vertical dash line represents the average value of star formation for dwarf galaxies.
We can also check if there is any relationship between C and the stellar mass as proposed for normal galaxies (Conselice 2006a). Figure 7 shows that there is a logarithmic relationship,
where α = 2.28 ± 0.68 and β = −0.01 ± 0.01 (see solid line in Figure 7). Despite this possible correlation, it is clear that the TDG can be divided into two groups, with approximately 76% of the sample having a stellar-mass of less than 2 𝗑 108 M ⨀.
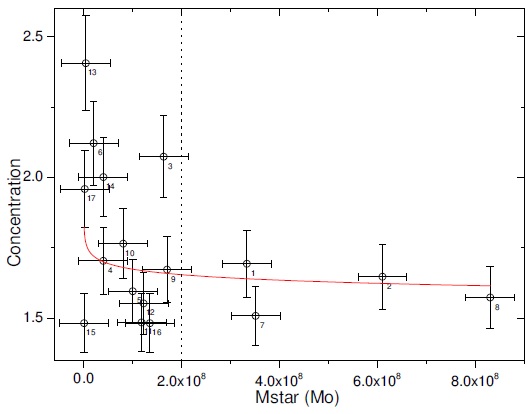
Fig. 7 Concentration vs stellar mass, M star . The vertical dash line represents the average value of stellar mass for dwarf galaxies, while the solid line is a fit to the data-points. The color figure can be viewed online.
In a recent study of galaxies in chaotic environments at high redshift (Cosmic Assembly Nearinfrared Deep Extragalactic Legacy Survey, CANDELS) by Salmon et al. (2015), a linear correlation between the SFR and the stellar mass was found. Although CANDELS galaxies are early-type at z between 4 and 6, it is assumed that their gas is very turbulent. In such a way, they are very similar to TDGs, which are being formed in a very turbulent environment. Therefore, a similar correlation might be expected for the latter. As can be seen in Figure 8, there is a linear correlation
where α = (5 ± 1) × 10−10 and β = 0.02 ± 0.01. These values are very similar to those of CANDELS galaxies for z = 4. It is very interesting to note that those galaxies with a stellar mass of less than 2M ⨀ and a stellar formation of less than 0.1M ⨀yr-1 are those reinforcing such relationship, while only two galaxies outside this “box” follow it. Galaxies with low M ∗ but high SFR seem to follow a linear correlation but with a different slope. More data are needed to understand the reason why these galaxies do not follow a single correlation between the SFR and the stellar mass.
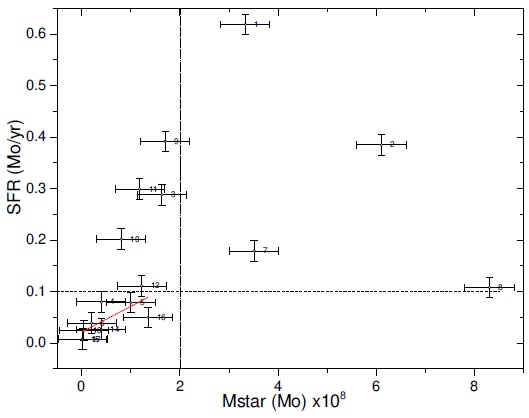
Fig. 8 Star formation rate, SFR vs stellar mass, M star . The horizontal dash line represents the average value of star formation for dwarf galaxies, and the vertical dash line represents the average value of stellar mass for dwarf galaxies. The solid line is a fit to the data-points. The color figure can be viewed online.
5. CONCLUSIONS
In this investigation, we determined the C and A parameters for a sample of TDGs in order to know if they have similar values to the rest of the galaxies. In our sample, we included five tidal objects, which might not be TDGs, just to check if there are any differences between genuine, real TDGs and any other tidal object.
We noticed that the TDGs have the lowest C values than any other group of galaxies. This indicates that they are the loosest of the galaxies, which is quite expected if these objects are still in the assembling stage. Moreover, the exact value of the C parameters does not depend on the stellar mass or the SFR. Also, TDG are the galaxies with the largest values of the A parameter, except for starburst galaxies. This is quite expected because they are just assembling and the asymmetry might be larger.
With these values, it is clear that TDGs are located in a separated, well defined region in the C-A plane. No other galaxies, including dwarf galaxies, fall in this part of the plane. This might indicate that TDGs have a very different origin than the rest of the galaxies. Or, the other way around, dwarf galaxies (dE, dS, and dI) may not be formed from the debris of interacting systems. The main caveat is that there is no difference between the confirmed TDGs, the TDG candidates, and the non-likely TDG objects with very similar average values of both A and C for the three subsamples.
Contrary to what was obtained for large galaxies, there is no correlation between the A parameter and SFR, except for galaxies with SFR smaller than 0.1M ⨀yr-1. Moreover, the relationship between C and stellar mass is exponential, but with a large dispersion.
On the other hand, we obtained a relationship between SFR and the stellar mass for the galaxies in our sample. This correlation is very similar to the one obtained for CANDELS galaxies, which are early-type galaxies at z > 4 with a turbulent environment. This is interesting because TDGs, as they are being formed during an interaction of galaxies, also have a very turbulent environment. This suggests that the environment and turbulence are crucial parameters for understanding galaxy formation. However, for a thorough conclusion on this subject, more TDGs are needed.

