SciELO - Scientific Electronic Library Online

 
vol.57 número2The first detailed analysis on the astrophysical properties of the eccentric binary V990 HerStar formation histories of brightest cluster galaxies with intermediate central ages índice de autoresíndice de materiabúsqueda de artículos
Home Pagelista alfabética de revistas  

Servicios Personalizados

Revista

Articulo

Indicadores

Links relacionados

  • No hay artículos similaresSimilares en SciELO

Compartir


Revista mexicana de astronomía y astrofísica

versión impresa ISSN 0185-1101

Rev. mex. astron. astrofis vol.57 no.2 Ciudad de México oct. 2021  Epub 15-Feb-2022

https://doi.org/10.22201/ia.01851101p.2021.57.02.10 

Articles

Study of an Intermediate age open cluster IC 1434 using ground-based imaging and Gaia DR2 astrometry

Y. H. M. Hendy1 

D. Bisht2 

1 Astronomy Department, National Research Institute of Astronomy and Geophysics (NRIAG), Helwan, Cairo, Egypt.

2 Key Laboratory for Researches in Galaxies and Cosmology, University of Science and Technology of China, Chinese Academy of Sciences, Hefei, Anhui, 230026, China.


ABSTRACT

We present a detailed photometric and kinematical analysis of the poorly studied open cluster IC 1434 using CCD VRI, APASS, and Gaia DR2 database for the first time. By determining the membership probability of stars we identify the 238 most probable members with a probability higher than 60% by using proper motion and parallax data as taken from the Gaia DR2 catalog. The mean proper motion of the cluster is obtained as µ x = −3.89 ± 0.19 and µ y = −3.34 ± 0.19 mas yr−1 in both the directions of right ascension and declination. The radial distribution of member stars provides the cluster extent as 7.6 arcmin. We estimate the interstellar reddening E(BV ) as 0.34 mag using the transformation equations from the literature. We obtain the values of cluster age and distance as 631 ± 73 Myr and 3.2 ± 0.1 kpc.

Key Words: astrometry; Hertzsprung-Russell and colour; magnitude diagrams; open clusters and associations; individual; IC 1434

RESUMEN

Presentamos un estudio fotométrico y cinemático detallado del cúmulo IC 1434 utilizando por primera vez CCD VRI, APASS, y la base de datos Gaia DR2. Mediante el análisis de los movimientos propios y las paralajes del catálogo Gaia DR2 identificamos los 238 miembros más probables del cúmulo, con una probabilidad mayor que 60%. Encontramos que el movimiento propio medio del cúmulo es µ x = −3.89 ± 0.19 and µ y = −3.34 ± 0.19 mas yr−1 en ascensión recta y declinación. La distribución radial de las estrellas miembros muestra que la extensión del cúmulo es 7.6 minutos de arco. Estimamos un enrojecimiento interestelar de E(BV ) = 0.34 mag mediante las ecuaciones de transformación de la literatura. Obtuvimos una edad para el cúmulo de 631±73 millones de años y una distancia de 3.2 ± 0.1 kpc.

1. INTRODUCTION

Open clusters (OCs) are important tools to probe the Galactic disk properties (see, e.g., Friel 1995). OCs are very advantageous to interpret many queries regarding the assessment of chemical abundance gradients in the disk (see, e.g., Twarog, Ashman & Anthony-Twarog 1997; Chen, Hou & Wang 2003), Galactic structure and evolution (e.g., Janes & Adler 1982; Janes & Phelps 1994), interactions between thin and thick disks (e.g., Sandage 1988), as well as the theories of stellar formation and evolution (e.g., Meynet, Mermilliod & Maeder 1993; Phelps & Janes 1993). It’s not an easy task to segregate cluster members from field stars considering that OCs are generally projected against the Galactic disc stars. The second data release (DR2) (Gaia Collaboration et al. 2016a) contains 1.7 billion sources and was made public on 2018 April 24 (Jordi et al. 2010; Gaia Collaboration et al. 2016a,b; Salgado et al. 2017). The Gaia DR2 data contains photometric magnitudes in three bands (G, G BP , and G RP ) and astrometric data at the sub-milliarcsecond level along with the parallax (Gaia Collaboration et al. 2018a). Gaia data have been used recently by many authors to estimate the membership probability of stars lying towards the cluster regions (Cantat-Gaudin et al. 2018; Gao 2018; Rangwal et al. 2019; Bisht et al. (2019, 2020a, 2020b).

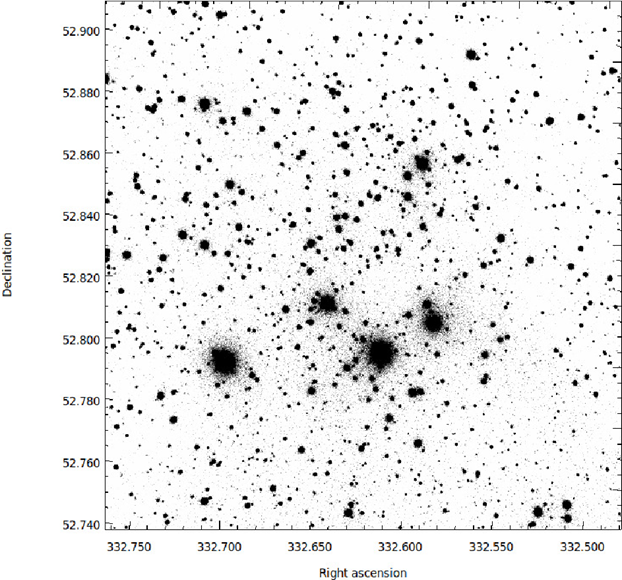
Fig. 1 Finding chart of the stars in the field of IC 1434. Filled circles of different sizes represent the brightness of the stars. The smallest size denotes stars of V ≈ 20 mag. 

The open cluster IC 1434 (α2000=22h10m30s, δ2000=5250'00''; l=99.937, b=-2.700) is located in the second Galactic quadrant. Tadross (2009) analyzed this object using 2MASS and NOMAD data sets. He obtained the age, the interstellar reddening EB-V, and the distance of this object as 0.32 Gyr, 0.66 mag, and 3035±140pc, respectively. In this paper, our main goal is to accomplish a deep and precise analysis of an intermediate-age open cluster IC 1434 using CCD VRI, APASS, and Gaia DR2 data.

The layout of the paper is as follows. A brief description of data used, data reduction, and calibration are described in § 2. § 3 deals with the study of proper motion and determination of membership probability of stars. The derivation of structural properties and of fundamental parameters using the most probable cluster members is carried out in § 4. The conclusions are presented in § 5.

2. OBSERVATIONS AND CALIBRATION OF CCD DATA

The VRI CCD photometric observations of IC 1434 were carried out using the 74-inch Kottamia astronomical observatory (KAO) of NRIAG in Egypt. Images were collected using a 2k×2k CCD system. The observations were taken at the Newtonian focus with a field area of 10'×10' and a pixel scale of 0''.305 pixel-1 on 8th November 2013. The read-out noise was 3.9 e-/pixel. Observations were organized in several short exposures with the air mass ranges of 1.32-1.62 in each of the filters, as described in Table 1 . All CCD frames were observed with two amplifiers, which were treated for overscan, bias, and flat field corrections using an IRAF’s code written by one of the authors (Y.H.M. Hendy, see Tadross et al. 2018). To perform the photometry, we used a DAOPHOT package on IRAF (Stetson 1987, 1992). The data reduction procedure was explained by Bisht et al. (2019). The identification chart for IC 1434 based on our V-band observations is shown in Figure 1.

TABLE 1 LOG OF OBSERVATIONS, WITH DATES AND EXPOSURE TIMES FOR EACH PASSBAND 

Band Exposure Time Date
(seconds)
V 120×3, 60×1 8 th November 2013
R 120×2, 60×1
I 120×3, 60×1

To obtain the instrumental magnitudes of stars in the observed field, we used the point spread function of Stetson (1987). We transformed the pixel coordinates (X and Y) into right ascension and declination using the astrometry website (https://nova.astrometry.net/).

To transform the VRI instrumental magnitudes into Johnson and Kron-Cousin standard magnitudes, we used the photometric data available in the V-band from Maciejewski & Niedzielski (2008) and in the RI-bands from the USNO-B1.0 catalog (Monet et al. 2003).

The transformation equations for converting the instrumental magnitude in to standard magnitude, are as follows:

V=Vins-0.14±0.039V-R+21.18±0.031

V-R=1.06±0.035V-Rins+0.56±0.022

V-I=0.90±0.036V-Iins+0.85±0.027

The respective errors in zero points and color coefficients are ≈0.03 mag shown in the above transformation equations. The internal errors derived from DAOPHOT are plotted against V magnitude in Figure 2. This figure shows that the average photometric errors are ≤ 0.02 mag at V ≈ 18 th mag, and ≤ 0.1 mag at V ≈ 19 th mag.

Fig. 2 Photometric errors in the V, R, and I bands against V magnitude. 

To compare the photometry, we have cross-identified the stars in our observed data with the American Association of Variable Star Observers (AAVSO) Photometric All-Sky Survey (APASS) DR9 catalog. We have assumed that stars are accurately matched if the difference in position is less than 1 arcsec and, in this way, we have found 32 common stars. The APASS survey is cataloged in five filters B, V, g, r, and i. The range of magnitude in the V band is from 7 to 17 mag (Heden & Munari 2014). The DR9 catalog covers almost about 99 % of the sky (Heden et al. 2016). To obtain the Cousins I band using the Sloan ri photometric bands from the APASS catalog (IAPASS=i-(0.337±0.191) (r-i)-(0.370±.041)), we have adopted the method given by Tadross & Hendy (2016).

The difference indicates that present V and (V-I) measurements are in fair agreement with those of stars given in the APASS catalog. The comparable difference is found as 0.07 in the V band and 0.08 in (V-I) as shown in Figure 3.

Fig. 3 Differences between measurements presented in the APASS catalog and this study for the V magnitude and (V-I) colors. A zero difference is indicated by the solid line.  

2.1. Gaia DR2

The Gaia DR2 (Gaia Collaboration et al. 2018b) database within a 20' radius of the cluster is used for the astrometric analysis. These data consist of positions on the sky α,δ, parallaxes and proper motions (μαcosδ,μδ) with a limiting magnitude of G=21 mag. The errors in photometric magnitudes (G, GBP, and GRP) versus G mag are shown in Figure 4. In this figure, we find the mean errors in the G band are 0.01mag while the mean errors in the GBP and GRP bands are 0.1mag at 20 mag. The proper motions with their respective errors are plotted against G magnitude in Figure 5. The uncertainties in the corresponding proper motion components are 0.06mas yr-1 (for G15mag), 0.2mas yr-1 (for G17mag), and 1.2mas yr-1 (for G20mag).

Fig. 4 Photometric errors in the Gaia bands (G, BP, and RP) against G magnitude. 

Fig. 5 Plot of proper motions and their errors versus G magnitude. 

3. PROPER MOTION STUDY AND MEMBERSHIP PROBABILITIES OF STARS

The proper motion of a cluster is a change in its angular position with time as seen from the center of mass of the Solar System. Proper motions play an influential role to eliminate non-members from the cluster’s main sequence (Yadav et al. 2013; Bisht et al. 2020a). We have cross-matched our observational data in VRI bands and data from the Gaia DR2 catalog. A circle of 0.6 mas/yr around the cluster center in the VPD characterizes our membership criteria as shown in Figure 6. The chosen radius in the VPD is a compromise between losing members with poor proper motions and including field stars.

Fig. 6 Vector point diagram. The circle defines the cluster region of IC 1434 within a radius of 0.6 mas/yr. The color figure can be viewed online. 

The OCs are highly contaminated by a large number of foreground/background stars especially towards the fainter end of the main sequence. Vasilevskis et al. (1958) have set up a mathematical model to obtain membership probabilities of stars using proper motion data. A revised technique was developed by Stetson (1980) and Zhao & He (1990) to check the membership of stars in OCs based on proper motions. To find the membership probability of stars towards the region of IC 1434, we have adopted the criteria of Kharchenko et al. (2004). This method has been previously used by Bisht et al. (2018) for OCs Teutsch 10 and Teutsch 25. Hendy (2018) used this method for the open cluster FSR 814. The kinematical probability of stars is expressed as:

Pk=e-0.25μx-μx¯2σx2+μy-μy¯2σy2,

where σx2=σμx2+σμx¯2 and σy2=σμy2+σμy¯2. Here μx and μy are the proper motion of a particular star, while σμx and σμy are the corresponding errors. The μx¯ and μy¯ are the mean values of the proper motions, while σμx¯ and σμy¯ are their corresponding standard deviations. Using the above method, we identified possible members of IC1434 if their membership probability was higher than 60% which can be seen in Figure 7.

Fig. 7 Membership probability histogram of stars for IC 1434. We considered stars with a probability 0.6 as cluster members. The color figure can be viewed online. 

We used only probable cluster members to estimate the mean value of proper motions and parallax of IC 1434. We fitted Gaussian profile to the construct histograms shown in Figure 10. We obtained the mean-proper motion of IC 1434 as -3.89±0.19 and -3.34±0.19 mas yr-1 in RA and DEC directions, respectively. We determined the mean value of the parallax as 0.30±0.11 mas. Our findings are very close to the values given by Cantat-Gaudin et al. (2018).

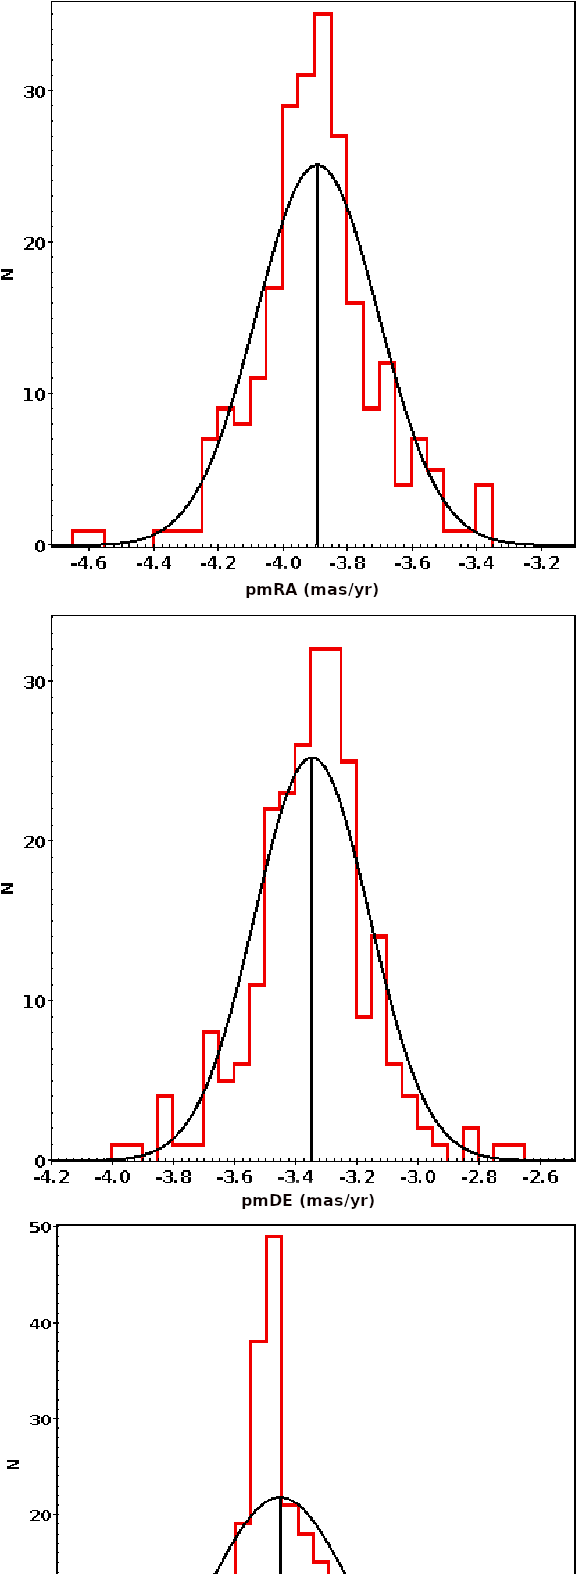
Fig. 8 Histogram to determine the mean values of proper motions in RA and DEC (top and middle panels). Histogram to find the mean parallax (bottom panel). The Gaussian function fits to the central bins provide the mean values in proper motion and parallax shown in each panel. The color figure can be viewed online.  

Fig. 9 Proper motion components and parallax distribution of most probable members (red dots) and all stars (gray dots) against G band magnitude. The horizontal line indicates the mean value of proper motion and parallax. The color figure can be viewed online. 

Fig. 10 Profiles of stellar counts across cluster IC 1434. Gaussian fits have been applied. The center of symmetry about the peaks of right ascension and declination is taken to be the position of the cluster center. The color figure can be viewed online. 

Finally, we considered a star as a most probable member if it lies within a 0.6 mas/yr radius in the VPD, having a membership probability higher than 60% and a parallax within 3σ from the mean parallax of the cluster IC 1434. In Figure 9, we plot the proper motions and parallax distribution of the most probable members (denoted by red dots) and of all observed stars (denoted by gray dots) against G magnitude. In this figure, the horizontal solid line indicates the mean value of the proper motions and parallaxes.

4. STRUCTURAL PROPERTIES OF IC 1434

4.1. Spatial Structure: Radial Density Profile

The accuracy of the central coordinates is very important for the reliable estimation of the cluster’s main fundamental parameters (e.g., age, distance, reddening, etc.). We applied a star-count technique to obtain the center coordinates towards the area of IC 1434. The resulting histograms in both the RA and DEC directions are shown in the left panel of Figure 10. The Gaussian curve-fitting at the central zones provided the center coordinates as α=332.612±0.06deg (22h10m26.8s) and δ=52.84±0.04deg (5250'24''). These estimated values are in very good agreement with the values given by Dias et al. (2002) and Cantat-Gaudin et al. (2018).

The radial density profile (RDP) is plotted in Figure 11 to estimate the radius of the cluster. We divided the observed area of IC 1434 into several concentric rings. The number density, Ri, in the ith zone is determined by using the formula Ri = NiAi, where Ni is the number of stars and Ai is the area of the ith zone. This RDP flattens at R7.6arcmin and begins to merge with the background density, as clearly shown in the right panel of Figure 11. Therefore, we consider 7.6 arcmin as the cluster radius. A smooth continuous line represents the fitted King (1962) profile:

fr=fbg+f01+r/rc2

where rc, f0, and fbg are the core radius, central density, and the background density level, respectively. By fitting the King model to RDP, we estimated the structural parameters of IC 1434 and list them in Table 2.

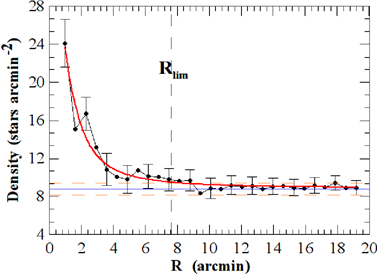
Fig. 11 Surface density distribution of the cluster IC 1434. Errors are determined from sampling statistics 1N, where N is the number of stars used in the density estimation at that point. The smooth line represents the fitted profile whereas the dotted line shows the background density level. Long and short dash lines represent the errors in the background density. The color figure can be viewed online. 

TABLE 2 STRUCTURAL PARAMETERS OF IC 1434* 

Name f0 fb Rc c δc
IC 1434 23.70 ±3.49 8.78 ±0.21 1.25 ±0.19 0.78 3.7

*Background and central densities are given in units of stars per arcmin2. Core radius (r c ) is given in arcmin.

We estimated the concentration parameter using equation c=logrlimrc, as given by Peterson & King 1975). In the present study, the concentration parameter was found to be 0.78 for IC 1434. Maciejewski & Niedzielski (2007) reported that Rlim may vary for individual clusters from 2Rc to 7Rc. The estimated value of Rlim (6.1Rc) shows a fair agreement with the Maciejewski & Niedzielski (2007) value. We obtained the density contrast parameter (δc=1+f0/fbg) for IC 1434 as 3.7. It is lower than the range 7δc23 derived by Bonatto & Bica (2009). This demonstrates that IC 1434 is a sparse cluster.

4.2. Age and Distance Estimation Using the CMD

Age and distance are important parameters to trace the structure and chemical evolution of the Milky Way Galaxy using OCs (Friel & Janes 1993). The (G, BP-RP), and (V, V-I) color magnitude diagrams (CMDs) are shown in Figure 12. In this figure, filled dots stand for the most probable cluster members with membership probability 60% while open circles stand for the ones matched with the catalog of Cantat-Gaudin et al. (2018). The age of IC 1434 was estimated by fitting the theoretical isochrones of Marigo et al. (2017) with a metallicity of Z=0.0152 to the CMDs, as shown in Figure 12. In this figure, we used the isochrones of different ages, log(age) = 8.75, 8.80 and 8.85. We found the best global fit at log(age)=8.80, which corresponds to a cluster age of 631±73 Myr.

Fig. 12 Isochrone fitting to the CMDs. The curves are the solar metallicity isochrones taken from Marigo et al. (2017) for log(age) = 8.75, 8.80, and 8.85. The filled and open circles are our 238 members and the 127 members of Cantat-Gaudin et al. (2018), respectively. The color figure can be viewed online. 

Our estimated value of the color-excess in the Gaia bands EBP-RP is 0.43 mag from the isochrone fitting to the CMD’s. We calculated the interstellar reddening EB-V as 0.34 mag using the transformation equations (EB-V= 0.785 EBP-RP) as taken from Abdelaziz et al. (2020). The distance modulus (m-MG=12.51 mag) of IC 1434 provides the heliocentric distance as 3.2±0.1kpc. Our estimated values of EB-V and distance modulus are in fair agreement with the values EB-V=0.49 and m-MG=12.43 obtained by Angelo et al. (2020).

We obtained the Galactocentric distance as 9.4±0.1kpc by assuming an 8.3 kpc distance of the Sun to the Galactic center. The Galactocentric coordinates are estimated as X=-0.55±0.04kpc, Y=3.1±0.2kpc and Z=-0.15±0.010kpc. The estimated values of the Galactocentric coordinates are very close to the values obtained by Cantat-Gaudin et al. (2018).

We also checked the distance of IC 1434 using the parallax of stars from the Gaia DR2 catalog. We found the distance of this object to be 3.3 kpc, which is very close to our estimation from the isochrone fitting method. Angelo et al. (2020), Cantat-Gaudin (2020), Kharchenko et al. (2013), and Tadross (2009) have determined distance values for IC 1434 of 3.1, 3.3, 3.2, and 3.0 kpc, respectively. Our derived value of the distance is in good agreement with Angelo et al. (2020), Cantat-Gaudin (2020), and Kharchenko et al. (2013). The distance estimation of IC 1434 by Tadross (2009) is based on 2MASS and NOMAD data. Our obtained value of the distance is more precise than that of Tadross (2009) because our estimation is based on good quality optical data along with the high precision Gaia DR2 astrometry.

5. CONCLUSIONS

We presented a photometric and kinematic study of the poorly studied open cluster IC 1434 using CCD VRI and Gaia DR2 data. We estimated the membership probabilities of stars towards the region of IC 1434 and found 238 members with a membership probability 60%. We used those probable members to derive the fundamental parameters. The main results of the current investigation are as follows:

  • The updated cluster center coordinates are estimated as: α=332.612±0.06 deg (22h10m26.8s) and δ=52.84±0.04 deg (5250'24'') using the most probable cluster members. The cluster radius is obtained as 7.6 arcmin using the radial density profile.

  • On the basis of the vector point diagram and membership probability estimation of stars, we identified 238 most probable cluster members for IC 1434. The mean PM of the cluster is estimated as -3.89±0.19 and -3.34±0.19mas yr-1 in the RA and DEC directions, respectively.

  • The distance to the cluster IC 1434 is determined as 3.2±0.1 kpc. This value is well supported by the distance estimated using the mean parallax, 3.3 kpc. The age is estimated as 631±73 Myr by comparing the cluster CMD with the theoretical isochrone given by Marigo et al. (2017) with Z=0.0152.

The authors are thankful to the anonymous referee for useful comments, which improved the contents of the paper significantly. This work is supported by the IMHOTEP collaboration program No. 42088ZK between Egypt and France. D. Bisht is supported by the Natural Science Foundation of China (NSFC-11590782, NSFC-11421303). This work made use of data from the European Space Agency (ESA) mission Gaia (https://www.cosmos.esa.int/gaia), processed by the Gaia Data Processing and Analysis Consortium (DPAC, https://www.cosmos.esa.int/web/gaia/dpac/consortium). Funding for the DPAC has been provided by national institutions, in particular the institutions participating in the Gaia Multilateral Agreement. This work made use of TOPCAT (http://www.starlink.ac.uk/topcat). It was developed mostly in the UK within various UK and Euro-VO projects (Starlink, AstroGrid, VOTech, AIDA, GAVO, GENIUS, DPAC) and under PPARC and STFC grants. Its underlying table processing facilities were provided by the related packages STIL and STILTS. This research made use of the Vizier catalogue access tool, CDS, Aladin Sky Atlas developed at CDS, Strasbourg Observatory, France. This work made use of data from the American Association of Variable Star Observers (AAVSO) Photometric All-Sky Survey (APASS) DR9 catalog.

REFERENCES

Abdelaziz, A. E., Hendy, Y. H. M., Shokry, A., et al. 2020, RMxAA, 56, 245 [ Links ]

Angelo, M. S., Santos, J. F. C., & Corradi, W. J. B. 2020, MNRAS, 493, 3473 [ Links ]

Bisht, D., Ganesh, S., Yadav, R. K. S., et al. 2018, AdSpR, 61, 517 [ Links ]

Bisht, D., Yadav, R. K. S., Ganesh, S., et al. 2019, MNRAS , 482, 1471B [ Links ]

Bisht, D., Zhu, Q., Yadav, R. K. S., et al. 2020a, MNRAS , 494, 607-623 [ Links ]

Bisht, D., Elsanhoury, W. H., Zhu, Q., et al. 2020b, AJ, 160, 119B [ Links ]

Bonatto, C. & Bica, E. 2009, MNRAS , 397, 1915 [ Links ]

Cantat-Gaudin, T., Jordi, C., Vallenari, A., et al. 2018, A&A, 618, 93 [ Links ]

Cantat-Gaudin, T., Anders, F., & Castro-Ginard, A. 2020, A&A , 640, 1 [ Links ]

Chen, L., Hou, J. L., & Wang, J. J. 2003, AJ, 125, 1397 [ Links ]

Dias, W. S., Alessi, B. S., Moitinho, A, et al. 2002, A&A , 389, 873 [ Links ]

Friel, E. D. & Janes, K. A. 1993, A&A , 267, 75 [ Links ]

Friel, E. D. 1995, ARA&A , 33, 381F [ Links ]

Gaia Collaboration, Prusti, T, de Bruijne , et al. 2016a, A&A , 595, 1 [ Links ]

Gaia Collaboration, Brown, A. G. A., Vallenari, A., et al. 2016b, A&A , 595, 2 [ Links ]

Gaia Collaboration, Babusiaux, C., van Leeuwen, F., et al. 2018a, A&A , 616, 10 [ Links ]

Gaia Collaboration, Brown, A. G. A., Vallenari, A., et al., 2018b, A&A , 616, 17 [ Links ]

Gao, X.-h. 2018, PASP, 130, 124101 [ Links ]

Henden, A. & Munari, U. 2014, CoSka, 43, 518 [ Links ]

Henden, A. A., Templeton, M., Terrell, D., et al. 2016, VizieR Online Data Catalog: II/336 [ Links ]

Hendy, Y. H. M. 2018, NRIAG Journal of Astronomy and Geophysics, 7, 180 [ Links ]

Janes, K. & Adler, D. 1982, ApJS, 49, 425 [ Links ]

Janes, K. A. & Phelps, R. L. 1994, AJ, 108, 1773 [ Links ]

Jordi, C., Gebran, M., Carrasco, J. M., et al. 2010, A&A , 523, 48 [ Links ]

Kharchenko, N. V., Piskunov, A. E., Röser, S., Schilbach, E., & Scholz, R.-D. 2004, AN, 325, 740 [ Links ]

Kharchenko, N. V., Piskunov, A. E., Schilbach, E., Röser, S., & Scholz, R.-D. 2013, A&A , 558, 53 [ Links ]

King, I. 1962, AJ, 67, 471 [ Links ]

Marigo, P., Girardi, L., Bressan, A., et al. 2017, ApJ, 835, 77 [ Links ]

Maciejewski, G. & Niedzielski, A. 2007, A&A , 467, 1065 [ Links ]

______. 2008, AN, 329, 602 [ Links ]

Meynet, G., Mermilliod, J.-C., & Maeder, A. 1993, A&AS, 98, 477 [ Links ]

Monet, D. G., Levine, S. E., Canzian, B., et al. 2003, AJ, 125, 984 [ Links ]

Peterson, C. J. & King, I. R. 1975, AJ, 80, 427 [ Links ]

Phelps, R. L. & Janes, K. A. 1993, AJ, 106, 1870 [ Links ]

Rangwal, G., Yadav, R. K. S., Durgapal, A., Bisht, D., & Nardiello, D. 2019, MNRAS , 490, 1383 [ Links ]

Salgado, J., González-Núñez, J., Gutiérrez-Sánchez, R., et al. 2017, A&C, 21, 22 [ Links ]

Salpeter, E. E. 1955, ApJ , 121, 161 [ Links ]

Sandage, A. 1988, BAAS, 20, 1037 [ Links ]

Spitzer, L. J. & Hart, M. M. 1971, ApJ , 164, 399 [ Links ]

Stetson, P. B. 1980, AJ, 85, 387 [ Links ]

______. 1987, PASP, 99, 191 [ Links ]

______. 1992, ASPC 25, Astronomical Data Analysis Software and Systems, ed. D. M. Warrall, Ch. Biemesderfer, & J. I. Barnes, 297 [ Links ]

Tadross, A. L. 2009, New Astronomy, 14, 200 [ Links ]

Tadross, A. L. & Hendy, Y. H. M. 2016, JKAS, 49, 53 [ Links ]

Tadross, A. L., Bendary, R., Hendy, Y., & Bonaltu, Ch. 2018, AN, 339, 698 [ Links ]

Twarog, B. A., Ashman, K. M., & Anthony-Twarog, B. J. 1997, AJ, 114, 2556 [ Links ]

Vasilevskis, S., Klemola, A., & Preston, G. 1958, AJ, 63, 387 [ Links ]

Yadav, R. K. S., Sariya, D. P., & Sagar, R. 2013, MNRAS , 430, 3350 [ Links ]

Zhao, J. L. & He, Y. P. 1990, A&A , 237, 54 [ Links ]

Received: November 21, 2020; Accepted: June 11, 2021

D. Bisht: Key Laboratory for Researches in Galaxies and Cosmology, University of Science and Technology of China, Chinese Academy of Sciences, Hefei, Anhui, 230026, China (dbisht@ustc.edu.cn).

Y. H. M. Hendy: Astronomy Department, National Research Institute of Astronomy and Geophysics (NRIAG), Helwan, Cairo, Egypt (y.h.m.hendy@gmail.com).

Creative Commons License This is an open-access article distributed under the terms of the Creative Commons Attribution License