


 nova página do texto(beta)
 Inglês (pdf)
 Artigo em XML
 Referências do artigo
 Enviar este artigo por email
 Citado por SciELO
  Similares em
SciELO
Similares em
SciELO 
 Permalink
1.Introduction
For a long time, the study of active galactic nuclei (AGNs) has been an important subject in the galaxy field (Dressler et al. 1985; Miller et al. 2003; Hwang et al. 2012; Worpel et al. 2013; Capelo et al. 2017; Chen et al. 2018; Koulouridis & Bartalucci 2019; Zou et al. 2019). Dressler et al. (1985) and Miller et al. (2003) investigated the local environmental dependence of the presence of active galactic nuclei (AGNs). Hwang et al. (2012) explored the environmental effects on the activity in galactic nuclei by comparing galaxies in clusters and in the field. Worpel et al. (2013) examined the hypothesis that mergers and close encounters between galaxies can fuel AGNs by increasing the rate at which gas accretes toward the central black hole. Capelo et al. (2017) investigated the simultaneous triggering of AGN in merging galaxies, using a large suite of high-resolution hydrodynamical simulations. Chen et al. (2018) studied how to quantify the systematic differences resulting from using different stellar population models (SPM) in the optical spectroscopic identification of Type II AGNs. Zou et al. (2019) confirmed the prediction of the unified model of AGNs. Koulouridis & Bartalucci (2019) studied the distribution of X-ray detected AGNs in the five most massive and distant galaxy clusters in the Planck and South Pole Telescope (SPT) surveys.
Some studies demonstrated that galaxies in low-density environments are generally younger than galaxies in high-density environments (e.g., Proctor et al. 2004; Mendes de Oliveira et al. 2005; Thomas et al. 2005; Gallazzi et al. 2006; Rakos et al. 2007; Reed et al. 2007; Wegner & Grogin 2008; Smith et al. 2012; Deng 2014). For example, Proctor et al. (2004) and Mendes de Oliveira et al. (2005) reported that the member galaxies of compact groups are generally older than field galaxies. Smith et al. (2012) explored the variation in stellar population ages for Coma cluster galaxies as a function of projected cluster-centric distance, and found that the average age of dwarfs at the 2.5 Mpc limit of their sample is approximately half that of dwarfs near the cluster centre. Using two volume-limited Main galaxy (Strauss et al. 2002) samples of the SDSS, Deng (2014) examined the environmental dependence of galaxy age, and concluded that old galaxies exist preferentially in the densest regions of the universe, while young galaxies are located preferentially in low density regions. The above-mentioned conclusion is consistent with the current hierarchical assembly paradigm, which predicts a younger age of galaxies in lower density environments (e.g., Lanzoni et al. 2005; De Lucia et al. 2006).
The stellar mass of galaxies also strongly depends on environments. Kauffmann et al. (2004) observed that the stellar mass distribution of galaxies shifts by almost a factor of two towards higher masses between low and high density regions. Li et al. (2006) reported that more-massive galaxies cluster more strongly than less-massive galaxies. Deng et al. (2011, 2012) demonstrated that high mass galaxies exist preferentially in the densest regions of the universe, while low mass galaxies are located preferentially in low density regions. Poudel et al. (2016) showed that the elliptical satellite galaxies are generally more massive in high-density environments. Etherington et al. (2017) examined the environment components of the galaxy stellar mass function for the redshift range 0.15 < z < 1.05. For z < 0.75, Etherington et al. (2017) found that the fraction of massive galaxies is larger in high-density environment than in low-density environments.
As is well-known, galaxies in a dense environment have suppressed star formation rates (SFRs) (e.g., Balogh et al. 1998; Hashimoto et al. 1998; Lewis et al. 2002; Gómez et al. 2003; Tanaka et al. 2004; Patel et al. 2009). Some authors compared star formation in cluster galaxies with that in field galaxies (e.g., Balogh et al. 1997, 1998; Hashimoto et al. 1998; Lewis et al. 2002), and found that the mean SFR in cluster galaxies is always less than the one in field galaxies. Gómez et al. (2003) also showed that the SFR of galaxies strongly depends on the local (projected) galaxy density. Lewis et al.(2002) believed that the low star formation rates well beyond the virialised cluster can rule out severe physical processes, such as ram pressure stripping of disk gas (Gunn & Gott 1972). In the apparent-magnitude limited Main galaxy sample (Strauss et al. 2002) of the SDSS, Deng et al. (2012) demonstrated a strong environmental dependence of the SFR of galaxies in nearly all subsamples with a redshift binning size of Δz= 0.01. Patel et al.(2009) even observed that the SFR of galaxies at
There is a close correlation between stellar velocity dispersion and masses of supermassive black holes (BHs) at galaxy centers (Botte et al. 2005; Greene & Ho 2006a-b; Hu 2008), which showed that stellar velocity dispersion also is a fairly important galaxy parameter. In the Main galaxy sample (Strauss et al. 2002) of the SDSS, Deng (2015) found that the stellar velocity dispersion of galaxies strongly depends on their local environments: galaxies with large stellar velocity dispersion tend to reside in the dense regions of the universe, whereas galaxies with small stellar velocity dispersion tend to reside in low-density regions.
The primary goal of this study is to explore the environmental dependence of age, stellar mass, SFR and stellar velocity dispersion of active galactic nucleus (AGN) host galaxies. The outline of this paper is as follows. In § 2, we describe the AGN host galaxy sample. We present statistical results in § 3. Our main results and conclusions are summarized in § 4.
To calculate the distance, we used a cosmological model with a matter density of Ω0 =0.3, a cosmological constant of
2.Data
Data Release 12 (DR12) (Alam et al. 2015) of the SDSS is the final public release of spectroscopic data from the SDSS-III BOSS. In this work, the data of the Main galaxy sample (Strauss et al. 2002) were downloaded from the Catalog Archive Server of SDSS Data Release 12 (Alam et al. 2015) by the SDSS SQL Search (with SDSS flag: LEGACY_TARGET1 & (64 | 128 | 256) > 0). We extracted 631968 Main galaxies with the spectroscopic redshift 0.02
The galSpecExtra table contains estimated parameters for all galaxies in the MPA-JHU spectroscopic catalogue. BPT classification in this table is based on the methodology of Brinchmann et al. (2004):
All. The set of all galaxies in the sample regardless of the S/N of their emission lines.
SF. The star-forming galaxies. These are the galaxies with S/N > 3 in all four BPT lines that lie below the lower line in Figure 1 of Brinchmann et al. (2004). This lower line is taken from equation (1) of Kauffmann et al. (2003).
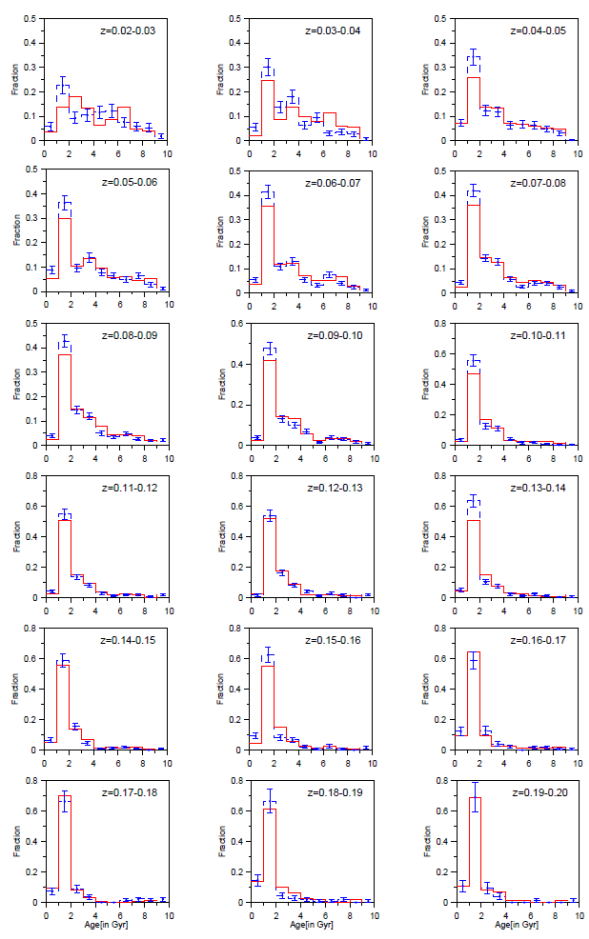
Fig. 1 Age distribution at both extremes of the density in different redshift bins: red solid line for the sample at high density, blue dashed line for the sample at low density. The error bars of blue lines are 1 σ Poissonian errors. Error-bars of red lines are omitted for clarity. The color figure can be viewed online.
C. The composite galaxies. They are the objects with S/N > 3 in all four BPT lines that are between the upper and lower lines in Figure 1 of Brinchmann et al. (2004). The upper line has been taken from equation (5) of Kewley et al. (2001).
AGN. The AGN population consists of the galaxies above the upper line in Figure 1 of Brinchmann et al. (2004). This line corresponds to the theoretical upper limit for pure starburst models.
Low S/N AGNs. They have (and S/N > 3 in both lines) (e.g. Kauffmann et al. 2003), and still are classified as an AGN even if their [O III]5007 and/or Hβ have too low S/N. Miller et al. (2003) called such AGNs the “two-line AGNs”.
Low S/N SF. The remaining galaxies with S/N > 2 in Hα are considered low S/N star formers.
Unclassifiable. Those remaining galaxies that are impossible to classify using the BPT diagram. This class is mostly made up of galaxies with no or very weak emission lines.
Deng & Wen (2020) selected C, AGN and Low S/N AGN populations and constructed an apparent magnitude-limited AGN sample which contains 122923 AGN host galaxies. In this work, we use this AGN sample.
3.Statistical results
Following Deng (2012), we measure the projected local density
Figures 1-4 show age, stellar mass, SFR and stellar velocity dispersion distribution at both extremes of the density in different redshift bins for the apparent magnitude-limited AGN sample. As shown by Figures 1-4, these parameters of AGN host galaxies seemingly only have a weak environmental dependence.
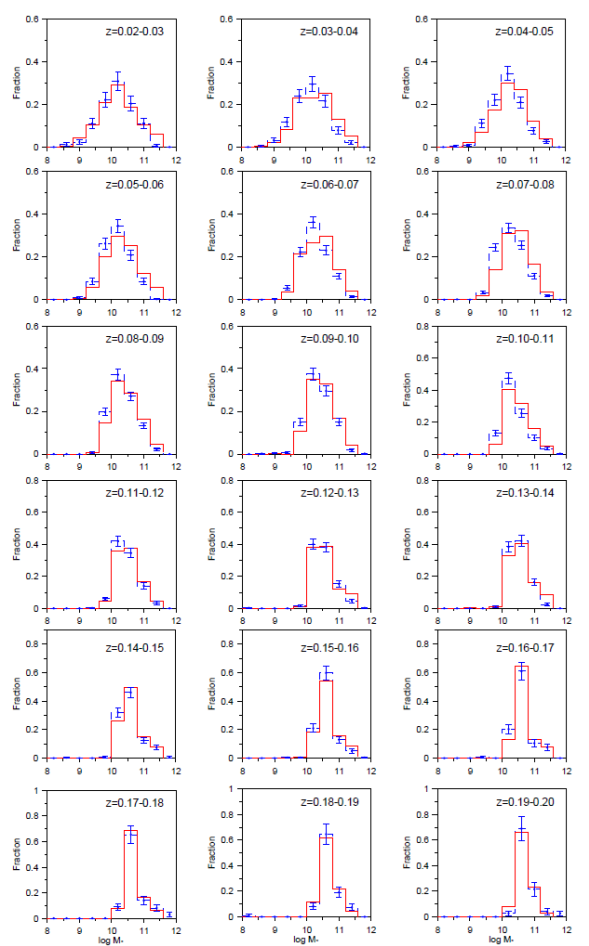
Fig. 2 Same as Figure 1 but for the stellar mass distribution at both extremes of the density in different redshift bins. The color figure can be viewed online.
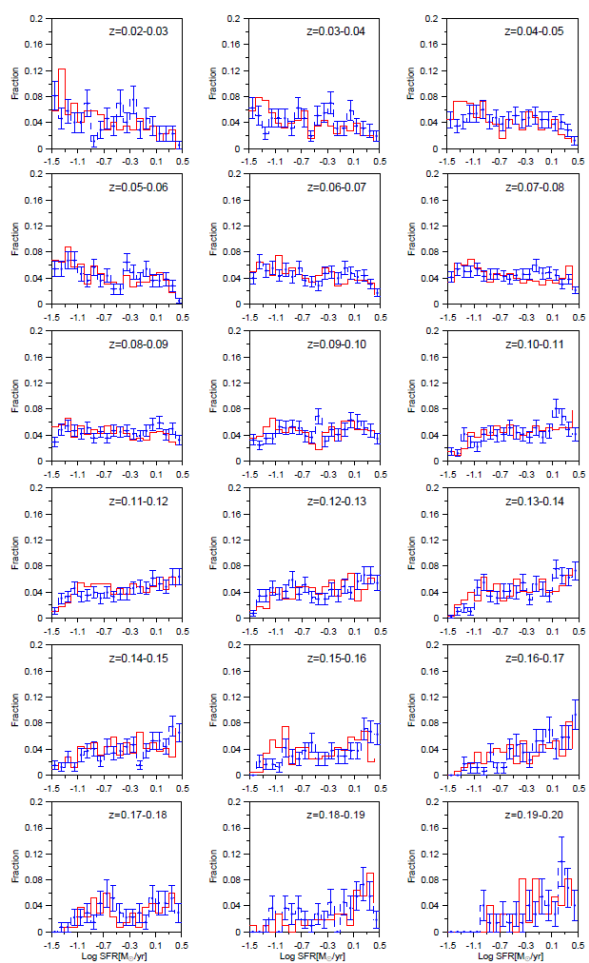
Fig. 3 Same as Figure 1 but for the SFR distribution at both extremes of the density in different redshift bins. The color figure can be viewed online.
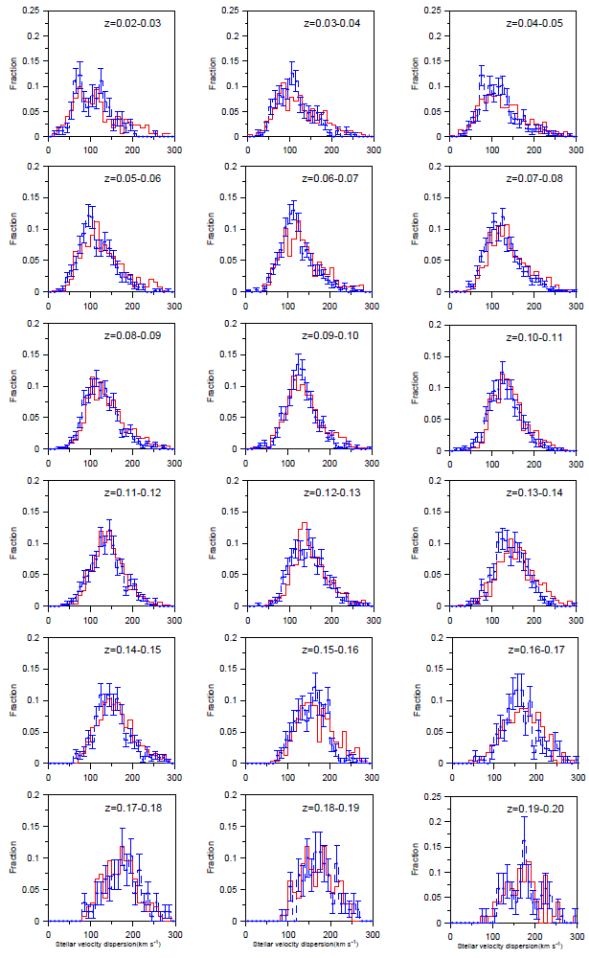
Fig. 4 Same as Figure 1 but for the stellar velocity dispersion distribution at both extremes of the density in different redshift bins. The color figure can be viewed online.
The Kolmogorov-Smirnov (KS) test can serve for a quantitative comparison, which demonstrates the degree of similarity or difference between two independent distributions in a figure by calculating a probability value. A large probability implies that it is very likely that the two distributions are derived from the same parent distribution. Conversely, a low probability implies that the two distributions are different. The probability of the two distributions coming from the same parent distribution is listed in Table 1, which is much larger than that obtained by Deng (2012) (see Table 1 of Deng 2012) and even much larger than 0.05 (5%, is the standard in a statistical analysis). Such a result shows that two independent distributions in these two figures are very similar. This is in good agreement with the conclusion obtained by the histogram figures.
Table 1 K-S probabilities for age, stellar mass, SFR, and stellar velocity dispersion*
| Redshift Bins | Galaxy Number | P(age) | P(mass) | P(SFR) | P(stellar velocity dispersion) |
| 0.02-0.03 | 3433 | 0.183 | 0.693 | 0.231 | 0.0638 |
| 0.03-0.04 | 5105 | 0.000283 | 0.00823 | 0.00169 | 0.0329 |
| 0.04-0.05 | 6281 | 0.156 | 0.00491 | 0.00491 | 0.00370 |
| 0.05-0.06 | 7757 | 0.0300 | 0.000115 | 0.385 | 0.00126 |
| 0.06-0.07 | 10503 | 0.0559 | 0.0002 | 0.0398 | 1.546e-05 |
| 0.07-0.08 | 13062 | 0.0108 | 5.636e-10 | 0.238 | 5.840e-05 |
| 0.08-0.09 | 12860 | 0.0331 | 0.00313 | 0.000881 | 0.00313 |
| 0.09-0.10 | 9824 | 0.0303 | 0.0139 | 0.273 | 0.0617 |
| 0.10-0.11 | 8186 | 0.0373 | 3.914e-05 | 0.865 | 0.0201 |
| 0.11-0.12 | 9109 | 0.389 | 0.0938 | 0.304 | 0.389 |
| 0.12-0.13 | 8136 | 0.863 | 0.580 | 0.131 | 0.0126 |
| 0.13-0.14 | 7650 | 0.000857 | 0.00917 | 0.213 | 0.00198 |
| 0.14-0.15 | 6412 | 0.319 | 0.138 | 0.0627 | 0.0627 |
| 0.15-0.16 | 4787 | 0.0326 | 0.0423 | 0.00776 | 0.00567 |
| 0.16-0.17 | 3445 | 0.991 | 0.693 | 0.287 | 0.231 |
| 0.17-0.18 | 2710 | 0.0959 | 0.918 | 0.129 | 0.446 |
| 0.18-0.19 | 2190 | 0.840 | 0.996 | 0.0313 | 0.840 |
| 0.19-0.20 | 1473 | 0.961 | 0.994 | 0.961 | 0.994 |
*K-S probabilities that two samples at both extremes of the density are drawn from the same distribution.
The redshift range of the AGN sample in this work is the same as one of the apparent-magnitude limited Main galaxy sample of the SDSS used by Deng et al. (2012) and Deng (2015). Using the same method, Deng et al. (2012) demonstrated that there is a strong environmental dependence of the stellar mass, the star formation rate (SFR), the specific star formation rate (SSFR, the star formation rate per unit stellar mass) in nearly all redshift bins of the apparent-magnitude limited Main galaxy sample. Deng et al. (2012) also noted that in the high redshift region, the KS probability of the stellar mass, SFR and SSFR distributions increases considerably with increasing redshift, which means that the environmental dependence of stellar mass, SFR and SSFR becomes weak with increasing redshift.
In order to examine the environmental dependence of the stellar velocity dispersion in local galaxies, Deng (2015) constructed two volume-limited samples with the luminosity -20.5 ≤ Mr ≤ -18.5 and -22.5≤Mr ≤- 20.5, respectively. Considering some drawbacks of volume-limited samples, Deng (2015) also used the apparent-magnitude limited Main galaxy sample. Statistical analyses in these different galaxy samples can reach the same conclusion: galaxies with large stellar velocity dispersions exist preferentially in high density regimes, while galaxies with small stellar velocity dispersions are located preferentially in low density regions.
Deng (2014) demonstrated a strong environmental dependence of galaxy age in two volume-limited Main galaxy samples, but Deng & Wen (2020) reported that in the faint volume-limited AGN host galaxy sample, the environmental dependence of the age is fairly weak. Zheng et al. (2017) presented the stellar age and metallicity distributions for 1105 galaxies on the SDSS-IV MaNGA (Mapping Nearby Galaxies at APO) (Bundy et al. 2015) integral field spectra, and also found that the galaxy age depends on local density. Thus, Deng & Wen (2020) believed that the environmental dependence of the age of AGN host galaxies is likely different from the one of genenal galaxies, which merits further studies.
When exploring an issue, one often used different samples or statistical methods to obtain information about it. Due to the Malmquist bias (Malmquist 1920; Teerikorpi 1997) in the apparent-magnitude limited sample, the averaged luminosity of galaxies dramatically increases with increasing redshift. Following Deng (2012) in order to decrease the effect of the Malmquist bias on statistical results, we divide the apparent-magnitude limited AGN sample into many subsamples with a redshift binning size of Δz =0.01, and focus on a statistical analysis of the subsamples in each redshift bin. Such a method can also explore the variation of the environmental dependence of galaxy properties with redshift. Apparently, each subsample with a redshift binning size of Δz =0.01 likely is limited to a narrow luminosity region. As is well-known, many other parameters of galaxies are closely correlated with the galaxy luminosity (e.g. de Vaucouleurs 1961; Kormendy 1977; Bower et al. 1992; Blanton et al. 2003; Shen et al. 2003; Baldry et al. 2004; Balogh et al. 2004a; Kelm et al. 2005). Thus, many other parameters of these subsamples are also limited, which leads to a decrease of the environmental dependence of these galaxy parameters in these subsamples. However, some works demonstrated that in the redshift bin Δz =0.01, the environmental dependence of galaxy properties can still be observed if it exists (e.g., Deng 2012; Deng et al. 2012). In general, one often constructs the volume-limited galaxy samples in a luminosity region and a redshift limit Zmax, to decrease the Malmquist bias. In such volume-limited galaxy samples, the redshift range is much wider than our redshift bin; the range of other galaxy properties also is fairly large. Thus, one likely sees more apparent environmental dependence of galaxy properties in the volume-limited galaxy samples. If the environmental dependence of these galaxy properties in these subsamples can be apparently observed, it should be stronger in the volume-limited samples constructed by many authors in a luminosity region and a redshift limit Zmax.
4.Summary
In this study, we use the apparent-magnitude limited AGN sample of the SDSS DR12 (Alam et al. 2015) which contains 122923 AGN host galaxies and investigate the environmental dependence of age, stellar mass, SFR and stellar velocity dispersion of active galactic nucleus (AGN) host galaxies. Following Deng (2012), we divide the whole apparent-magnitude limited AGN sample into many subsamples with a redshift binning size of Δz =0.01, and analyse the environmental dependence of galaxy properties of subsamples in each redshift bin. As shown by Figures 1-4, these parameters of AGN host galaxies seemingly have only a weak environmental dependence. We also perform the Kolmogorov-Smirnov (KS) test. The statistical result is in good agreement with the conclusion obtained by the histogram figures.

