


 nueva página del texto (beta)
 Inglés (pdf)
 Artículo en XML
 Referencias del artículo
 Enviar artículo por email
 Citado por SciELO
  Similares en
SciELO
Similares en
SciELO 
 Permalink
1.Introduction
Blazars are a subcategory of the radio-loud active galactic nuclei (AGNs) characterized by a relativistic jet aligned close to the observer’s line of sight . Most of the γ-ray emitting AGNs are blazars with more than 1500 objects known at GeV energies and more than 60 systems known at TeV energies. These galaxies are called AGNs, the most luminous objects in the universe across all wavebands of electromagnetic radiation from radio to γ-rays. The emitted radiation does not originate from the normal stars or thermal interstellar gas. This extreme energy is of non-thermal origin and comes mainly from the central few parsecs of the galaxies (accretion disc around a black hole). This non-thermal emission from AGNs is distinguished by relativistic electrons (v ≈ c) resulting from physical processes such as inverse Compton and synchrotron radiation.
Blazars, on the other hand, are defined as strongly polarized and highly variable compact radio sources, and are separated into (i) BL Lacertae objects (from the name of one of its members, BL Lacertae) and (ii) flat-spectrum radio quasars (FSRQ) based on the strengths of their emission lines. Both of them show very different optical spectra even if, at other wavebands, they are similar. Flat-spectrum radio quasars have strong, broad emission lines at optical wavelengths, while BL Lacs show at most weak emission lines, occasionally display absorption features, and can also be completely featureless. Compact radio cores, flat radio spectra, strong rapid variability, superluminal motion, high-polarization (> 3 percent), and high brightness temperatures, are commonly found in both BL Lacs and FSRQs.
Astronomers initially thought that BL Lacs were stars whose brightness varied, variable stars, and so were given variable star designations. Later, astronomers discovered that BL Lacertae objects were AGNs, and they were a subclass of blazars, hosted by massive elliptical galaxies, the emission of which was controlled by a relativistic jet closely aligned with the line of sight. This successfully interprets their prominent features, like a non-thermal continuum emission across the whole spectrum and strong flux variability in all spectral bands (Massaro et al. 2011). One thing that roughly all AGNs have in common is a strong X-ray component (Elvis et al. 1978).
These objects are characterized by the absence of spectral lines. In general, the most distinctive characteristic of the BL Lacs is the weakness or absence of spectral lines that historically hindered the identification of their nature and thereafter proved to be a hurdle in the determination of their distance. We think the reason for this is a combination of spectral models and insufficiently precise calibration of the instruments. The cause of the lack of emission lines in BL Lacs has been the subject of much debate for the past thirty to forty years. The most commonly used explanation (Blandford & Rees 1978) is that BL Lacs are viewed close to the axis of a relativistic jet. The synchrotron radiation from this jet is Doppler boosted, increasing its intensity so that it swamps the continuum and line emission that would otherwise be visible.
The spectral energy distributions (SED) of BL Lacertae objects appear to be dominated by synchrotron emission at radio to ultraviolet energies (up to X-ray energies for X-ray selected objects) and by inverse-Compton emission at higher energies, and are characterized by two distinct components or humps in the
The study of X-ray variability is useful for understanding the physical mechanisms. found that a single power law model with spectral index ≈ 1.0 provided acceptable fits to the X-ray spectra of more than 20 BL Lac objects observed by the Einstein Observatory. The spectra of many BL Lac objects in the BeppoSAX satellite were well described either by a single power law or by a broken power law (Beckmann et al. 2002).
In recent studies, X-ray spectra of blazars were found at high energies and were better fitted with a log-parabola (LP) model e.g., (Giommi et al. 2002; Donato et al. 2005; Tramacere et al. 2007). The logpar (LP) model was first used by to describe BL Lac objects’ synchrotron emission best, but they did not provide any physical explanation of the model. Later, Massaro et al. (2004a,b, 2006) described the X-ray spectra of BL Lac objects Mrk 421 and Mrk 501 in terms of the curved logpar (LP) model and also expressed this model in terms of statistical particle acceleration by assuming that the probability of an increase in the energy of an emitting particle is a decreasing function of its energy. Through a recent study with the Swift satellite, Wierzcholska & Wagner (2016) found that the logpar model well describes most of the X-ray spectra of TeV-emitting blazars.
In these objects, X-ray and gamma-ray luminosities result from synchrotron radiation and inverse Compton scattering of photons on ultra-relativistic electrons, respectively. Analysis of their variability at high energies is an important method for studying the jet plasma and particle acceleration processes’ dynamics e.g., (Kataoka et al. 2001). Blazar variability is one of the most puzzling cases in the field, because it requires large energy outputs within small physical scales, and these emission regions are very close to the supermassive black hole (SMBH). This paper studies the X-ray properties and spectral variability of three BL Lacertae objects, Mrk 421, Mrk 501, and 1ES1426+428. We use all available Suzaku observations for our samples. We investigate the shapes of the soft spectra of these objects using five models. The properties and variability are investigated in the energy range of keV.
This paper is organised as follows. In § 2, we describe the blazars sample (MRK 421, MRK 501, and 1ES1426+428). In § 3, we describe the X-ray data reduction and analysis of the archival Suzaku observations. In § 4, we focus on results and discussion. Finally, in § 5, we present a summary of this work.
2.Blazars Sample
In this paper, we study the objects Mrk 421, Mrk 501, and 1ES1426+428, hosted by elliptical galaxies at a redshift of z = 0.031, z = 0.033, and z = 0.129, respectively, with apparent magnitudes(v) 14.4, 13.7, 16.95 magnitudes. Mrk 421 and Mrk 501 are brightest high frequency-peaked BL Lac hosts known so far, and they were classified within the high-energy peaked BL Lacertae objects (HBLs) scheme (Rector et al. 2003; Giommi et al. 1995). Also, Mrk 421 and Mrk 501 are massive, luminous, and close elliptical galaxies (Ulrich et al.1975). Most of the extragalactic sources from which and gamma-ray fluxes have been detected belong to the category of HBLs. These sources have higher luminosities than the very high energy (VHE) γ ray energy output, making them the most valuable objects for studying the characteristic spectral and temporal variations in the region of the synchrotron peak of the spectral energy distribution. The object 1ES 1426+428 belongs to this category (HBLs)(Costamante & Ghisellini 2002; Falcone et al. 2004).
Various X-ray instruments have detected these objects: Fermi, ASCA, Chandra, ROSAT, Swift, XMM-Newton, NuSTAR, Suzaku (this paper), BeppoSAX, and EXOSAT, to name just a few. The BL Lacertae objects Mrk 421, Mrk 501, and 1ES1426+428 are strong X-ray sources but confined mainly in the soft part of its X-ray spectrum (Einstein, ROSAT, RXTE, BeppoSAX, Suzaku, and XMM-Newton). These objects are similar to each other in that their lower energy component is in the X-ray band, while the higher energy peaks are in the TeV bands.
2.1.Mrk 421
The Mrk 421 object (RA = 11h04m27.3s; Dec = 38o12´31.8´´), was detected in an ultra-violet survey (Markaryan & Lipovetskii 1972). It is about 397 million light-years (redshift: z = 0.031 corresponds to 122 Mpc) to 434 million light-years (133 Mpc) from the Earth. It was discovered as the first extragalactic object at VHE (Punch et al. 1992). Mrk 421 is one of the blazars closest to Earth, making it one of the brightest BL Lacs in the night sky. Mrk 421 is the brightest blazar at X-ray and UV wavelengths (Brinkmann et al. 2001). It is classified as the high-energy-peaked BLLac object (HBL) because of the synchrotron hump peaks at soft X-rays. Mrk 421 also had an outburst in 2001 and is monitored by the Whole Earth Blazar Telescope project. Due to its brightness (around 13.3, max. ≈ 11.6, and min. ≈16 magnitudes), the object can also be viewed by amateurs with smaller telescopes. The broadband emission observed from blazars spans all wavebands from radio to VHE (E > 100 GeV) γ -rays. Powerful flux variations on different time-scales were observed from many AGNs.
2.2.Mrk 501
Mrk 501 is a BL Lacertae object (RA = 16h53m52.2s; Dec = + 39o45´36.6´´); at z = 0.033, it was first cataloged in an ultraviolet survey (Markaryan & Lipovetskii 1972). It is one of the brightest X-ray sources in the sky and has been observed by RXTE to display significant X-ray variability up to 20 keV (Gliozzi et al. 2006). As previously observed in the X-ray band (Kataoka et al. 1999), it showed a more difficult trend when it was brighter during this campaign.
Mrk 501 emits bright X-rays and very-high-energies; it is the second most observed blazar after Mrk 421. In 2012, nearly 25 instruments took part in a three-month multiwavelength campaign to observe Mrk 501, and this included the FACT, MAGIC, and VERITAS Cherenkov telescopes. Mrk 501 is the third TeV blazar with a known GeV component. Previous multiwavelength observations of Mrk 501 showed well-correlated bursts at X-ray and TeV energies, with no significant activity at GeV energies. The flux of Mrk 501 showed, occasionally, ultrafast variability, and yet we do observe broad emission lines, indicating that it has a massive black hole and a very weak disc. The BL Lacertae object Mrk 501 is an excellent object to study blazar phenomena because it is bright and nearby, which permits significant detections in relatively short observing times at essentially all energy bands.
2.3.1ES1426+428
1ES1426+428 is a BL Lacertae object (RA = 14h28m32.6s; Dec = +42o40´21.05´´), at a comparatively high-redshift (z = 0.129), regarding the other two sources for the study of the absorption of the TeV photon flux, it was first discovered by the high energy astronomy observatories (Wood et al. 1984), in the medium X-ray band (2.0 - 6.0 KeV).
X-ray observations are especially significant for observations of high-peaked BL Lac objects since the synchrotron component’s peak lies in the band covered by X-ray detectors (e.g., Suzaku observations of 1ES1426+428 is an X-ray-selected, high-peaked, BL Lac object with an intense X-ray flux (Remillard et al. 1989). The object 1ES1426+428 is a classical X-ray-selected BL Lac object (Giommi et al. 1995), and one of the six BL Lac objects (out of 26 extragalactic objects) detected in the extreme ultraviolet band with the Extreme UV Explorer (EUV E) (Marshall et al. 1995; Fruscione 1996).
3.Data Reduction and Analysis
3.1.Data Reduction
Our BL Lacertae sample has been targeted by many X-ray satellites. We preferred to use the archival data made by the Suzaku observatory. We used data from Suzaku-XIS due to its excellent detector sensitivity, a wide field of view that allows for good background subtraction, and the ability to continuously track the source. The Suzaku satellite orbit is circular, with a height of 568-km from the Earth, an inclination angle of 31.9o and an orbital period of about 96 minutes. The Suzaku satellite carries four X-ray telescopes sensitive in the 0.2-12.0 keV band (Mitsuda et al. 2007), including CCD cameras in the focal plane, in addition to a nonimaging instrument HXD; (Takahashi et al. 2007), sensitive in the 10.0 -600.0 keV band, composed of a Si-PIN photodiode detector (probing the 10.0-60.0 keV band) and a GSO scintillator detector (sensitive above 30keV). The hard X-ray Detector (HXD) includes a broad energy band of 10.0-700.0. Also, the HXD has such a low background that its sensitivity is higher than any past missions in the hard band. The XIS is an X-ray CCD camera which covers an energy range of 0.2-12.0 keV with typical energy resolution (Koyama et al. 2007). XIS has a high energy resolution, a large effective area, and a low and stable background . Simultaneous observations with the XIS CCD are very effective to constrain the time variability of the broad-band spectrum, which is especially important for active galaxies (Fukazawa et al. 2009).
Objects Mrk 421, Mrk 501, and 1ES1426+428, have been observed with the Suzaku X-ray satellite (Mitsuda et al. 2007), where the object Mrk 421 has three observations and the objects Mrk 501, 1ES1426+428 have two observations; see Table 1. The observations started with Suzaku’s imaging spectrometer (XIS); XIS has CCD devices with three front-illuminated and one back-illuminated CCD cameras at the focal plane of the four X-ray telescopes XRTs; (Serlemitsos et al. 2007), and is sensitive in the energy range 0.2 - 12.0 keV. We downloaded these observations from the Suzaku data archive center. During these observations of the keV blazar, XIS was operated in the 3 x 3 and 5 x 5 observation modes. The high throughput of the telescopes and the instrument’s spectral capabilities allow an uninterrupted temporal and spectral study of the source with unprecedented time resolution. The Suzaku observations of our samples are listed in Table 1. The columns list the object name, in addition to the right ascension, declination, redshift, Obs.ID, observation date, modified Julian date(MJD), and total exposure time.
TABLE 1 THE SUZAKU OBSERVATIONS OF MRK 421, MRK 501, AND 1ES1426+428
| Object | RA | Dec | z | Obs. ID | Obs. Date | MJD | Exposure time |
| yy mm dd | (s) | ||||||
| Mrk 421 | 11h04m27.3s | + 38o 12´ 31.8´´ | 0.031 | 701024010 | 2006-04-28 | 53853 | 30008 |
| 703043010 | 2008-05-05 | 54591 | 136003 | ||||
| 703020010 | 2008-12-03 | 54803 | 87943 | ||||
| Mrk 501 | 16h53m52.2s | + 39o 45´ 36.6´´ | 0.033 | 701027010 | 2006-07-18 | 53934 | 35842 |
| 703046010 | 2009-03-23 | 54913 | 57258 | ||||
| 1ES1426+428 | 14h28m32.6s | + 42o 40´ 21.05´´ | 0.1292 | 701026010 | 2006-06-16 | 53902 | 43069 |
| 703063010 | 2008-06-05 | 54622 | 85058 |
3.2.X-ray Spectra Extraction
Extraction of the data has been done by using FTOOLS (General Package of Software to Manipulate FITS Files ), with the latest version of FTOOLS, 6.26.1, and using version of HEAsoft 6.26.1; the spectral analysis is performed in XSPEC (X-ray spectra analysis package) version 12.10.1p. We also used the HEASOFT software package and Suzaku calibration database (CALDB). The subsequent data reduction includes cleaning hot and flickering pixels, filtering out the high-background periods, which was performed using the tool XSELECT. We also selected good time intervals, except for periods of high background (when the satellite crosses the South Atlantic Anomaly, or when the object is too close to the rim of the Earth). However, we extracted source events in a circle around the source with a radius of ≈ 140 arcsec. We also performed the extraction of background events within a radius of ≈ 140 arcsec from a region devoid of any obvious X-ray sources (see Figure 1).
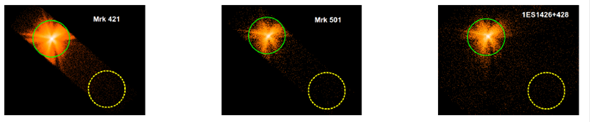
Fig. 1 The source and background regions are marked by solid and dotted circles, respectively. The size of both circles is 140 arcsec. North is up, and east is to the left. The color figure can be viewed online.
Here we have taken the background from the distributed blank sky images in a region corresponding to the one used to extract source counts. The background has been preferably overestimated from the same image in a different location (see Figure 1). Since the background flux is never higher than 10 percent of the source′𝑠 flux, the secular modulation has a negligible effect on the spectral results. As the sources were well centered in the Suzaku observing region, we used corresponding standard response (RMF) matrices by utilizing the tool xisrmfgen, picking the one closest in time to each observation. The auxiliary response files (ARFs) were generated using the tool xissimarfgen. We used the GRPPHA tool for grouping the data to get enough S/N or a suitable number of counts (minimum 50 counts) in each channel.
BL Lacertae objects are very strong variable emitters at all wavebands, especially in the X-ray band. Generaly, the continuum of these systems can be fitted well by a power law
3.3.X-Ray Spectral Analysis
In this section, we perform a spectral fitting of our BL Lacertae in the 0.8 - 10.0 keV band using the XSPEC package. We use X2 statistics for all model fitting and error estimation. The Suzaku-XIS0, XIS1, XIS2 (if available), and XIS3 image of Mrk 421, Mrk 501, and 1ES1426+428 are used in all models. To find the best fitting model, we fitted five different models or combinations. Then, we compared the output of X2 to determine the best. In each fitting process, we determine the X-ray properties of the sample that are provided by the fitting models. The spectral models used in our analysis are described below.
3.3.1.zpower Law Model
Power law (PL) is a simple photon power law. For zpowerlw the formula and corresponding parameters are shown in equation (1).
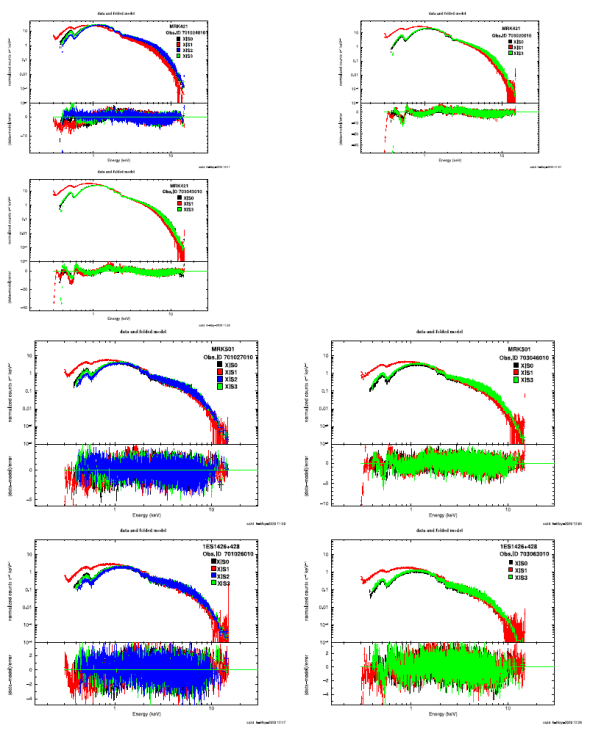
where the parameters E, Γ, z, and K are the photon energy, index of power law (dimensionless), redshift, and normalization (photons/keV/cm2/s at 1 keV), respectively. We performed a simultaneous spectral fitting of XIS0, XIS2 (if available), XIS3, and XIS1 data for each observation. We found that the model is flexible to adjust the parameters for a spectrum as in Table 2. The Suzaku spectrum was fitted with a simple absorbed power law model (constant*phabs*zpowerlaw in XSPEC). This model has been used to fit an X-ray spectrum of various BL Lacertae objects . We found that the spectra can be well fit with a simple power law model (zpowerlaw). Figure 2 shows the fitted spectra extracted from different observations of the three BL Lacertae objects.
TABLE 2 FIT RESULTS FOR A zpowerlw MODEL
| Blazer name | Obs.ID | Index ( |
Normalization (K) | X2dof ( |
| Mrk 421 | 701024010 | 2.08±8.38E-04 | 0.25±2.80E-04 | 10778.92/9298 (1.35) |
| 703043010 | 2.40±5.01E-04 | 0.31±1.74E-04 | 14265.05/9845 (1.54) | |
| 703020010 | 2.41±7.07E-04 | 0.24±1.94E-04 | 14390.64/10528 (1.46) | |
| Mrk 501 | 701027010 | 2.30±2.12E-03 | 3.94E-02±1.05E-04 | 6549.9/6438 (1.02) |
| 703046010 | 2.20±1.96E-03 | 3.95E-02±9.33E-05 | 6259.36/5896 (1.06) | |
| 1ES1426+428 | 701026010 | 2.04±2.40E-03 | 1.97E-02±6.36E-04 | 6524.86/6298 (1.04) |
| 703063010 | 2.37±2.90E-03 | 1.38±4.54E-05 | 7769.39/7769 (1.005) |
3.3.2.zbroken Power Law Model
Bknpower(BPL) is a broken power law and , a redshifted variant. The Suzaku spectrum was fitted with a simple broken power law (zbknpower) model, which is represented as constant*phabs*zbknpower and whose photon spectrum A(E) is expressed in equation (2).
where the parameters E,
3.3.3.zcutoff Power Law Model
The zcutoffpl is a variant which computes a redshifted spectrum using the formula and parameters for the redshifted variant in equation (3).
where E is the photon energy, Γ is the power law photon index, β is the e-folding energy of exponential roll-off (in keV), z is the redshift, and K is the normalization in the unit of photons/keV/cm2/s at 1 keV in the source frame. We used a zcutoff power law model to fit the spectra in the energy range. We therefore substituted the power law component with a cutoff power law (constant*phabs*zcutoffpl in XSPEC). The spectrum was well fitted by a single power law model with an exponential cutoff (zcutoffpl model).
3.3.4.zlogparabolic Model
The logpar (log-parabolic blazar model) is a power law with an index that varies with energy as a log parabola. The zlogpar variant computes a redshifted spectrum (see, for instance, Lloyd-Jones et al. 2004). It is known that the X-ray spectra of many keV HBLs are described well by the zlogpar(logpar) model defined in equation (4). (Massaro et al. 2004a,b; Tramacere et al. 2007).
where the parameters a, b, E0, z, and K are the spectral slope (given by the log-derivative) at the pivot energy E0 = 10.0 keV, curvature term, fixed pivot energy (best near low end of energy range), redshift and normalization, respectively. The zlogpar model has a description of X-ray spectral shapes in HBL-type AGNs (e.g., (Perlman et al. 2005)). An X2 test to the shape d𝑁/dE
3.3.5.(zbremsstrahlung+zpower Law) Model
In this section, we explore the behavior of this model. A (zbremss+zpowerlw) model has been proposed to provide a better description of the parameters of the spectrum at higher energies, better than the power law) with a local index (0.8 -10.0keV) and a plasma temperature KT ≈ 2.44. A (zbremss+zpowerlw) spectrum based on a polynomial fits the numerical values, and includes a choice of redshift. In the regions with higher temperatures, we use (constant*phabs(zbremss + zpowerlw) in XSPEC.
4.Results and Discussion
4.1.X-ray Properties
To determine the X-ray properties of our sample, we fit the extracted spectral described in the previous section by five models that describe the BL Lacertae spectra. We also compare the quality of the fit using the F-test method. The three objects that we have studied are characterized by having intrinsic spectra, which is in favor of the robustness of the model selection, and these objects are common BL Lacertae objects. The X-ray properties of each model are described as follows.
First, using our BL Lacertae objects, we applied the power-law model, and we found photon indices between 2.04 and 2.41, where in the Mrk 421 object, the photon indices change from 2.08 to 2.41 while in Garson III et al. (2010) they change from 2.2 to 2.5. Compared to the results found with Garson III et al. (2010), we found that our parameters are the best-fit parameters for this model(see Table 2), and the X2 value in our sample is better than that of (X2= 3.47). In the Mrk 501 object, the photon indices change from 2.30 to 2.20, while in Sambruna et al. (2000), they change from 2.30 to 1.8, and in 1ES1426+428 they change from 2.04 to 2.37. However, we found that a single power law cannot represent a typical X-ray spectrum of these objects, but consists of multiple components, which are a power law (zpowerlw) component, a broken power law (zbknpower), an exponential cutoff power law (zcutoffpl), a log-parabolic blazar model (zlogpar), and a zbremss+zpowerlw model. Therefore, among the several models that describe the spectra, the one best fitting our data is achieved by five models we selected in XSPEC. We extracted recent results of the parameters and reduced the error rates. After we found that the X-ray spectrum of the sources was well suited to the simple energy law model in the data, we found that the X2 values were greater than the values for the other models, and the model was rejected. However, large values of X2 are partially caused by the XIS’s insufficient calibration rather than by the inappropriate modeling of the spectra.
Second, we used a broken power law (constant*phabs*zbknpower in XSPEC) model for our data. We performed a spectral fit for the sources and the excellent spectrum from 0.8 - 10.0 keV allowed us to make predictions of the X-ray flux. A broken power-law model provides a better representation of the data: X2/dof = 1.1, 1.4,1.3 for Mrk 421 and 1.002, 1.032 for Mrk 501, and 1.023,0.982 for 1ES1426+428, with the photon indices between , 2.14 - 2.40, and 1.91 - 2.55 respectively, and the break photon energy as in Table 3. Compared to the previous results, as in Garson III et al. (2010), Ushio et al. (2010), Acciari et al. (2011), Anderhub et al. (2009) we found the best-fit parameters. The start and the end of the observations for the three sources are as detailed in Table 3. We found that the break energy (E break) ranges from 1.6 to 3 for the observations, which is consistent with previous studies of BL Lacertae objects . We noted that the data could be fitted satisfactorily by a broken power law model.
TABLE 3 FIT RESULTS FOR A zbknpower MODEL
| Blazer name | Obs.ID | Index | Index | ecuacion | Normalization | X2/dof ( |
| Γ1 | Γ2 | (keV) | ||||
| Mrk 421 | 701024010 | 1.99±1.80E-03 | 2.25±3.59E-03 | 2.81±2.54E-02 | 0.25±2.97E-04 | 9432.552/8296 (1.137) |
| 703043010 | 2.32±9.43E-04 | 2.62±2.36E-03 | 2.92±1.35E-02 | 0.30±1.84E-04 | 11807.35/8143 (1.45) | |
| 703020010 | 2.32±1.29E-03 | 2.66±3.54E-03 | 3.007±1.85E-02 | 0.23±2.03E-04 | 9489.396/7266 (1.306) | |
| Mrk 501 | 701027010 | 2.25±4.32E-03 | 2.40±8.73E-03 | 2.63±8.67E-02 | 3.88±1.11E-04 | 6248.472/6236 (1.002) |
| 703046010 | 2.14±3.56E-03 | 2.37±1.02E-02 | 3.20±7.87E-02 | 3.87E-02±9.85E-05 | 5566.608/5394 (1.032) | |
| 1ES1426+428 | 701026010 | 1.91±1.13E-03 | 2.08±4.31E-03 | 1.604.96E-02 | 1.92±7.14E-05 | 6236.208/6096 (1.023) |
| 703063010 | 2.29±5.46E-03 | 2.55±1.36E-02 | 2.87±9.06E-02 | 1.34E-02±4.77E-05 | 4093.958/4169 (0.982) |
Third, we fitted the spectrum of the three objects between 0.8 keV and 10.0 keV and found that the spectrum, modeled with a cutoff power law (constant*phabs*zcutoffpl in XSPEC) model, provided the statistically most favored description of the data in the examined datasets. The high-energy cutoff (High-E-Cut) for our observations = 10.98 - 26.15 keV and the photon index = 1.91 - 2.21. For cutoff power law fits the average reduced X2 is 1.3 for Mrk 421, 1.018 for Mrk 501, and 1.001 for 1ES1426+428, while broken power law fits produced average reduced X2 of 1.29, 1.01, and 1.01 respectively. We note that these values are very close to the best-fit parameters of the broken power law model (see Table 4).
TABLE 4 FIT RESULTS FOR A zcutoffpl MODEL
| Blazer name | Obs.ID | Index | High-E-Cut | Normalization | X2/dof( |
| 𝛤 | (keV) | ||||
| Mrk 421 | 701024010 | 1.91±2.89E-03 | 14.82±0.23 | 0.27±3.41E-04 | 9699.193/8297 (1.169) |
| 703043010 | 2.20±1.69E-03 | 12.20±9.72 | 0.33±2.39E-04 | 11751.792/8144 (1.443) | |
| 703020010 | 2.21±2.42E-03 | 10.98±0.113 | 0.26±2.77E-04 | 9396.231/7267 (1.293) | |
| Mrk 501 | 701027010 | 2.20±7.09E-03 | 24.27±1.58 | 4.09E-02±1.32E-04 | 6255.711/6237 (1.003) |
| 703046010 | 2.06±6.67E-03 | 17.56±0.76 | 4.13E-02±1.16E-04 | 5573.035/5395 (1.033) | |
| 1ES1426+428 | 701026010 | 1.95±8.17E-03 | 26.15±2.02 | 2.03±7.51E-05 | 6273.813/6097 (1.029) |
| 703063010 | 2.19±9.88E-03 | 13.62±0.71 | 1.46E-02±6.19E-05 | 6976.41/7170 (0.973) |
Fourth, besides both broken power law and cutoff power law, we attempted to fit the Suzaku spectra with a log-parabola model, as this model allows the spectral index to vary as a function of energy according to equation 4 The log-parabolic model is characterized only by the parameter β; a good estimate of β can be obtained when its value is small. In several studies, the X-ray spectra are described well with the curved log-parabola model; As in Massaro et al. (2004a), Massaro et al. (2004b), analysed the X-ray spectra for Mrk 421 and Mrk501 and found that the log-parabola model was the best model for characterizing their spectra for different activity states, where the β values varied from 0.341 to 0.48 while in our data they vary from 0.13 to 0.26. In Table 5 all parameters were appropriate simultaneously. Compared to the parameters in Furniss et al. (2015), we find that good fits were produced with the log-parabola model. In BL Lacs the radiation is due to synchrotron radiation and inverse Compton scattering (Maraschi et al. 1999; Tavecchio et al. 2001; Massaro et al. 2004a,b; Lichti et al. 2008; Giommi et al. 2012). Here, the non-thermal emissions from our data can be described by synchrotron radiation (relativistic electrons + magnetic field → weak photons in the radio waveband).
TABLE 5 FIT RESULTS FOR A zlogpar MODEL
| Blazer name | Obs.ID | Normalization | X2/dof( |
||
| Mrk 421 | 701024010 | 2.09 ±8.72E-04 | 0.21 ±3.29E-03 | 4.35 ±4.86E-05 | 9541.55/8297 (1.15) |
| 703043010 | 2.43 ±5.42E-04 | 0.24 ±1.95E-03 | 4.06E-02 ±2.29E-05 | 11890.24/8144 (1.46) | |
| 703020010 | 2.44 ±7.72E-04 | 0.26 ±2.77E-03 | 3.12 ±2.53E-05 | 9883.12/7267 (1.36) | |
| Mrk 501 | 701027010 | 2.32 ±2.23E-03 | 0.13 ±8.19E-03 | 5.42E-3 ±1.51E-05 | 6230.763/6237 (0.999) |
| 703046010 | 2.21 ±2.05E-03 | 0.17 ±7.66E-03 | 5.96E-03 ±1.40E-05 | 5578.43/5395 (1.034) | |
| 1ES1426+428 | 701026010 | 2.05 ±2.47E-04 | 0.13 ±9.35E-03 | 3.401.11E-05 | 6243.328/6097 (1.024) |
| 703063010 | 2.39 ±3.16E-03 | 0.22 ±1.14E-02 | 1.80 ±6.09E-06 | 6990.75/7170 (0.975) |
Fifth, the (zbremss+zpowerlw) model was found to fit the data better in each observation and was therefore used to compute fluxes in various subbands (as in § 4.2). In previous models, we found the parameters and the spectra extracted from our observations well fit with a t model. The values of the photon index (Γ), normalization (K), and KT are listed in Table 6. We found a significantly improved X2 value for these sources when fitting to a (zbremss+zpowerlw) model compared to other models. The spectrum is well represented by a (zbremss+zpowerlw) model (reduced X2 = 1.12, 0.996, 0.972) with photon index Γ = 2.05, 2.28, 2.37.
TABLE 6 FIT RESULTS FOR A zbremss+zpowerlw MODEL
| Blazer name | Obs.ID | Index Γ | KT | Normalization | X2/dof( |
| Mrk 421 | 701024010 | 2.05±5.16E-03 | 2.87±6.98E-02 | 0.19±1.11E-03 | 9291.52/8296 (1.12) |
| 703043010 | 2.42±2.61E-03 | 2.33±2.52E-02 | 0.25±5.58E-04 | 11255.91/8143 (1.37) | |
| 703020010 | 2.45±4.13E-03 | 2.49±3.57E-02 | 0.19±5.81E-04 | 9327.82/7266 (1.27) | |
| Mrk 501 | 701027010 | 2.28±9.66E-02 | 2.03±0.16 | 3.46E-02±4.05E-04 | 6211.056/6236 (0.996) |
| 703046010 | 2.22±1.20E-02 | 3.03±0.21 | 3.27E-02±3.14E-04 | 5555.82/5394 (1.030) | |
| 1ES1426+428 | 701026010 | 1.98±1.48E-02 | 2.07±0.14E-02 | 1.59E-02±3.95E-04 | 6224.016/6096 (1.021) |
| 703063010 | 2.37±1.50E-02 | 2.28±0.17E-02 | 1.12±1.49E-04 | 6968.268/7169 (0.972) |
For all Suzaku observations, the three sources’ X-ray spectra are best represented with a (zbremess+zpowerlw) model. All of the models tested are consistent with the fitting parameters; still, the compared models must be nested, and the null values of the additional parameters should not be on the boundary of the set of possible parameter values, according to Protassov et al. (2002). Therefore, in order to assess the significance of the parameter values, we compared the zpower law model with the (zbremess+zpowerlw) one using an F-test. The F-test gives the probability that the (zbremess+zpowerlw) model that has the smallest reduced X2 is a chance improvement compared to the zpower law model. A statistical F-test using the X2 and degrees of freedom (dof) of the zpower law versus (zbremess+zpowerlw) fit results in F-statistics of the observations corresponding to probabilities of being consistent with the null zpower law hypothesis; see Table 7. The general limit is 10-4. If the F-test gives a value much lower than this limit, then the second model is statistically better than the first (Egron & Jeanne 2013); therefore, in our work, we found F-test values much smaller than this limit as in Table 7.
TABLE 7 F-TEST RESULTS OF COMPARING zbremss+zpowerlw AND zpower law FOR DIFFERENT OBSERVATIONS IN OUR SAMPLES
| Blazer name | Obs.ID | Bremss +PL | DOF2 Bremss+PL | PL | DOF1 PL | F-test | Pnull* |
| Mrk 421 | 701024010 | 9291.52 | 8296 | 10778.92 | 9298 | 1.32 | 2:98 x 10-10 |
| 703043010 | 11255.91 | 8143 | 14265.05 | 9845 | 1.27 | 9:58 x 10-12 | |
| 703020010 | 9327.82 | 7266 | 14390.64 | 10528 | 1.20 | 5:80 x 10-11 | |
| Mrk 501 | 701027010 | 6211.056 | 6236 | 6549.9 | 6438 | 1.68 | 8:64 x 10-9 |
| 703046010 | 5555.82 | 5394 | 6259.36 | 5896 | 1.36 | 5:08 x 10-7 | |
| 1ES1426+428 | 701026010 | 6224.016 | 6096 | 6524.86 | 6298 | 1.45 | 3:23 x 10-5 |
| 703063010 | 6968.268 | 7169 | 7769.39 | 7769 | 1.34 | 1:49 x 10-8 |
*Notes. Pnull is the null hypothesis probability
In this section, we successfully fitted the X-ray spectrum with five models, and we found photon indices between 2.08 - 2.41, 2.2 - 2.3, and 2.04 - 2.37 for Mrk 421, Mrk 501, and 1ES1426+428 respectively. From these models, the change in photon indices appears to be the factor responsible for the spectral change. One of the results in this Section is that the low and high photon indices suggest that electrons form a power-law distribution of energy index ≈ 2, which is expected from the standard shock acceleration theory for both the relativistic and non-relativistic cases (Kirk et al. 2000). By comparing the X2 resulting from the different models, we found that the (zbremss+zpowerlw) has the best values. Therefore, we used this model combination to estimate the flux variability of our sample.
4.2.X-ray Variability
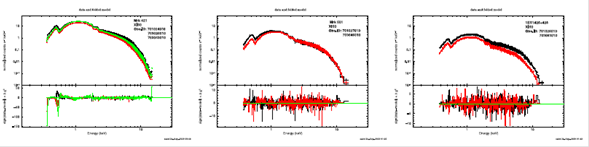
For the three sources of this study we used XIS0 because they are available in all observations. We created the spectrum with the same previous method (§ 3.1), using only XIS0. In the last section, we performed a spectral analysis of keV blazars obtained by Suzaku (see Table 1), where the object Mrk 421 has three observations, and the objects Mrk 501, 1ES1426+428 have two observations each. Since the X-ray spectra of blazars are often fitted to a spectral model involving a power law, a (zbremss+zpowerlw) model was proposed to better describe the blazars spectrum. In § 4.1, we successfully fitted the spectrum by the five models, and we found that the best model is (zbremss+zpowerlw). In order to show the spectral variability we perform the spectral fitting for each observation with this model. We found that the (zbremss+zpowerlw) model well fits all spectra. We derive the X-ray flux and luminosity in the energy range of 0.8 10.0 keV from the fitted spectra and their corresponding errors. The flux values estimated from different observations for each source are compared to check the X-ray variability in our BL Lacertae samples.
The spectral fluxes of the (zbremss+zpowerlw) model significantly change in the three observations of the source Mrk 421 (from 12.11±0.74 to 10.95 ± 0.94, and then to14.01 ± 1.19 x 10⁻¹⁰ erg s-1 cm-2) and in the source Mrk 501 (from 1.85 ± 0.14 to 1.97 ± 0.14 x 10⁻¹⁰ erg s-1 cm-2) for the two observations, and also in the source 1ES1426+428 (from 1.02 ± 0.06 to 0.65 ± 0.05 x 10⁻¹⁰ erg s-1 cm-2 for both observations) see Table 8. The flux variability is obvious in Mrk 421 and 1ES1426+428, where the variation ranges are 3.06 and 0.37 x 10⁻¹⁰ergs-1cm-2, respectively. The fluxes of Mrk 501 derived from the two available observations are comparable within their error ranges. It is apparent that the spectrum changes with each observation; in Figure 3, we plot the spectra for all the observations; perhaps most striking is the fact that the spectral shapes of the objects do not vary significantly, but the photon index and flux change as listed in Table 8, where we summarize the fitting results of each observation. In Mrk 421, compared to previous literature, we found that the ranges are3.06 x ergs-1cm-2, while in they are 2.91 x ergs-1cm-2.
TABLE 8 FIT RESULTS OF DIFFERENT OBSERVATIONS FOR OUR BLAZAR SAMPLES*
| Blazer name | Obs.ID | Obs. Date yy mm dd | Index | Flux erg s-1 cm-2 (10-10) | X-ray lumin erg s-1 (1045) | x2/dof |
| Mrk 421 | 701024010 | 2006-04-28 |
|
1.12 / 8296 | ||
| 703043010 | 2008-05-05 | 1.37 / 8143 | ||||
| 703020010 | 2008-12-03 | 1.27 / 7266 | ||||
| Mrk 501 | 701027010 | 2006-07-18 | 0.996 / 6236 | |||
| 703046010 | 2009-03-23 | 1.030 / 5394 | ||||
| 1ES1426+428 | 701026010 | 2006-06-16 | 1.021 / 6096 | |||
| 703063010 | 2008-06-05 | 0.972 / 7169 |
5.Summary
In this paper we study the X-ray properties and spectral variability of three BL Lacertae objects, Mrk 421, Mrk 501, and 1ES1426+428. To achieve this work, we used all available Suzaku observations for our samples. We investigate the shapes of the soft X-ray spectra of these objects using five models. The X-ray properties and variability are investigated in the energy range of 0.8 - 10.0 keV. We use five spectral models for all available data (for the three objects), and we obtain that the absorbed single power law (constant*phabs*zpowerlaw) model fits our observations well, but the X2 values are greater than in the other of results. During the fitting, events with energy of 0.2 - 0.8keV and 10.0 - 12.0keV were excluded from the XIS data set because these channels were ignored in the spectra. The resulting spectrum was fitted with a (galactic absorption x zpowerlw). The galactic absorption parameter, NH (hydrogen column density), was kept constant at average values of 1.94 x 1020 cm-2 (Mrk 421), 1.41 x 1020 cm-2 (Mrk 501), and 1.14 x 1020 cm-2 (1ES1426+428), acquired from the HI4PI map in the FTOOL. The redshifts of the systems are also fixed at the values in the literature, as listed in Table 1.
As a result of our fitting process, the X-ray properties of our sample were determined from five models, which fit well the BL Lacertae spectra. Comparing the fitting quality resulting from different models applied in our work, we found that the (zbremss+zpowerlw) model is the best one to represent the data. An F-test was applied to compare the adductive (zbremss+zpowerlw) model with the simple one, log-parabola. We also checked the variability of the soft X-ray (0.8 - 10.0 keV) flux in our BL Lacertae sample based on all avilable Suzaku observations. We extracted the spectra in the same way from the same instrument (XIS0) in the same energy band (0.8 - 10.0 keV) for each source. All available X-ray spectra were fitted simultanuosly by the same model to determine the X-ray fluxes and their errors. The estimated fluxes were compared to check their variability. We found that the flux variability ranges are (3.06, 0.12, 0.37) x 10-10 erg s-1 cm-2 for Mrk 421, Mrk 501, and 1ES1426+428, respectively. This yields that the most significant variation was found for Mrk 421.
We would like to thank Suzaku’s team for providing their publicly available feedback and for their efforts in spacecraft operation, instrument calibration, and data processing. We would like to thank Dr. Gamal El Din Hamed for helpful suggestions that improved the paper’s reading. Finally, we would also like to extend our sincere thanks to the reviewer for his/her very useful suggestions and comments, which helped to improve the paper’s quality.

