


 nueva página del texto (beta)
 Inglés (pdf)
 Artículo en XML
 Referencias del artículo
 Enviar artículo por email
 Citado por SciELO
  Similares en
SciELO
Similares en
SciELO 
 Permalink
1. INTRODUCTION
The evolution of stars with 0.9 to 120 M is well described theoretically by Schaller et al. (1992). After leaving the main sequence, they evolve to the right in the Hertzsprung-Russell (H-R) diagram. Then, they pass through the instability strip and evolve toward cooler temperatures. The rate of period change for pulsating variable stars is of great value for establishing both their evolutionary status and their position in the instability strip, as well as for testing stellar evolutionary models (Turner et al. 1998).
SX Phoenicis variables are analogues of Delta Scuti stars and are located below the classical Cepheid variable stars in the instability strip, closer to the main sequence. In general, SX Phoenicis variables have periods ranging between 30 minutes and six hours. SX Phe stars are interesting because they often pulsate in so-called non-radial modes, they have a lower luminosity and are more metal poor than Delta Scuti stars (Frolov,1974).
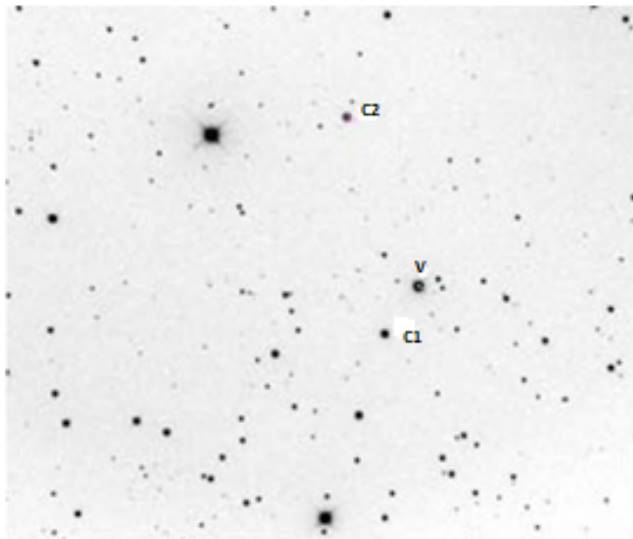
XX Cyg is a Population-II variable star, which has a fundamental radial mode, excited with a high velocity (V )= −108 km/s; Joner 1982); see Figure 1. It has a visual magnitude of V = 11.7 mag with an amplitude in this band of ∆V = 0.80 mag (Kiss and Derakas 2000) and a radial-velocity amplitude of 37 km/s (Joner 1982). Its classification changed from a dwarf Cepheid (Joner 1982, McNamara and Feltz 1980) to the more modern classification as a Population-II SX Phoenicis-type variable star. Our study examines the amplitude stability of XX Cyg and investigates the dependence of the pulsation amplitude on its location within the instability strip.
2. OBSERVATIONS AND DATA REDUCTION
2.1. Observations
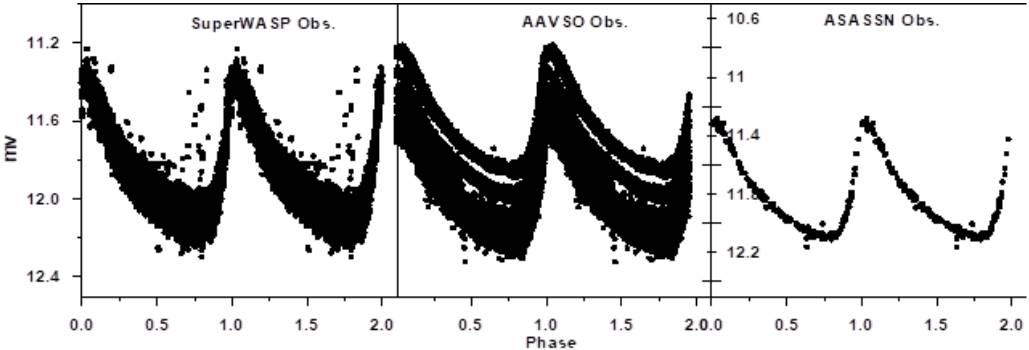
To investigate the variability of our target star (XX Cyg), photometric observations from the archives of the All-Sky Automated Survey for Supernovae (ASAS-SN), Wide Angle Search for Planets (SuperWASP), and American Association of Variable Star Observers (AAVSO) provided new maximum-light times for our target. The data, span a time interval of over 110 years, from the early twentieth century to the present, as shown in the references. We acquired four nights’ observations on September 24/25 and October 8/9, 9/10, and 20/21, 2019, as displayed in Figure 2. The observations were obtained through standard Johnson blue-visible-red (BV R) filters; and the exposure times ranged from 20 to 60 seconds, depending on the atmospheric conditions and background contribution. All observations from the Kottamia Observatory (KAO) were made using a 2048x2048pixel EEV CCD 42-40 camera, cooled by liquid nitrogen and attached to the Newtonian focus of the 1.88-m Kottamia reflector telescope in Egypt. The Kottamia Observatory is located at a latitude of 29°56'02.43'' N, a longitude of 31°49'40.1'' E, and a height of 467 m. Figure 1 shows one of the V -band images of the variable XX Cyg, along with comparison and check stars. The comparison star has coordinates α 2000 = 20h03m18s and δ 2000 = +58°55.6'6.9''. All times were corrected to Heliocentric Julian Date (HJD). Standard data reduction processes (i.e., dark and bias removal, flatfield correction) and aperture photometry have been applied to the present observations, using the free data reduction software (MuniWin) from the website (http://c-munipack.sourceforge.net/). We obtained differential instrumental magnitudes for each filter and constructed the present light curves of the system XX Cyg.

Fig. 2 Differential instrumental magnitude in BVR colors (∆B, ∆V , and ∆R) (a,b,c) and the phases in three colors (d) of XX Cyg. The color figure can be viewed online.
2.2. Methods of Reduction
We used two methods to determine the period and amplitude variations. The first one originated with Hertzsprung (Hertzsprung,1928) and the second one is the Fourier decomposition method. Modern usage of the first method has been described by Berdnikov (1992), Turner and Berdnikov (2001), and Turner (2003). The observed-minus-calculated (O-C) technique is used to study changes in the periods of Cepheids with high accuracy. The phased data were used to construct seasonal light curves, which were matched to a standard light curve to detect phase shifts, indicating a period change. An alternative procedure used by Abdel-Sabour et al. (2015) relies on a set of high-quality light curves as a standard, to which independent data sets are matched in magnitude and phase space using least-squares techniques. In the second method, we use Fourier decomposition (FD) as a tool for variable-star diagnostics. As the light curves of pulsating variable stars are periodic, they can be written as shown in the following equations;
Or
where A i = √(a 2 + b 2),tanΦ i = −b i /a i . Because the period is known from the respective databases, the observation time can be folded into the phase (ϕ i ) (Ngeow et al. 2003).
The relative Fourier parameters are ϕ i1 = ϕ i − iϕ 1 and R i1 = A i /A 1, where i > 0. We used the above equations to calculate the Fourier parameters from 85 light curves of XX Cyg. The combination of coefficients, R i1 and ϕ i1 , where i = 2, 3, 4..., can be used to describe the progression of the light-curve shape, as seen in Figure 5 for the visual amplitude A v . We can also use these coefficients for variable-star classification (Deb and Singh 2009).
3. RESULTS AND DISCUSSION
3.1. O-C Light Curve and Period Change of XX Cyg
Comparing the observed time with the calculated time of maximum brightness (O-C method) is the classical method for studying period changes in variable stars, because it is sensitive to the accumulated effects of the period changes. We used all of the data published in the literature to fill the gaps in the OC diagram. Light curves with a large scatter in the observations were removed from our analysis. i.e. If the scatter in the phased light curve was about the same as the scatter in the raw data (usually about 0.2 mag. or less) we used it in the O-C diagram. All of the maximum-light times used to study the period change of XX Cyg are presented in Figure 4. The computed time of maximum was measured using the linear ephemeris of Szeidl and Mahdy (1981). The time of maximum brightness (HJD Max ) can be modeled as a function of epoch (E) using the following quadratic equation:

Fig. 4 O-C diagram for XX Cyg and the best fitted parabola, plotted as a function of the observed maximum-light epoch (left panel) and the O-C residuals (right). The color figure can be viewed online.
Here, M 0 is a new epoch, P is the new period, and Q is used to measure the period change (dP/dt) in seconds per year given by; dP/dt=(2Q/P)(32,557,600) s/yr. The evolution of the period over time was investigated by means of the classic O-C method and Fourier transforms, as mentioned in the last section. The O-C behavior of XX Cyg was observed from November 1905 to October 2019. A fit to the O-C diagram was made using a quadratic polynomial, which corresponds to a constantly changing period. After analysis, we found the following ephemeris:
The parabolic trend in the O-C data reflects a regular period decrease or increase. From this analysis we find that the period is increasing at a rate of dP/dt = (15.50±1.10)×10−5 s/yr or ([1/P]dP/dt = 1.33 × 10⁻⁸yr−1). Our rate of period change agrees with an earlier estimate by Conidis et al. (2011) (1.337 × 10⁻⁸yr−1.) but differs slightly from Blake, et al. (2003) (1.13×10⁻⁸yr−1) because we used extra data at recent epochs, including our KAO observations.
3.2. Amplitude Variation in XX Cyg
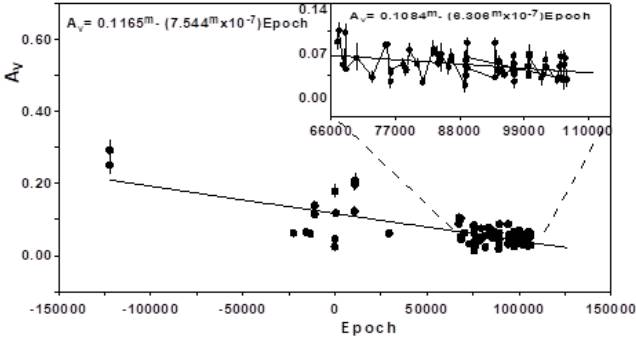
Variations in the amplitude, period, and shape of the light curves are known as the Blazhko Effect. This phenomenon can be seen easily in RR Lyrae variables. A frequency analysis of XX Cyg was performed with a package of computer programs, employing single-frequency (Fourier) and multiple-frequency least-squares techniques (PERIOD04, Breger 1990). The technique fits a number of simultaneous sinusoidal variations in the magnitude domain and does not rely on prewhitening. We analyzed the stellar light curves using the PERIOD04 program and FORTRAN programs to evaluate the Fourier parameters for all available observations. The amplitude behavior in the visible band is presented in Figure 5. Linearly fitting the variations resulted in the following equation: A V = 0.1165 m −(7.544 m ×10−7)Epoch, which indicated a decreasing rate of 0.7 mmag/yr. If we use only our recent observations (E>50000) we find approximately the same results, 0.56 mmag/yr, as presented in Figure 5. The results for the Fourier amplitudes agree with those derived using wavelet analysis by Zhou et al. (2002). These results indicate that there is a relation between pulsation amplitude and rate of period change.
3.3. Ambiguity in the Light Curves
When we tried to test the amplitude stability of our system we noticed a damping in the light curves in some observations, as presented partially in Figure 6, from phase 0.1 to 0.8. These observations are from the SuperWASP Camera#145 on nights 2454613.59, 2454629.565, 2454631.54, 2454632.54, 2454659.46, and 2454660.46. These may be the same light curve bumps described by Blake et al. (2003) and Sadun and Ressler (1986). However, we did not detect the bump in our BVR observations. Also, we failed to observe similar bumps in the other automated surveys (Northern Sky Variability Survey (NSVS), Hipparcos Catalogue (HIP), Kamogata/Kiso/Kyoto Wide-field Survey (KWS), and ASAS SN). The SuperWASP bump detections are significant because the bump amplitudes are more than three times larger than the photometric errors of the dataset. Also, we noticed the positions and effects of the bumps changes with phases. i.e. a smaller bump with a dip of amplitude approximately 0.1 magnitude, which peaks at a phase of 0.15 and a larger bump occurring with ascending phases towards the brightness minimum (as seen at one phase in Figure 6). This damping in the light curve or bump in phase may be a result of magnetic activity or shock waves (Gillet, D. 1988, Balona et al. 2015).

4. ABSOLUTE PARAMETERS OF SYSTEMXX CYG
Spectroscopic observations are an important source for estimating physical parameters. At present, no spectroscopic observations are available for XX Cyg except for the radial velocities reported by Joner (1982), which yield a mean RV of −108 km/s. So, the absolute parameters cannot be determined directly. Therefore, we used simple approximation formulae (Harmanec, 1988), which relate the effective temperature to other basic physical parameters (mass, radius, luminosity, and bolometric magnitude).
4.1. Physical Parameters and Evolutionary State of XX Cyg
If the effective temperature (T
eff
) and bolometric magnitude (M
bol
) are known, as well as the period and pulsation mode, the pulsation mass
(M
puls
) follows directly from the fundamental equation of stellar pulsation,
Q = √(M/R
2), where P is the period in days,
M and R are the mass and radius in solar
units, respectively, and Q is the pulsation constant. The
physical parameters, absolute magnitude (M
V
), relative radius (/
TABLE 1 PHYSICAL PARAMETERS: MASS, LUMINOSITY, RADIUS, BOLOMETRIC MAGNITUDE, STELLAR GRAVITY, AND AGE OF XX CYG
| Ref. |
|
|
|
|
|
Age(yr) |
|---|---|---|---|---|---|---|
| Our results | 1.955 | 1.038 | 1.944 | 1.688 | 4.086 | 0.949 |
| (0.164) | ( 0.026) | (0.343) | (0.164) | (0.079) | (0.064) | |
| Zhou (2002) | 1.0 (0.5) | 2.400 | 1.700 | 3.660 | 1.00 | |
| Yang et al. (2012) | 1.7(0.1) | 1.700 | 0.90(0.30) |
These results are in good agreement with a thesis by Bowman (2016) (see his Figure 4.12 for lowfrequency pulsations, ν ≤ 25d −1). The evolutionary tracks for the non-rotating model, as computed by Mowlavi et al. (2012), for both zeroage main-sequence stars (ZAMS) and terminal-age main-sequence stars (TAMS) with a metallicity of Z = 0.014 (solar metallicity), are presented in Figure 7. The absolute physical parameters of XX Cyg, are plotted as mass-luminosity (M-L), mass-radius (M-R), and H-R diagrams at Figure 7. The parameters are in good agreement with those expected for SX Phe variables in the logM−logL plane. XX Cyg is close to, or on, the ZAMS in all the diagrams of Figure 7 and lies halfway between the blue edge (BE) and red edge (RE) of the instability strip, as shown in the L-T relation (H-R diagram). To estimate the age of the system, we plotted theoretically calculated models (Mowlavi et al. 2012) for temperature versus luminosity (T-L) (Figure 7). From this diagram, and from McNamara and Feltz (1980), the age of XX Cyg should be approximately (0.949 ± 0.064) × 109 years, It is close to the age predicted by Zhou (2002) and Yang et al. (2012), which is (0.9 ± 0.3) × 109 years as shown in Table 1. The location of XX Cyg in the H-R diagram is shown in Figure 7. These parameters would explain the position of the star at or near the main sequence (Rodriguez and Breger 2001).
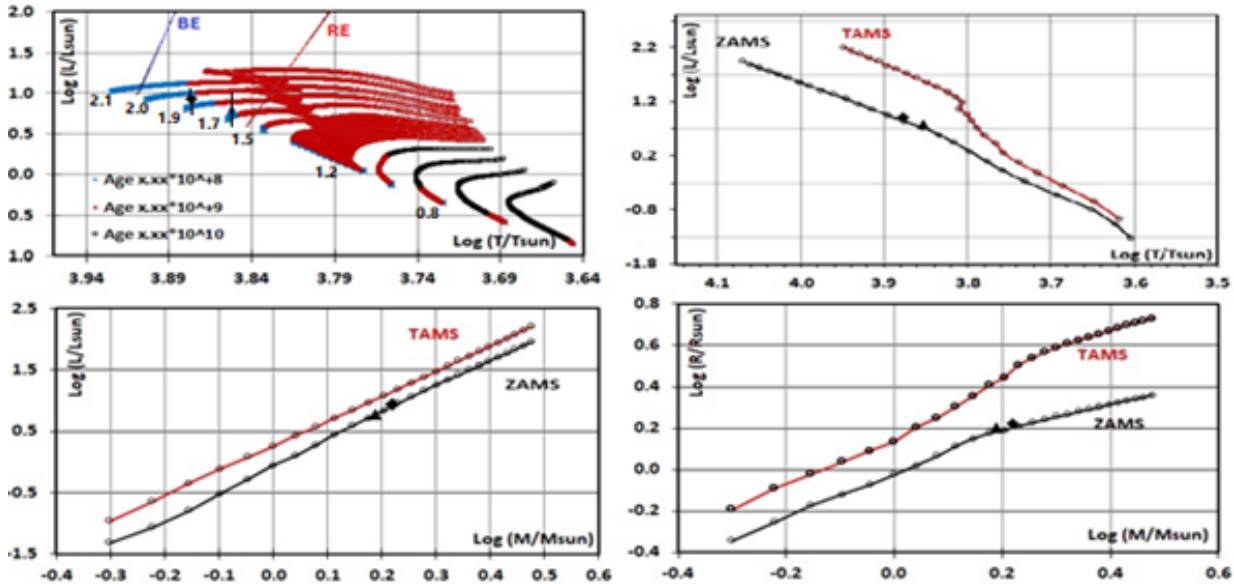
Fig. 7 Position of XX Cyg (square) and the Cepheid variable GSC 02444-00241 (triangle) in temperature-luminosity (HR diagram), mass-luminosity and mass-radius diagrams. The top left plot shows theoretical mass tracks from Mowlavi et al. (2012) for Z=0.014 over a range of ages (in Gyr). The blue (BE) and red (RE) edges of the instability strip are marked. The color figure can be viewed online.
5. CONCLUSION
The following conclusions were drawn:
Photometric observations from the archives of the ASAS-SN, SuperWASP and AAVSO provided 85 new times of maximum-light for XX Cyg.
From the O-C result (Figure 4), we estimated the period change rate for XX Cyg; the result was (dP/dt) = (15.248 ± 1.092) × 10−5 s/yr and/or (1/P)dP/dt = 1.33 × 10⁻⁸ yr−1.
We also found that the amplitude was decreasing over time.
The amplitude behavior in the visible band is decreasing at a rate of 0.7 mmag per year. This variation of amplitude is not at all understood and is one of the open questions about SX Phe stars.
As noticed from the period change and amplitude variations, there seems to be a correlation between the two quantities: the amplitude decreases with increasing period.
The existence of a bump in the light curve is still uncertain. However, a bump in the amplitude was observed in an automated SuperWASP survey, as noted in the text. Maybe there are large magnetically active regions on the surface, or shock waves from the stellar interior, which are responsible for the bump.
Multi-wavelength and radial-velocity observations of XX Cyg are required to determine the reason for this bump.
We calculated the physical parameters for XX Cyg, and the results were found as /

