


 nueva página del texto (beta)
 Inglés (pdf)
 Artículo en XML
 Referencias del artículo
 Enviar artículo por email
 Citado por SciELO
  Similares en
SciELO
Similares en
SciELO 
 Permalink
1. INTRODUCTION
Small-body explorations, such as asteroids and comets, have become an essential subject in deep space exploration. They involve multiple disciplines, such as science and control engineering, aerospace science and technology, celestial mechanics, and astronomy, among others. The combination of nonspherical gravitational attraction together with the rapid rotation of the asteroids around their axis governs the dynamics of the spacecraft near its surface. Thus, the analysis of the orbits of a spacecraft around these bodies is one of the current challenges in astrodynamics.
Developing mathematical models to represent the gravitational field around irregular bodies is an important research topic in orbital dynamics. Often, a spherical harmonics expansion is used to model the Earth and other Planets, as these more massive celestial bodies (when compared to asteroids) have a shape that resembles a sphere (Elipe & Riaguas 2003). On the other hand, when the body does not resemble a sphere, this expansion is no longer convenient and, in some cases, convergence cannot be guaranteed (Elipe & Riaguas 2003). Generally, when the field point is located within the circumscribing sphere, the series diverge (Lan et al. 2017; Elipe & Riaguas 2003). Furthermore, the expansion of loworder Legendre coefficients often does not provide a good approximation for the motion of a spacecraft due to the fact that higher order terms can generate divergence after several iterations (Riaguas et al. 1999; Jiang & Baoyin 2018).
The shape of a celestial body, its rotation period, and other physical characteristics can be obtained by light curve and radar analysis. From these observations, it is possible to use the solid polyhedron method to determine the dynamics around irregular bodies, including gravitational fields, stationary state solutions (equilibrium points, periodic orbits, quasiperiodic orbits, and chaotic motion), stability, bifurcation, etc (Werner 1994; Scheeres et al. 1996; Jiang & Baoyin 2018; Chanut et al. 2015b; Jiang et al. 2014; Yu & Baoyin 2012; Tsoulis & Petrović 2001). However, this approach requires a large computational effort depending on the quantity of polyhedral shapes. This problem was partially solved in Chanut et al. (2015a), where the authors considerably reduced the computation time (≈ 30 times) applying the Mascon gravity framework, as presented in Geissler et al. (1996), using a shaped polyhedral source to model the external gravitational field of a small celestial body. For more details about this approach we also refer the readers to Venditti (2013) and Aljbaae et al. (2017).
The gravitational potential can be obtained with high accuracy using the polyhedral model, but from this model it is difficult to understand the effect of certain parameters (mass ratio (µ), shape, among others) on the dynamics. This happens because, in the polyhedron model, the parameters mix and produce a mixed influence on the gravitational field of irregular bodies. Therefore, to study the effect of a single parameter, it is often necessary to model irregular bodies using simplified models.
By using simplified models, it is possible to perform semi analytical studies to understand which parameters affect stability, appearance of equilibrium points, bifurcations, etc. Thus, simplified models help to understand the dynamics around irregular bodies, and allow us to design orbits (Wang et al. 2017; Zeng & Liu 2017), feedback control schemes (Yang et al. 2017), as well as the permissible hovering regions (Zeng et al. 2016).
An effective way to analyze the surface of an asteroid is body-fixed hovering in a region close to the asteroid, where the spacecraft maintains its position constant with respect to the asteroid (Wen et al. 2020). Great locations for using the body-fixed hovering are the equilibrium points, due to the fact that they are locations that receive minimal disturbance. Jiang et al. (2014) investigated body-fixed hovering at equilibrium points and classified the manifolds close to these points into eight types. Body-fixed hovering can be used to obtain accurate measurements of a region on the surface of the target asteroid and to facilitate the descent and ascent maneuvers of a spacecraft whose mission is to return to Earth with samples (Broschart & Scheeres 2005). Such maneuvers were used in the Hayabusa mission (Scheeres 2004).
Several bodies with different shapes can be described using simplified mathematical models. For example, Elipe & Lara (2003); Riaguas et al. (1999, 2001), analyzed the motion of a particle under the gravitational field of a massive straight segment. A simple planar plate (Blesa. 2006), a rotating homogeneous cube (Liu et al. 2011) and a triaxial ellipsoid (Gabern et al. 2006) have also been used to model bodies with irregular shapes.
Zeng et al. (2015) proposed that certain classes of elongated small bodies can be modeled by a doubleparticle-linkage called the dipole model. After that, Zeng et al. (2016) investigated the dynamical properties in the vicinity of an elongated body (using the dipole model) in order to analyze the influence of the force ratio (k), the mass ratio (µ) and the oblateness (A 2) of the primary in the distribution of the equilibrium points in the xy plane. Through this dynamical analysis, Zeng et al. (2016) observed that the non-collinear equilibrium points exist only for 0.37 < k < 2.07, and that these equilibria do not depend on µ. In Zeng et al. (2016), the influence of the parameters k, µ and A 2 (oblateness of the second primary) on the positions of the of out-of-plane equilibrium points and on the topological structure of the zero velocity curves were analyzed. Zeng et al. (2016) noted that the oblateness of the second primary greatly influences the distribution of equilibrium points outside the plane. These works, among others, showed that using that simplified model it is possible to identify the main parameters governing the dynamics around certain asteroid systems (Barbosa Torres dos Santos et al. 2017a,b; Zeng et al. 2018).
Inspired by the double-particle-linkage model, Lan et al. (2017) proposed that small arched bodies can be modeled by a triple-particle-linkage model determined by five parameters: M, ω, l 1, τ and β. Analyzing asteroids 433 Eros, 243 Ida, and the Martian moon M1 Phobos, they validated the so called tripole model, by verifying that the gravitational field distribution of unstable annular regions is similar to the one found with the polyhedral model. Later, Yang et al. (2018) proposed the non-axisymmetric triple particle-linkage model as a further step to improve the modeling towards a more realistic scenario. The authors analyzed the non-axisymmetric tripole model using three different elongated asteroids (243 Ida, 433 Eros, and (8567) 1996 HW1) and verified that the asymmetrical tripole model was more accurate than its predecessors, the dipole and the symmetrical tripole model.
We consider different geometries for the tripole to compute the gravitational potential and we compute the positions of the equilibrium points for the different combinations of relevant parameters of the model. Additionally, we analyze the conditions for linear stability. We find that the existence of some equilibrium points depends on the azimuthal angle and that the stability conditions depend on the rotation of the asteroids around their axis (k), on the azimuthal angle (Φ), and on the mass ratio of the system (µ ∗). Also, we investigate the influence of Φ on the topological structure of the zero velocity curves. Finally, we find the relationship between the Jacobi constant and the azimuthal angle of the asteroid for all equilibrium points outside the asteroid’s body.
Although the works found in the literature deal with the validation of the symmetric and the asymmetric tripole model, a semi-analytical analysis of the tripole model has not yet been performed. So, the main goal of the present work is to perform a dynamical analysis around arched asteroids and investigate which parameters (k, µ ∗ and Φ, where Φ determines the degree of arching of the asteroid) influence the distribution of the equilibrium points, the topological structure of the zero velocity curves as well as the stability condition of stationary solutions. The tripole model has additional degrees of freedom when compared to the dipole model. So, it is possible to identify new parameters, such as the azimuthal angle, and to investigate their influence on the dynamical properties around an arched system. With this, the results can be applied to investigate elongated natural arched bodies, such as some asteroid systems, comet nuclei and planet moons.
We note that, from a dynamical point of view, it should be interesting to explore the effect of the shape on the inner equilibria also. However, since we focus on the applicability of the solutions, we restrict the investigation to the points outside the body of the asteroid.
This article is organized as follows. The model and the methodology are discussed in § 2. The results are analyzed and discussed in § 3. In § 4, we investigate and compare the stability conditions of the model adopted in this study with real systems of small bodies. In § 5, some final considerations are made.
2. MATHEMATICAL FRAMEWORK
In this section, we describe the Restricted Four-Body Problem using the rotating mass
tripole model. In our investigations, we use the rotating mass tripole model shown
in Figure 1. This model consists in three mass
points, M
1, M
2, and M
3, arranged inside an irregularly shaped asteroid. All the equations
developed in this work refer to the asteroid-particle system (where the particle is
a body with negligible mass), i.e., the perturbations from other bodies are not
taken into account. The rods connecting M
1 to M
3 and M
2 to M
3 have negligible mass and the same length L = 1, which
is the canonical unit. The distance between M
1 and M
2 is denoted by l
1, while the distance between M
2 and the x-axis, which contains M
3, is denoted by l
2. The parameter τ is defined as the ratio of

Fig. 1 Schematic representation of the asteroid modeled by a tripole. The color figure can be viewed online.
The origin of the reference system (xy) is at the center of mass of the asteroid. The angle formed by each rod with the x-axis is called the azimuthal angle and is denoted by Φ . We assume that both rods make the same angle with the horizontal axis. The geometric configuration of the asteroid depends on this angle. The more arched the shape of the asteroid, the larger is the azimuthal angle. Note that when Φ = 0◦ the length of the asteroid is maximum and equals to two canonical units. The equations that describe the motion of the particle in the xy plane around the tripole are written in a rotating frame that rotates with constant angular velocity ω = 1, in canonical units. The unit of time is defined such that the period of rotation of the tripole is equal to 2π. We consider that M 1, M 2, and M 3 have equal masses, i.e., m 1 = m 2 = m 3.
2.1. Equations of Motion
Consider that the body with negligible mass (particle) is located at P(x,y) and its motion is governed exclusively by the gravitational forces due to the primary bodies M 1, M 2, and M 3. M 1 and M 2 have masses m 1 = m 2 = µ ∗, and M 3 has mass m 3 = 1 − 2µ ∗, where µ ∗ is mass ratio defined as
The coordinates of the primaries, in canonical units, are, respectively, given by:
Using the canonical units mentioned above the Hamilton function of the system is written as (Broucke 1968):
where
and p x and p y are the components of the angular momentum of the particle with respect to the x-axis and the y-axis, respectively. The dimensionless parameter k is the force ratio, given by the ratio between the gravitational force and the centrifugal force (Zeng et al. 2018, 2016):
The value of k depends on the angular velocity of the asteroid
(ω
∗). In the international system of units, the total mass of the body
(M), is given in kg, the length
From the Hamilton function, it is possible to obtain the equations of motion of the particle in the rotating reference system:
The remaining dynamical equations are
where Ω x and Ω y are the partial derivatives of Ω with respect to x and y, respectively, and Ω is given by
Equation 14 is a scalar function, also known as the pseudo-potential, which accounts for the acceleration experienced by the particle in a non-inertial reference system. The equations of motion in the xy plane in the Lagrangian formulation are (Szebehely 1967; Murray & Dermott 1999; McCuskey 1963; Scheeres 2012):
which have the same appearance as the equations of the Classical Restricted Three-Body Problem (CRTBP) (Moulton 1914; Szebehely 1967; Murray & Dermott 1999; McCuskey 1963).
Considering the motion in the xy plane, multiplying equation 15 by 2x and equation 16 by 2y, and adding all of them, we have
which can be rewritten as
Integrating equation 18 with respect to time, we find that
where v is the velocity of the particle and C ∗ is a constant of integration.
In this paper, C ∗ is called the modified Jacobi constant, where modified means that it is different from the constant studied by Jacobi for the case of the Classical Restricted Three-Body Problem. A special case occurs when k = 1, since the modified Jacobi constant has the same value as the Jacobi constant, corresponding to the CRTBP. Looking at equation 19, we note that the velocity of the particle depends only on the pseudo-potential and the integration constant C ∗. The constant C ∗ is determined numerically in terms of the initial position and velocity of the particle.
2.2. Equilibrium Points
Equilibrium solutions are points in which the particle has zero acceleration and zero velocity in the rotating frame. They are good locations in space to insert the spacecraft because they are located in regions where external perturbations are minimal, reducing the fuel consumption required for stationkeeping maneuvers (Barbosa Torres dos Santos et al. 2017a). The locations of the equilibrium points are explicitly defined in terms of µ ∗ (and implicitly by Φ). Making the right side of equations 15 and 16 equal to zero, that is, ˙x = y˙ = 0, implies null accelerations:
The solutions of this system of equations can be determined numerically using an iterative method.
2.3. Linear Stability Analysis
The linear stability analysis of the equilibrium points (x 0,y 0) is performed by displacing the origin of the coordinate system to the position of the libration points, so that the equations of motion are linearized around the origin. Equation 15 and 16 can be written as, respectively
where the partial derivatives in (x 0,y 0) mean that the value is computed at the libration point that is being investigated. ξ and η represent the coordinates of the particle with respect to the equilibrium point (x 0, y 0), and Ω xx , Ω xy , Ω xy , and Ω yy are the partial derivatives calculated at this point, given by
The nontrivial roots of equations 21 are obtained from the solution of the characteristic equation of order four in λ:
In equation 23,
3. RESULTS
In this section we will show the numerical results obtained from our numerical simulations. The goal is to gain a general view of the dynamics of the problem, which will allow us to draw some conclusions.
3.1. Influence of [k, µ∗, Φ] on Equilibrium Points
We start by computing the equilibrium points of the system. Figure 2(a) shows the points of mass M 1 (green circle on the left side), M 2 (green circle on the right side) and M 3 (green middle circle), and six equilibrium points (red) for Φ = 0◦, µ ∗ = 1/3 and k = 1. The equilibrium points between M 1 and M 3 and between M 2 and M 3 overlap with the rod that connects the spheres (see Figure 1). Therefore, we assume that these equilibrium points are inside the body of the asteroid.

Fig. 2 Equilibrium points for an azimuthal angle of (a) 0◦ and (b) 45◦. In both cases µ ∗ = 1/3. The color figure can be viewed online.
Figure 2(b) is similar to Figure 2(a), with µ ∗ = 1/3 and k = 1, but now Φ = 45◦. In this case, there are eight equilibrium points, all of them off the x-axis. The position shift occurs because a new configuration is necessary to fulfill the equilibrium conditions as the positions of the primaries change, modifying the value of the azimuthal angle.
We performed numerical investigations to understand how the coordinates of the external equilibrium points change when µ ∗, k and Φ are varied. To facilitate this analysis, we identified five regions, A, B, C, D, and E, as shown in Figure 3. We note that the regions are symmetric with respect to the y-axis. Observe that regions A, B and E are symmetric with respect to the y-axis, i.e., if the equilibrium point (in regions A, B or E) has coordinates (x, y), then there will be another equilibrium point in the coordinates (-x, y). Due to this symmetric property of the regions, we will only analyze the situations for which x is negative. Figure 3 displays the equilibrium points when µ ∗ = 1/3, k = 1 and Φ is varying. It illustrates how the equilibrium points move as this parameter is varied. The corresponding azimuthal angles are given in the caption of the plot. One can note the “path” followed by the equilibrium points as Φ increases. For Φ = 90◦, the equilibrium points are equivalent to those of a dipole aligned at x = 0.

For region A, we plot the behavior of the equilibrium points in the x and y plane as a function of µ ∗, k and Φ, as shown in Figure 4.

Fig. 4 Coordinates of the equilibrium points in region A as a function of k, µ ∗ and Φ. (a) Position of the equilibrium points on the x-axis. (b) Position of equilibrium the points on the y-axis. The color figure can be viewed online.
Figure 4 shows how the coordinates of the equilibrium points vary with k, µ ∗ and Φ. Note that the graphs show the variation in the mass of the body M 3, given by 1-2µ ∗. That is, if the mass of M 3 increases, consequently the mass of M 1 (and M 2), given by µ ∗, decreases. The color bar represents the value of the azimuthal angle. First, we investigate the solutions when we vary k and keep µ ∗ and Φ constant. Note from Figure 4 that as the rotation of the asteroid decreases, that is, as k becomes larger, the equilibrium points move away from the center of mass of the system. This is because increasing k implies decreasing the angular velocity of the asteroid around its own axis (see equation 9), thus making the value of the centrifugal force smaller. The condition of existence of an equilibrium point is that the resulting force at one point in space is zero, that is, the gravitational force and the centrifugal force must have the same value (in the module) but in opposite directions. So, to keep the centrifugal force at a value that counteracts the gravitational force, the distance from the center of mass to the position of the equilibrium points must increase. As k increases, the equilibrium points appear farther from the center of mass.
Next, keeping the values of k and Φ constant and varying µ ∗, Figure 4 shows that, as µ ∗ becomes smaller, the equilibrium points on the x-axis inside region A approach the center of mass of the system. On the other hand, as 1-2µ ∗ decreases (i.e. µ ∗ increases), the equilibrum points move away from the asteroid. This happens because, as the mass of the bodies M 1 and M 2 becomes smaller, the gravitational force on the asteroid edge decreases on the x-axis, making it necessary to reduce the centrifugal force of the system on this axis. Conversely, the positions of the libration points move away from the center of mass along the y-axis as the gravitational force on this axis becomes larger due to the increase in the mass of M 3.
Finally, in region A as we increase Φ, the equilibrium points along the x-axis come nearer to the center of mass of the system, while the ones along the y-axis move away from the center of mass of the system. These equilibrium points only exist when the azimuthal angle is between 0◦ and 76◦. Beyond this value, the configuration of the tripole does not allow the existence of equilibrium points in region A.
For region B, the variations of the x and y coordinates of the equilibrium points as a function of k, µ ∗ and Φ are shown in Figures 5(a) and (b), respectively. For a better view of the path taken by the equilibrium points when we vary the parameters k, µ ∗ and Φ , we insert a curve (black line) in the yellow region (Φ = 65◦).
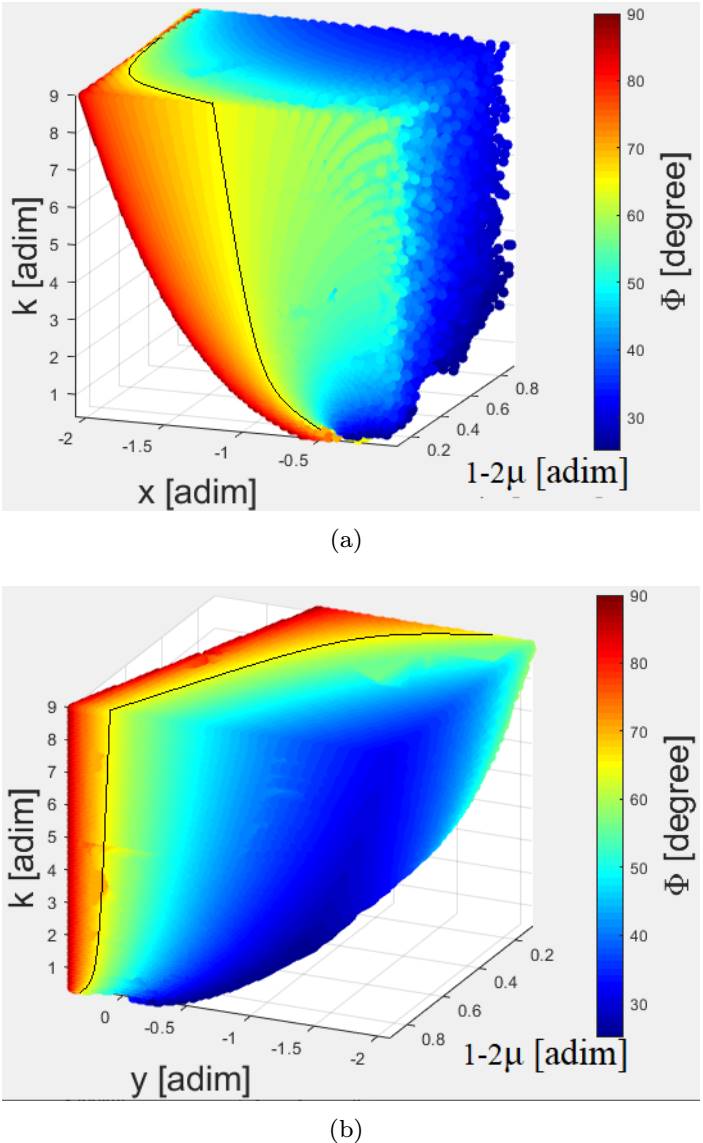
Fig. 5 Coordinates of the equilibrium points in region B as a function of k, µ ∗ and Φ. (a) Position of the equilibrium points on the x-axis. (b) Position of equilibrium the points on the y-axis. The color figure can be viewed online.
We note that, as k becomes smaller, the positions of the equilibrium points in region B shift away from the center of mass of the system. This is true for the equilibrium points on both the x-axis and the y-axis and it occurs for the same reason as for the equilibrium points in region A.
The equilibrium points in region B occur for Φ > 26◦. When the mass m 3 increases, the equilbirium points tend to move away from primary body on both the x and y axis.
Analyzing the positions of equilibrium points in region B as we increase Φ, we find that the equilibrium points move upwards along the y-axis and may cross over to the positive semi-plane. Unlike what happens for solutions in region A, the equilibrium points in region B move away from the system’s center of mass along the x-axis.
Table 1 summarizes the direction of the displacement of the equilibrium points in region A and B with respect to the body’s center of mass as k, µ ∗ and Φ vary. The symbol ↗ indicates that the corresponding parameter is increasing, while ≡ is used to indicate parameters that are fixed. Directional arrows denote the direction of the displacement of the equilibrium points. For example, when we keep fixed the values of k and µ ∗, and increase Φ, the equilibrium points of region A, x and y, move to the right (approaching the system center of mass) and up (moving away from the system center of mass), respectively.
TABLE 1 VARIATION TRENDS OF COORDINATES FOR THE EQUILIBRIUM POINTS OF THE A AND B
| Summary, variation of parameters. |
Equilibrium point motion. A region |
Equilibrium point motion. B region |
||
|---|---|---|---|---|
|
|
|
|
|
|
|
|
|
|
|
|
|
|
|
|
|
|
|
|
|
|
|
|
Next, we investigate regions C and D. In these two regions, the coordinate of the equilibrium points on the x-axis is zero for all points.
Figure 6 shows the y coordinate of the equilibrium points as a function of k, µ ∗ and Φ. When k increases the centrifugal force becomes smaller, so the equilibrium points move downwards, away from M 3. As the mass of M 3 increases, the gravitational force in the y direction becomes stronger, causing the positions of the equilibrium points to change. As µ ∗ decreases and (1-2µ ∗) becomes larger, the equilibrium points in region C move in the negative direction of the y-axis.
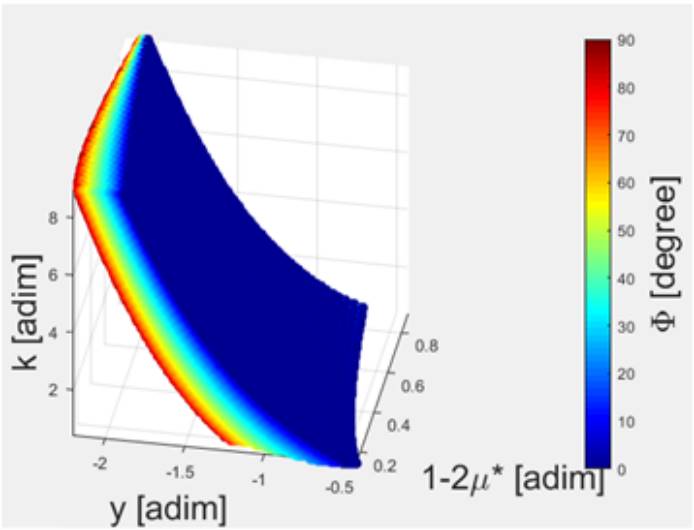
Fig. 6 Behavior of the equilibrium points on the y-axis of region C as a function of parameters k, µ ∗ and Φ. The color figure can be viewed online.
Finally, as Φ increases, the equilibrium points move in the downwards along the y-axis. Figure 6 illustrates that the y coordinate of the equilibrium points of the C region depends on Φ, and that y C (Φ) becomes smaller as we increase the azimuthal angle. This happens because, as we increase Φ, M 1 and M 2 move upwards along the y-axis. Then, to keep the center of mass of the system at the origin, M 3 must be in the semiplane with negative y-axis. Moreover, as Φ increases, the coordinate of M 3 becomes increasingly negative, so the equilibrium points in region C move away from M 3 in the negative direction, to maintain the balance between the gravitational and centrifugal forces.
Figure 7 shows how the equilibrium points in region D depend on k, µ ∗ and Φ. As k increases, the equilibrium points move upwards, away from the center of mass of the system. As the mass of M 3 increases, the gravitational force in the y direction becomes larger, changing the positions of the equilibrium points. As (1-2µ ∗) becomes larger, the equilibrium points in region D move in the positive direction of the y-axis, away from the center of mass of the system.

Fig. 7 Behavior of the equilibrium points on the y-axis of region D as a function of parameters k, µ ∗ and Φ. The color figure can be viewed online.
Finally, we investigated the behavior of the equilibrium points on the y-axis when we increase Φ. Initially, when we increase Φ, the equilibrium points on the y-axis approach the center of mass of the system. This happens because, as we increase the azimuthal angle, M 3 moves downward; consequently, the gravitational force on the positive y-axis becomes weaker. In contrast, as we increase Φ, the bodies M 1 and M 2 move upward with respect to the y-axis. This causes the gravitational force to increase in region D, now causing the equilibrium points to move upwards. For a better understanding, we constructed a figure using [µ ∗, k] = [1/3, 1] T , which shows the equilibrium point behavior in the D region when we vary Φ, as shown in Figure 8.

Fig. 8 y-coordinate of the equilibrium points in region D as a function of Φ for [µ ∗, k] = [1/3, 1] T . The color figure can be viewed online.
Then, as we increase the value of Φ, the equilibrium point values in region D decrease, approaching the center of mass of the system; they reach a minimum for Φ D = 30.32◦, and the y position of the D region that depends on Φ is y(Φ) D−min = 0.6664. Then they increase again, moving away from the center of mass of the system.
Table 2 summarizes the direction of the displacement of the equilibrium points in region D relative to the asteroid’s center of mass when k, µ ∗ and Φ vary.
3.2. Influence of the Azimutal Angle on the Zero Velocity Curves
The azimuthal angle is one of the main parameters that govern the topological structure of the zero velocity curves around the tripole system. In this section, this effect is investigated. For the numerical simulations we keep [k, µ ∗] T = [1, 1/3] T and we vary the angle Φ in the interval [0, 90◦].
Equation 19 relates the square of the velocity and the position of the infinitesimal mass body in a rotating coordinate system. Note that when the integration constant C ∗ is numerically determined by the initial conditions, equation 19 gives the speed with which the infinitesimal mass body moves.
In particular, if v is zero, equation 19 defines the curves at which the velocity is zero. The equation that gives the zero velocity curves, in Cartesian coordinates, is:
where r 1, r 2 and r 3 are as shown in equations 6, 7 and 8. The zero velocity curves in the xy plane for six different values of Φ are shown in Figure 9. Each curve in frames (a) to (f) of Figure 9 corresponds to the value of the Jacobi constant for which the contacts between the ovals occur and the equilibrium points appear. The tripole is not illustrated in the figure.

Fig. 9 Influence of the azimuthal angle on the zero-velocity curves in the xy plane. (a) Zero velocity curves for a 0◦ azimuthal angle. (b) Zero velocity curves for a 20◦ azimuthal angle. (c) Zero velocity curves for a 40◦ azimuthal angle. (d) Zero velocity curves for a 60◦ azimuthal angle. (e) Zero velocity curves for an 80◦ azimuthal angle. (f ) Zero velocity curves for a 90◦ azimuthal angle. The color figure can be viewed online.
Figure 9(a) shows the zero velocity curves when the azimuthal angle is 0◦. Note that, for this azimuthal angle, M 1, M 2, and M 3 are aligned on the x-axis. On the other hand, Figure 9(b) shows the zero velocity curves when the azimuthal angle is 20◦. For small values of x and y that satisfy equation 24, the first two terms are virtually irrelevant and the equation can be written as:
This equation gives the equipotential curves for the three centers of force µ ∗, µ ∗ and 1-2µ ∗, as shown in Figure 9(a) and (b). For large values of C ∗, ovals consist of closed curves around each of the body. If we decrease C ∗, the ovals around M 1, M 2 and M 3 (inner ovals) expand, and the outer contours (outer ovals) move towards the center of mass of the system. The inner ovals connect with the outer ovals, resulting in the equilibrium points in region A (black curve) and the ovals between the bodies also connect, resulting in the equilibrium points in region E (red curve). See Figures 9(a) and (b).
If C ∗ is further decreased, the regions where movement is allowed become larger. This happens because the oval around the masses increases and merges with the outer oval, leaving only a small confined area (regions C and D), where the movement is impossible. Note from Figure 9(a) that, due to the symmetry of the problem, equilibrium points in regions C and D appear for the same value of C ∗ (green curve). On the other hand, when the azimuthal angle is different from 0◦, the equilibrium points in the C and D regions appear for different Jacobi constant values (green and blue curves, respectively) shown in Figure 9(b).
Figure 9(c) shows the zero velocity curves when the azimuthal angle is 40◦. The change in the topological structure of the zero velocity curves is evident as the azimuthal angle is varied. Note from Figure 9(c) that, in addition to the contact points shown in Figures 9(a) and (b), new contact points emerge (red curves), in region B. Through numerical simulations, we observe that the B region arises when the azimuthal angle is greater than 26◦.
When we consider an azimuthal angle of 60◦, M 1, M 2 and M 3 form an equilateral triangle relative to the rotating reference system. Thus, the zero velocity curves have a symmetrical shape. When the azimuthal angle is 60◦, the equilibrium points in regions A and C arise for C A−C = 2.946725190. Likewise, the (C B−D = 3.35803516) is required for contacts between ovals in regions B and D. If the masses of M 1 and M 2 are different, the symmetric property of the equilibrium points and the zero velocity curves with respect to the xy axis is not valid. Figure 9(e) shows the zero velocity curves for an azimuthal angle of 80◦. In Figure 9(e), we observe that the regions A cease to exist, leaving only regions B, C, D and E. This means that, just as regions B depend on the azimuthal angle to emerge or disappear, so do regions A. Regions A cease to exist for Φ > 76◦.
Finally, considering an azimuthal angle of 90◦, M 1 and M 2 overlap, which means that they behave as a single body with mass m = m 1 + m 2. For this configuration, the system is similar to the Classical Restricted Three-body Problem with a mass ratio of µ ∗ = 1/2.
Note from Figures 9(a) - (f) that, as we increase the azimuthal angle from 0 to 90◦, noticeable changes in the zero velocity curves can be observed near the arched asteroid. Note that the regions that connect the ovals move along the xy plane as we vary the azimuthal angle. Some fixed points also emerge or disappear.
The values of the modified Jacobi constants at the contact points in each region in Figure 9 are shown in Figure 10. Figures 10(a) - (d) show how the values of the Jacobi constant at regions A, B, C, and D (C A , C B , C C , and C D , respectively) vary as a function of the azimuthal angle Φ. In Figure 10(a), we see that the values of the Jaccobi constant C A (Φ) decrease as the azimuthal angle Φ increases. For C B (Φ), one notes that initially the value of the Jacobi constant increases with increasing azimuthal angle, and then it decreases, as shown in Figure 10(b). This behavior causes a maximum value for C B (Φ), which happens at C B = 2.989303755, for Φ = 46.524234◦. On the other hand, the values of the function C C (Φ) increase as we increase Φ. Finally, for C D , as we increase Φ, initially the values of C D become smaller, reaching a minimum value of C D = 2.4120014 when the azimuthal angle is approximately Φ = 19.987◦, and then they increase.

Fig. 10 Jacobi constant behavior in regions A, B, C and D, respectively, as a function of azimuthal angle. (a) Values of the Jacobian constant (C A ) at the equilibrium points versus Φ. (b) Values of the Jacobian constant (C B ) at the equilibrium points versus Φ. (c) Values of the Jacobian constant (C C ) at the equilibrium points versus Φ. (d) Values of the Jacobian constant (C D ) at the equilibrium points versus Φ. The color figure can be viewed online.

Fig. 11 Values of the mass ratio (µ ∗) versus the azimuthal angle (Φ) for the stability condition of the equilibrium point L D considering different values of k. (a) Values of the mass ratio (µ ∗) versus the azimuthal angle (Φ) when k = 1 for the stability condition of the equilibrium point L D . (b) Values of the mass ratio (µ ∗) versus the azimuthal angle (Φ) when k = 3 for the stability condition of the equilibrium point L D . (c) Values of the mass ratio (µ ∗) versus the azimuthal angle (Φ) when k = 5 for the stability condition of the equilibrium point L D . (d) Values of the mass ratio (µ ∗) versus the azimuthal angle (Φ) when k = 7 for the stability condition of the equilibrium point L D . The color figure can beviewed online.
3.3. Stability Conditions
Now, we focus on the analysis of the stability conditions for the equilibrium points in regions D and C, (L D and L C ), respectively, i.e., points that have null x coordinate. We describe how the stability conditions for the equilibrium points L D (and L C ) depend on the azimuthal angle (Φ), the force ratio (k) and the mass ratio (µ ∗). Indeed, if any of these parameters are changed, the stability condition (unstable or stable) of these equilibrium points may also change.
First let us look at the stability condition for region D. Figure 11 displays plots of Φ versus µ ∗, showing the stability transition. We see from Figure 11(a) that, when the azimuthal angle increases and k = 1, the mass ratio required to maintain the equilibrium point L D stable decreases. When the angle is 0◦, the maximum mass ratio to allow linear stability of the system studied is µ ∗ = 0.0742683. If the mass ratio is greater than this value, the system is unstable for every azimuthal angle. Note that, when Φ → 90◦, the two masses of the tripole (m 1 and m 2) ollapse into a mass point with a mass ratio 2µ ∗. In this case, the point L D is similar to the equilibrium point L 3 of the Classical Restricted Three-Body Problem. Therefore this equilibrium point is linearly unstable for any mass ratio, which is in agreement with the literature (Moulton 1914; Szebehely 1967; Murray & Dermott 1999; McCuskey 1963).
Figures 11(b) to (d) show Φ versus µ ∗, illustrating the stability regions when k > 1. We see from Figure 11(b) that, for Φ < 70◦, the stability transition is similar to the case when k = 1, but the bifurcation occurs when Φ ≈ 70◦. Notice in the graph that a narrow vertical strip appears, causing the L D equilibrium point to be stable for any value of µ ∗. As Φ increases, the stability conditions change again, making the equilibrium point stable only for high values of µ ∗. So, observe that when the system has small values of µ ∗, the equilibrium points are linearly stable for Φ < 76◦. On the other hand, for a very arched asteroid (Φ > 76◦), the equilibrium point L D is linearly stable when the mass ratio of the system is large.
Figure 11 I shows the stability transition curve for k = 5. We observe that when Φ < 60◦, the stability transition curve is similar to the previous cases. We also notice that a narrow vertical strip appears (around Φ ≈ 65◦) and has a larger area with respect to the previous case. This means that we can also find stable regions when we consider large values of Φ (Φ > 60◦) and µ ∗. As we increase the value of Φ (when Φ > 70◦), the equilibrium point L D becomes linearly stable only for large values of µ ∗. For small values of µ ∗, the equilibrium point L D is stable when Φ < 70◦. The letters S and U shown in Figure 11I are abbreviations for stable and unstable condition, respectively.
Finally, Figure 11(d) shows the stability transition when k = 7. Note that, as in the previous cases, when we consider k = 7 a narrow vertical strip appears (around Φ 60◦), allowing the equilibrium point L D to be linearly stable for any value of µ ∗. If we gradually increase µ and Φ, the stable regions remain until Φ = 89.6◦. On the other hand, if we decrease µ as we increase Φ (from 66◦), the stable region extends to Φ = 67◦. Note in Figures 11(b) to (d) that the area of the narrow vertical strip becomes larger as we increase the k value. This means that, the larger the value of k, the larger the region that allows linear stability of the equilibrium point L D for any values of µ ∗.
A similar analysis was performed for the equilibrium point L C and the results are shown in Figure 12. Unlike Figure 11(a), when k = 1, Figure 12(a) shows that there are two stability transition limits. The first limit (lower transition, lefthand curve) exists for small azimuthal angles, starting at 0◦, with a mass ratio of 0.07427949. Above 18.351◦, numerical evidence shows that another stability transition arises, as shown by the right-hand curve in Figure 11(a).

Fig. 12 Values of the mass ratio (µ ∗) versus the elevation angle (Φ) for the stability condition of the equilibrium point L C considering different values of k. (a) Values of the mass ratio (µ ∗) versus the azimuthal angle (Φ) when k = 1 for the stability condition of the equilibrium point L C . (b) Values of the mass ratio (µ ∗) versus the azimuthal angle (Φ) when k = 3 for the stability condition of the equilibrium point L C . (c) Values of the mass ratio (µ ∗) versus the azimuthal angle (Φ) when k = 5 for the stability condition of the equilibrium point L C . (d) Values of the mass ratio (µ ∗) versus the azimuthal angle (Φ) when k = 7 for the stability condition of the equilibrium point L C . The color figure can be viewed online.
Figures 12(b) - (d) show Φ versus µ ∗, which illustrates the stability regions, when k > 1. Figure 12(b) shows two stability transitions. Note that the first transition starts when Φ = 0◦ and µ ∗ is approximately 0.074.
The second stability transition starts when Φ = 25◦, when the asteroid is 8◦ more arched than in the previous case, so the equilibrium point L C has a wider stable region compared to when k = 1. For Φ > 57.5◦, the equilibrium point L C is unstable for any mass ratio.
If we further increase the value of k to k = 5, the stability region becomes even larger, as shown in Figure 12I. The first stability transition arises when Φ = 0◦ and µ ∗ = 0.08. In contrast, the second curve arises when µ ∗ = 0 and Φ = 28◦, thus limiting the region that allows the equilibrium point L C to be stable. If the azimuthal angle is greater than 68◦, the equilibrium point L C becomes unstable for any mass ratio.
Finally, we made an analysis considering k = 7. Note from Figure 12(d) that, due to the slow rotation of the asteroid, now a larger area on the graph makes the L C equilibrium point linearly stable. For k = 7, the first transition starts when Φ = 0◦ and µ ∗ = 0.09. In contrast, the second stability transition starts when Φ = 29◦ and µ ∗ = 0. This shows that when we increase the value of k (ie, the angular velocity of the asteroid becomes slower), the two stability transition curves intersect at a larger azimuthal angle, ranging from approximately, Φ = 35◦ when k = 1, to Φ = 75◦ when k = 7. This shows that, as we increase the force ratio k, the stability region becomes larger.
4. APPLICATION
To validate the equations and results developed in this article, we compared the results obtained with four celestial bodies, (i) 243 Ida, (ii) 433 Eros, (iii) 1996(HW1) and (iv) M1 Phobos.
The parameters k, Φ and µ ∗ were taken from Lan et al. (2017) (for Ida and M1 Phobos) and Yang et al. (2018) (for Eros and 1996 HW1). The linear stability of the equilibrium points of the celestial bodies mentioned above was obtained by Wang et al. (2014) and used in this study for comparison purposes. In Wang et al. (2014), regions C and D are the equilibrium points E 4 and E 2, respectively.
The optimized parameters of the bodies under analysis in this article are shown in Table 3, where Φ is determined by setting Φ = arctan(2σ) in which σ is given by l 2 /l 1 and was determined in Lan et al. (2017) and Yang et al. (2018).
Knowing the parameters for each celestial body, it is possible to find the stability conditions for the equilibrium points E 4 and E 2 from equations 22 and 23.
TABLE 3 THE OPTIMAL PARAMETERS FOR THE TRIPOLE MODELS
| Asteroid |
|
|
|
|---|---|---|---|
| 243 Ida | 0.402 | 0.237 | 19.94 |
| M1 Phobos | 22.003 | 0.396 | 56.09 |
| 433 Eros | 0.434 | 0.260 | 18.95 |
| 1996 (HW1) | 3.158 | 0.443 | 27.43 |
Figure 13 shows µ ∗ versus Φ and illustrates the stability regions for the equilibrum points L C and L D for asteroids 1996 HW1, 243 Ida and 433 Eros and M1 Phobos.

Fig. 13 Values of the µ ∗ versus Φ for the stability condition of the equilibrium point L D (E 2) and L C (E 4) for a specific k value. (a) k = 3.15 for the equilibrium point L D (E 2) of the 1996 HW1 asteroid. (b) k = 3.15 for the equilibrium point L C (E 4) of the 1996 HW1 asteroid. (c) k = 22 for the equilibrium point L D (E 2) of M1 Phobos. (d) k = 22 for the equilibrium point L C (E r ) of M1 Phobos. (e) k = 3.15 for the equilibrium point L D (E 2) of the 243 Ida and 433 Eros asteroids. (f) k = 3.15 for the equilibrium point L C (E 4) of the 243 Ida and 433 Eros asteroids. The color figure can be viewed online.
Figure 13(a) and (b) plot Φ vs. µ ∗ (27.43, 0.44) for the asteroid 1996 HW1. We observe that the point is outside the region that allows stability of the equilibrium points E 2 and E 4, showing that these equilibrium points are unstable, a result that coincides with the results obtained by Wang et al. (2014).
Figures 13(c) and (d) show the stability region of the equilibrium points E 2 and E 4 when k = 22. We plotted the ordered pair (56.09, 0.396) for M1 Phobos. Due to the characteristics (shape, density and rotation) of M1 Phobos, the equilibrium points E 2 and E 4 are within the stability region, making these equilibrum points linearly stable.
The stability of the equilibrium points depends on the bulk density, the shapes, and the angular velocities of the asteroids. The bulk density is obtained from the composition of the asteroid, a characteristic that is hard to change. The asteroids are shaped in the long-term in space. On the other hand, the angular velocities of asteroids are altered due to the accelerations caused by the YORP effect (Paddack 1969).
Observe that the equilibrium points E 2 and E 4 of M1 Phobos are close to the boundary that guarantees the condition of stability (see Figure 13(c) and (d). If the angular velocity of this body increases, as predicted by the YORP effect, k will decrease, making the equilibrium point unstable. This result shows the importance of carrying out a generalized analysis with the aim of globally understanding the dynamical properties in the vicinity of celestial bodies.
Finally, Figure 13(e) and (f) provide information regarding the stability condition for 243 Ida and 433 Eros asteroids. In Table 3 we see that k for asteroids 243 Ida and 433 Eros are very close. Because of this, we will show the results for these two asteroids on the same graph, in Figures 13(e) and (f). We plotted (φ,µ ∗) = (18.95,0.26) and (φ,µ ∗) = (19.94,0.23) for 433 Eros and 243 Ida asteroids, respectively.
We observe that the equilibrium points E 2 and E 4 (Figure 13(e) and (f), respectively) of asteroids 243 Ida and 433 Eros are unstable due to their physical and dynamical characteristics.
These results show that our generalized analysis coincides with the results obtained for asteroids that can be modeled as rotating mass tripoles.
5. CONCLUSION
Dynamical properties of the rotating mass tripole were addressed in this article. The rotating mass tripole consists of three point masses whose geometric configuration depends on the shape of the asteroids under analysis.
We observed that the gravitational potential depends on three free parameters, which are: the force ratio, the mass ratio and the azimuthal angle. We note that the number of equilibrium points that arise depends on the combination of these free parameters. It can be from five to eight equilibrium points. The tendency to vary the location of the equilibrium points according to the free parameters was studied.
We also analyzed the topological structure of the zero velocity curves with respect of the azimuthal angle. We observed that the zero velocity curves around the rotating mass tripole have significant changes due to the arched shape of the asteroid.
Analyzing the linearized equations, we observed that the condition of stability of the equilibrium points in regions C and D depends on k, µ ∗ and Φ. For region C, we observed the appearance of bifurcations when k > 1. On the other hand, the equilibrium points in region D show two stability transition limits for any value of k. For both regions (C and D), it was observed that as we increased the value of k the region of stability became larger.
Understanding the dynamics of a particle subject to the gravitational field of an elongated asteroid is extremely important for the exploration of these bodies. The results presented here provide a global characterization of the dynamical behavior of an infinitesimal mass body around an asteroid modeled as a rotating mass tripole. This allows a better understanding of the main factors that influence the topological structure of the gravitational field in the vicinity of asteroids with an arched shape. More complex models, such as the polyhedral method, are much more accurate and are widely used in the analysis of a specific asteroid, but the present model proved to be useful in providing general information about families of asteroids similar to the tripole model.

