


 nova página do texto(beta)
 Inglês (pdf)
 Artigo em XML
 Referências do artigo
 Enviar este artigo por email
 Citado por SciELO
  Similares em
SciELO
Similares em
SciELO 
 Permalink
1. INTRODUCTION
There is a transition from rapidly to slowly rotating main sequence stars when the mass is less than 1.2 to 1.3 M (Struve & Elvey, 1931; Herbig & Spalding, 1955; Slettebak, 1955; Treanor, 1960). Con-currently, chromospheric and coronal activity step up in the lower mass range (Wilson 1966; Pallavicini et al. 1981). In the Sun, chromospherically active regions and magnetic fields evolve in parallel (Bumba & Howard 1965) and X-ray images show that there is a relationship between magnetic fields and the hot corona (Vaiana et al. 1981). These connections lead to the notion that magnetic energy is the main source of chromospheric and coronal heating (e.g., Parker 1988; Cranmer & Saar 2011; van Ballegooijen, Asgari-Targhi & Berger, 2014). In turn, the highly pressurized hot corona expands to produce a stellar wind (Parker 1958; Cranmer et al. 2007; Suzuki et al. 2013; van der Holst et al. 2014; Usmanov et al. 2018).
Noting that low mass stars have convective envelopes, Schatzman (1962) reasoned that the magnetic fields generated by dynamo processes in a spinning star with a convective envelope (the α -Ω mechanism, Parker 1955), compel the stellar wind to rotate with the star even at very large distances, where it carries away their angular momentum. Schatzman predicted a secular decrease in the angular momentum of these stars, and this was confirmed when Kraft (1967) compared the average surface values of the rotational velocity of 1.2 M stars from the Pleiades and Hyades open clusters. All these associations were explicitly identified by Skumanich (1972), who argued that Ca II emission, angular velocity and magnetic field strength are proportional to each other in this kind of stars, and predicted that these quantities decay as the inverse square root of time, inspiring the idea of using rotation and stellar activity as timekeeping devices for low mass stars.
Thus, there is a feedback loop between rotation and magnetic field, leading to angular frequency, field strength, activity and wind power decreasing with age if no other factors are involved. This feed-back is also observed in fully convective stars (Mc-Quillan, Agrain & Mazeh 2013; Newton et al. 2018), where the magnetic field can not be produced by the α - Ω mechanism. It has been submitted that a large density of small scale magnetic fields induced by a turbulent velocity field (Durney, De Young & Rox-burgh 1993), is even capable of, for instance, maintaining a hot coronal plasma (and a stellar wind) in M9 V type stars (Robrade & Schmitt, 2009). An important point is that the X-ray and chromospheric to bolometric luminosity ratios reach a maximum constant value when the rotational period is less than ≈ 2 days (Soderblom et al. 1993; Pizzolato et al. 2003). In non-fully convective stars this is connected to a saturation value close to 4 kG for the magnetic field strength (Reiners et al. 2014), but significantly larger field strengths have been measured in fully convective M dwarfs (Shulyak et al. 2017 and 2019). This has been associated to the dominance of axisymmetric poloidal and nearly dipolar magnetic fields in this type of stars, as opposed to the prevalence of multipolar fields in dwarf stars with a convective envelope and a radiative interior (Morin et al. 2010).
Using the equations of magnetohydrodynamics, Schatzman’s (1962) idea has been linked to different versions of stellar wind theories and various possibilities for the structure of the coronal magnetic field in a rotating star (e.g., Weber & Davis, 1967; Mestel 1968, 1984; Mestel & Spruit, 1987; Reville et al. 2015). But due to the complex nature of angular momentum evolution of low mass main sequence stars, most theoretical work has been based on heuristic arguments, in order to find manageable equations for a mass and time dependent torque. These semi-empirical prescriptions make assumptions on the properties of the stellar wind and magnetic field, and their relation with the angular velocity and other observable stellar parameters, such as the Rossby number or the filling factor of the magnetized sur-face. Assumptions have changed in step with our understanding of the theoretical and observational properties of these stars, but the final equations for the torque still involve one or more calibration constants, as well as loose power law relations with the mass, radius, mass loss rate and angular velocity (e.g., Bohigas et al. 1986; Kawaler, 1988; Reiners & Mohanty, 2012; Matt et al. 2015; Gallett & Bouvier, 2015; Johnstone et al. 2015a).
Since the stellar angular momentum is removed from the atmosphere, it was initially believed that the radiative core would be spinning much faster than the convective envelope. Brown et al. (1989) established that this is not the case in the Sun, and we now know that the radial average of its rotational velocity is roughly constant at least down to 0.15 R (Kozennik & E -Darwich, 2012; E -Darwich & Korzennik, 2013). Evidence of at differential rotation in solar type stars has been produced using asteroseismological techniques (Benomar et al. 2015; Nielsen et al. 2017). All these implies that there are eficient transport mechanisms of angular momentum from the radiative core to the convective envelope (see recent review in Aerts, Mathis & Rogers 2019). Currently, models for angular momentum transport include an heuristic approximation where the transferred amount is just enough to maintain equilibrium at the core-envelope interface (MacGregor & Brenner 1991; Gallet & Bouvier 2015), braking the inner core by a pre-existing poloidal magnetic field (Mestel & Weiss 1987; Charbonneau & MacGre-gor 1993; Dennisenkov 2010), internal gravity waves generated at the convective envelope (Charbonnel & Talon 2005; Charbonnel et al. 2013) and - without being able to simultaneously reproduce the surface period, rotational pro le and lithium abundance of the Sun - internal transport of angular momentum by meridional circulation (Denisenkov 2010; Charbonnel et al. 2013; Amard et al. 2016).
Obviously, the angular momentum transfer rate depends on the torque running at the convective envelope and combinations of rotational braking and angular momentum transport models have been de-signed by Denisenkov et al. (2010), Gallet & Bouvier (2013 and 2015) and Amard et al. (2016). When dealing with close binary systems, a tidal synchronization torque must be included (Johnstone et al. 2019). And during the pre-main sequence phase, an-gular momentum transfer between the central star and the accretion disk can have a central role.
Setting “initial" conditions has not been easy. The existence of a wide spectrum of rotational periods in nearly equal mass stars from young clusters - such as h and Persei, NGC 2547 and Pleiades (Stauffer et al. 1984 and 1985; Irwin et al. 2008; Moraux et al. 2013) - implies that initial conditions are not unique. Even when they end up having the same mass, members of the same cluster are not born at the same time, and with identical rotation rates and physical structures (e.g., Henderson & Stassun 2012). Furthermore, Bouvier et al. (1993) found that the mean rotational period is significantly longer in classical T Tauri stars (CTTS) than in weak line T Tauri stars (WTTS). Noting that accretion disks and powerful winds are detected in CTTS, but not in WTTS, they explained this difference arguing that WTTS spin up as they contract without loosing angular momentum, whereas CTTS do not spin up as much (if at all) since angular momentum is still being removed by a powerful wind that is thought to be created by magnetic coupling between the central star and the accretion disk (Koenigl 1991; Collier Cameron & Campbell 1993; Collier Cameron, Campbell & Quaintrell 1995). Observations indicate that the rotational period is roughly constant during the disk locking phase (Rebull et al. 2004; Gallet & Bouvier 2013). Longer periods and disk locking times are associated to slow rotators: for a solar mass star, around 8 days and 9 Myr vs. 1.4 days and 2 Myr for fast rotators (Gallet & Bouvier 2015).
Angular momentum losses are greatly reduced after star-disk decoupling. The star spins up as it con-tracts and the rotational velocity reaches it’s largest value when the star arrives at the ZAMS - after 40 and 200 Myr for a 1.2 and 0.6 Mʘ star - and its internal structure is stabilized. Thereon, the rotational history is essentially - but not exclusively - determined by the magnetic braking mechanism first described by Schatzman (1962)).
Over the last two decades, this field of research has been greatly favored by vast improvements in observational procedures and methods of analysis focused on measuring the rotational period, parallax and magnitudes of stars. These were developed by research groups engaged in one particular field of stars or connected to long term and/or wide field campaigns, such as the Two Micron All Sky Survey (2M ASS), the European Space Mission satellite Gaia and NASA’s Kepler satellite Mission. At least equally important has been the unfolding of ex-citing ideas and techniques - asteroseismology, Zeeman splitting and Doppler imaging, and astrospheric absorption - with which we are beginning to know the internal rotational structure, the supercial magnetic field intensity and geometry, and the mass loss rate of late type main sequence stars. Lastly, the connection with basic stellar parameters - such as mass, radio, temperature, convective turnover time and moment of inertia - has been made possible thanks to evolutionary models that are regularly being updated (i.e., VandenBerg et al. 2006; Feiden et al. 2011; Bara e et al. 2015; Choi et al. 2016; Marigo et al. 2017; Spada et al. 2017).
This paper collects a vast amount of rotational, photometric and parallax data, to re-analyze the an-gular momentum history of ≈ 0.5 - 1.2 Mʘ main sequence stars, with an emphasis on those that are at least as old as the Pleiades cluster. All rotational periods, apparent magnitudes and any other observed parameter used to analyze some of these questions, are taken from the literature. In order to have a data set as uniform as possible, all infrared JHK magnitudes were collected from the 2M ASS project, and visual magnitudes were derived from the Gaia DR2 G, BP and RP band magnitudes. Like-wise, only Gaia DR2 parallaxes have been used. To minimize uncertainties and improve data set quality, stars with additional causes of variability, poorly determined period and photometry, and uncertain parallax, were excluded from the analysis. Rotational periods are taken from several sources, but not all of them report error estimates. It is worth noting that discrepancies found in some rotational periods measured by more than one research group can be much larger than the reported errors. Therefore, rotational periods are the least reliable element in this compilation, which contains one of the largest and better selected data required to analyze the evolution of angular momentum of ≈0.5 to 1.2 Mʘ main sequence stars. A general discussion of data sources is presented in §2.1, and the criteria that were used to select the best possible information are discussed in §2.2. Procedures used to obtain absolute magnitudes and stellar parameters are described in subsections §2.3 and §2.4.
The distribution of rotational periods as a function of mass and time is presented and discussed in §3.1. Assuming rigid body rotation, the behavior of angular momentum as a function of mass and age is discussed in subsection §3.2. This is not the usual approach used to study the rotational history of low mass main sequence stars but, as noticed by other authors (Johnstone et al. 2015a), the observational evidence we now have on their inner rotational structure, as well as models for angular momentum redistribution within them, indicate that this is not an unlikely hypothesis for stars older than a few hundred million years, or maybe less. Formulae relating mass and angular momentum in three rotational isochrones are included in this subsection. These are used to introduce two possible approximations for the evolution of angular momentum in main sequence stars having a mass between 0.5 and 1.2 Mʘ , using a 0.1 M bin to downsize variations due to mass differences. The special circumstances and time periods under which it is possible to obtain an age estimate directly from the rotational period are discussed in §3.3. Magnetic activity as a function of mass and time is analyzed in §3.4. Another important bonus of the rigid body rotation hypothesis is that it leads directly to simple empirical formulae for the torque as a function of mass and time, without having to use shortcuts to put together relationships between, among other things, mass, magnetic field, mass loss rate and angular velocity (subsection §3.5). To some extent, it turns the problem around. For instance, in combination with known connections be-tween age and the magnetic intensity at the stellar surface, and a simple model for the magnetic field source, these formulae lead to a clear-cut procedure to assess the mass loss rate (subsection §3.6), the least known important trait of low mass main sequence stars. The most significant results of this paper are summed up in the final section.
2. DATA
Star spots and plages transiting the stellar surface can produce a quasi-periodic modulation of light intensity that is correlated with a stellar rotation rate, Ω. Supported by long term photometric observations, readily available rotational data from a vast number of field and cluster late type main sequence stars have been produced by several research groups over the last two decades. These groups carried out meticulous time series analyses of light curves in order to determine rotational periods, in most cases using different formulations of the Lomb-Scargle method (Lomb 1976; Scargle 1982, 1989).
But notice that there is an inherent uncertainty in the physical connotation of the computed value of the rotational period at the stellar surface, since the correlation between light intensity and period is not straight forward or unambiguous. The position, lifetime and extension of star spots, plages and other superficial features, are conditioned by the latitudinal rotational shear, which is caused by rotating stellar convection transporting angular momentum from the pole to the equator, and thermal energy in the opposite direction (Busse 1970; Durney 1970; Kitchatinov & Rudiger 2005; Kuker & Rudiger 2008). Differential rotation tends to be more pronounced in stars with lower rotational periods (Henry et al. 1995), higher effective temperatures (Barnes et al. 2005) and shallower convective regions (Kuker & Rudiger 2008). Thus, the relation between these inconstant superficial features and rotational period depends on stellar mass, metallicity and age, increasingly so in spectral types where differential rotation is more pronounced and variable, and when stars are close to the beginning or the end of main sequence. As a matter of fact, Epstein & Pinsonneault (2014) noticed that latitudinal surface differential rotation introduces significant ambiguities into rotation period measurements, leading to a ≈2000 Myr uncertainty in rotation-based age estimates. All these should not be forgotten when the mass and time dependence of the rotational evolution of late type main sequence stars is considered.
2.1. Data Sources
The rotational periods of field and open cluster stars contained in 28 publications were collected in order to investigate the evolution of angular momentum during the main sequence. Twenty three of these papers are dedicated to 17 open star clusters in the Milky Way. The open cluster sample was put together with the intention of covering the largest possible range of ages after the termination of the disk locking phase. With an estimated age of 13 and 3500 Myr, h Persei and M 67 are the youngest and oldest open clusters inspected in this work. The central positions (epoch 2000.0), angular radii (Θ), parallaxes, ages, color excesses (E(B-V)) and metallicities ([Fe/H]) of these clusters are laid out in Table 1 (references in Appendix A). Some of these numbers were used in data selection and extinction correction, §2.2 and §2.3. The cluster age, metallicity and assumed initial helium abundance (Y0) are the in-put parameters for the evolutionary tracks used to derive the physical properties of cluster stars from their visual and infrared colors, §2.4.
Table 1 Cluster parameters*
| Cluster | RA | DEC | Parallax | Age | E(B-V ) | [F e=H] | Y0 | |
| deg | deg | deg | mas | Myr | - | - | ||
| h Persei | 34.770 | 57.150 | 1.75 | 0.547± 0.122 | 13± 1 | 0.515± 0.035 | 0.00 | 0.28 |
| IC 4665 | 266.498 | 5.565 | 1.00 | 2.892±0.003 | 40±10 | 0.177±0.003 | -0.06±0.10 | 0.27±0.01 |
| NGC 2547 | 122.565 | -49.050 | 0.30 | 2.544±0.002 | 40±10 | 0.050±0.010 | -0.14±0.10 | 0.27±0.01 |
| Blanco 1 | 1.029 | 29.833 | 2.90 | 4.194±0.041 | 100±30 | 0.010±0.000 | 0.03±0.07 | 0.28±0.01 |
| Pleiades | 56.300 | 24.120 | 6.40 | 7.364±0.005 | 120±20 | 0.037±0.007 | 0.00±0.05 | 0.28±0.01 |
| M 35 | 92.268 | 24.296 | 0.95 | 1.119±0.002 | 155±30 | 0.228±0.028 | -0.21±0.10 | 0.27±0.01 |
| NGC 2301 | 102.940 | 0.460 | 0.25 | 1.026±0.084 | 180±40 | 0.029±0.001 | 0.05±0.05 | 0.28±0.01 |
| M 34 | 40.584 | 42.703 | 0.37 | 1.954±0.003 | 210±40 | 0.070±0.000 | 0.02±0.06 | 0.28±0.01 |
| M 37 | 88.070 | 32.550 | 0.32 | 0.704±0.072 | 450±100 | 0.291±0.050 | 0.02±0.05 | 0.28±0.01 |
| M 48 | 123.383 | -5.736 | 0.73 | 1.290±0.002 | 500±150 | 0.030±0.010 | 0.08±0.03 | 0.28±0.01 |
| Coma Berenices | 185.620 | 25.850 | 7.50 | 11.640±0.034 | 600±50 | 0.010±0.010 | 0.00±0.08 | 0.28±0.01 |
| Hyades | 66.725 | 15.867 | 13.35 | 21.052±0.065 | 750±50 | 0.005±0.005 | 0.14±0.02 | 0.28±0.01 |
| Praesepe | 130.090 | 19.690 | 3.00 | 5.371±0.003 | 750±50 | 0.018±0.009 | 0.16±0.08 | 0.29±0.01 |
| NGC 6811 | 294.310 | 46.390 | 0.30 | 0.873±0.014 | 1000±200 | 0.062±0.012 | 0.03±0.03 | 0.28±0.01 |
| NGC 752 | 29.520 | 37.810 | 1.45 | 2.330±0.143 | 1350±50 | 0.040±0.000 | -0.06±0.03 | 0.27±0.01 |
| NGC 6819 | 295.320 | 40.190 | 0.22 | 0.335±0.023 | 2100±400 | 0.133±0.033 | 0.09±0.02 | 0.28±0.01 |
| M 67 | 132.848 | 11.837 | 0.31 | 1.133±0.001 | 3500±500 | 0.039±0.011 | 0.03±0.05 | 0.28±0.01 |
*RA and DEC are the right ascension and declination of the cluster center in degrees, epoch 2000.0; Θ is the cluster angular radius (degrees); the mean parallax is given in miliarcseconds; ages are given in million year units (Myr); E(B-V ) is the color excesses; [Fe/H] is the metallicity with respect to the solar value; Y0 is the initial helium mass abundance assumed for the evolutionary tracks used to compute physical properties of cluster stars.
Rotational periods of field stars were computed by several research groups using observations from the CoRoT satellite (Affer et al. 2012), the HATNet survey for transiting extrasolar planets (Hartman et al. 2011), and the Kepler satellite project (Nielsen et al. 2013; Reinhold et al. 2013; McQuillan, Mazeh & Aigrain 2014).
To homogenize the data set, the Vizier1 facility was used to collect the spectral type, visual magnitude and classication of each star as reported by SIMBAD2, their G, BP and RP band magnitudes and parallax from Gaia DR23, and their J, H and K magnitudes from the Two Micron All Sky Survey4 (herein 2M ASS).
This information is collected in a number of tables containing stellar coordinates (degrees, epoch 2000; precise within 1 arcsec), spectral types (‘*?’ when unknown), visual magnitude as reported in SIMBAD (as a reference), Johnson-Cousins visual magnitudes calculated from the Gaia DR2 G, BP and RP band magnitudes and the transformation laws found by Evans et al. (2018), J, H and K 2M ASS magnitudes, rotational periods (days) and Gaia DR2 parallaxes (miliarcsec). When there is no information for any of these quantities, the corresponding field value is 999.9.
These tables include all the stars reported in each rotational data source. Rotational periods in the Kepler field and the Pleiades, M 34, Hyades and Praesepe open clusters were searched for by more than one research group. Additional tables excluding duplicate stars were produced for these clusters and the field. Mean periods are reported for stars with multiple measurements, with the period error being equal to half the difference between the shortest and longest period.
Several filters were applied to select stars with good photometric and astrometric data quality and no possible caveats regarding contamination from other motives of variability besides single star rotation. As explained in the following subsection, distinctive flags are added when these filters are activated.
2.2. Data Filters
A ag following the visual magnitude derived from the Gaia data is set to ‘XX’ under column GP , when it could not be calculated because at least one of the Gaia DR2 G, BP and RP magnitudes and their errors is missing, or the photometric flux over error in any of these bands is smaller than 5. Otherwise, the Gaia ag GP is set to ‘-’.
A ag following 2M ASS magnitudes is set to ‘XX’ under column 2P if either one of the J, H and K magnitudes and their errors is absent, the photometric flux over error in any band is smaller than 5, the 2M ASS quality ag is not set to ‘AAA’ and the star may be contaminated by an extended source (their X flg is larger than zero). Otherwise, the 2M ASS ag 2P attached to the J, H and K magnitudes is set to ‘-’.
Databases were used to identify possible non main sequence stars, object types that may indicate that the angular momentum evolution of a single star may have been affected by an external agent (such as stellar companions and planetary systems) or light curve modulations produced by other sources of variability besides single star rotation. Namely, the following types (in parenthesis, condensed name for object classification recommended by SIMBAD):
-stars with known exoplanets (Pl*) as of 02-07-2019, according to the NASA Exoplanet Science Institute5,
- double or multiple stars (**, *i*) and spectroscopic binaries (SB*), according to the Ninth Catalogue of Spectroscopic Binary Orbits (Pourbaix et al. 2004), SIMBAD, W ashington Double Star Catalog6 and other sources,
-Algol, β-Lyrae, W-Uma, RS CVn and X-ray and eclipsing binaries (Al*, bL*, WU*, RS*, XB*, EB*, EB*WUma, EB*betLyr,), according to SIM-BAD and other sources,
-ellipsoidal, symbiotic, cataclysmic, pulsating, δ-Scuti, γ-Doradus, RR-Lyrae, classical Cepheid, Cepheid, SX Phe and Mira and long period variables (El*, Sy*, CV*, Pu*, dS*, gD*, RR*, cC*, Ce*, SX*, LPV*), according to SIMBAD, Holl et al. (2018) and other sources,
-brown dwarfs (BD*) and T-Tauri stars (TT*), ac-cording to SIMBAD and
-not in main sequence, according to SIMBAD and other sources (No-MS*; this abbreviation is not used by SIMBAD).
When present, these name tags are reported under column label Comment. This Comment may also include the following name tags
-XPlx if there is no Gaia DR2 parallax measurement, the parallax error is larger than 20%, the astrometric excess noise (epsi) is larger than 2, the used visibility periods (Nper) are less than 8 and duplicate sources (Dup) may be present,
-XPer when no rotational period is measured or the rotational period is reported as questionable or the period-to-period-error ratio is smaller than 5. When there is more than one data source - as in the Hyades, M 34, Pleiades and Praesepe clusters, as well as in the Kepler field stars - the period is assumed to be equal to the mean value and the period error is taken as half the difference between the shortest and longest period. Period uncertainty was significant in stars from the Kepler field and the M 34 and Pleiades open clusters (4925, 18 and 36 rejections), implying that formal errors in the mathematical analysis may underestimate other basic sources of uncertainty in the determination of rotational periods. Some sources of uncertainty may be associated to the wavering nature of stellar activity. Unfortunately, errors in the reported rotational period are not given in a large number of papers, so that an indefinite number of stars with less than adequate period measurements could not identified.
The final comment is set to ‘-’ when the star has not been associated to any of the preceding types and the stellar parallax and period have been adequately measured. There are electronic versions of tables for primary data from field and open cluster stars (http://vizier.u-strasbg.fr/viz-bin/VizieR?-source=J/other/RMxAA/56.1, http://ftp://cdsarc.u-strasbg.fr/pub/cats/J/other/RMxAA/56.1). As an example, see Table 2.
Table 2 Coma berenices. Data
| AR(2000) | DEC(2000) | SpType | V | V | GP | J | H | K | 2P | Period | Parallax | Comment |
| deg | deg | Simbad | Gaia | 2MASS | 2MASS | 2MASS | days | mas | ||||
| 177.157089 | 28.275139 | G7 | 10.380 | 10.414±0.001 | - | 9.015±0.026 | 8.629±0.029 | 8.585±0.020 | - | 9.430±999.900 | 11.199±0.037 | - |
| 178.888962 | 29.728251 | K0V | 11.420 | 11.611±0.001 | - | 9.692±0.022 | 9.188±0.022 | 9.057±0.017 | - | 11.550±999.900 | 11.056±0.051 | - |
| 180.217667 | 27.323305 | G9 | 11.510 | 11.482±0.001 | - | 9.674±0.022 | 9.115±0.021 | 8.996±0.018 | - | 10.630±999.900 | 0.892±0.052 | - |
| 180.595245 | 22.916306 | K4 | 12.220 | 12.602±0.001 | - | 999.900±999.900 | 999.900±999.900 | 999.900±999.900 | XX | 14.110±0.080 | 5.381±0.040 | - |
| 181.990494 | 25.586472 | K3.1 | 11.060 | 11.318±0.001 | - | 9.534±0.022 | 9.028±0.019 | 8.906±0.017 | - | 10.280±999.900 | 10.784±0.113 | - |
| 182.150421 | 31.102751 | K7 | 11.030 | 999.900±999.900 | XX | 10.167±0.022 | 9.545±0.021 | 9.402±0.017 | - | 11.920±999.900 | 11.238±0.041 | - |
| 182.896454 | 29.379028 | K2.8 | 11.210 | 11.252±0.001 | - | 9.575±0.022 | 9.053±0.027 | 8.979±0.024 | - | 10.255±0.115 | 11.194±0.043 | - |
| 183.221786 | 26.250360 | K2.2 | 11.400 | 11.390±0.001 | - | 9.577±0.018 | 9.106±0.016 | 8.990±0.018 | - | 10.880±999.900 | 11.589±0.041 | - |
| 185.315079 | 26.153889 | K3.5 | 11.500 | 11.446±0.001 | - | 9.614±0.019 | 9.087±0.024 | 8.972±0.020 | - | 10.880±999.900 | 11.776±0.044 | - |
| 185.946747 | 23.245640 | K4 | 11.210 | 11.563 0.001 | - | 9.677±0.021 | 9.129±0.022 | 9.018±0.018 | - | 11.183±0.055 | 11.751±0.038 | - |
| 186.505463 | 34.352333 | G8 | 11.980 | 11.624 0.002 | - | 9.845±0.022 | 9.276±0.016 | 9.143±0.017 | - | 11.900±999.900 | 0.662±0.033 | |cC* |
| 186.712631 | 26.267166 | K4.8 | 11.730 | 999.900±999.900 | XX | 9.855±0.022 | 9.275±0.026 | 9.156±0.020 | - | 11.527±0.245 | 11.632±0.058 | - |
| 186.735336 | 22.681862 | *? | 11.030 | 15.064±0.000 | - | 12.300±0.020 | 11.655±0.023 | 11.454±0.018 | - | 11.540±999.900 | 5.416±0.032 | - |
| 186.836166 | 23.329834 | G7.9 | 10.320 | 10.293±0.000 | - | 8.912±0.021 | 8.537±0.021 | 8.451±0.017 | - | 9.050±999.900 | 11.898±0.041 | - |
| 186.951202 | 28.194389 | G5.4 | 9.600 | 999.900±999.900 | XX | 8.436±0.023 | 8.050±0.046 | 8.050±0.023 | - | 8.602±0.040 | 12.228±0.044 | - |
| 187.235123 | 26.549278 | G9IV | 10.800 | 10.752±0.001 | - | 9.208±0.026 | 8.768±0.031 | 8.661±0.023 | - | 9.420±0.160 | 11.856±0.048 | |NoMS* |
| 187.425629 | 28.620722 | K2.5 | 11.320 | 11.278±0.001 | - | 9.791±0.027 | 9.304±0.031 | 9.198±0.020 | - | 16.050±999.900 | 0.790±0.060 | - |
| 188.129456 | 35.331165 | G0 | 9.700 | 9.580±0.000 | - | 8.407±0.019 | 8.132±0.023 | 8.086±0.018 | - | 7.690±999.900 | 11.960±0.044 | |XPlx |
| 188.333374 | 22.406473 | G7.8 | 10.320 | 10.268±0.001 | - | 8.855±0.019 | 8.470±0.023 | 8.402±0.020 | - | 8.330±999.900 | 11.915±0.060 | |XPlx |
| 188.424500 | 29.233805 | K4 | 11.580 | 11.437±0.001 | - | 9.545±0.028 | 8.981±0.067 | 8.863±0.020 | - | 16.880±999.900 | 8.370±0.038 | - |
| 188.425507 | 25.942778 | G6III: | 10.590 | 10.504±0.000 | - | 9.031±0.029 | 8.601±0.036 | 8.584±0.020 | - | 8.400±0.020 | 11.092±0.055 | |XPlx-NoMS* |
| 188.475922 | 27.134640 | K3.3 | 11.800 | 11.717±0.001 | - | 10.014±0.022 | 9.487±0.021 | 9.384±0.020 | - | 16.540±999.900 | 0.646±0.050 | - |
| 188.726212 | 27.455610 | G4.8 | 9.000 | 9.016±0.000 | - | 7.897±0.029 | 7.583±0.040 | 7.510±0.020 | - | 10.980±999.900 | 8.336±0.357 | |XPlx |
| 189.547791 | 23.556168 | M0 | 11.030 | 13.645±0.000 | - | 10.776±0.022 | 10.163±0.023 | 9.963±0.020 | - | 14.460±999.900 | 11.453±0.041 | - |
| 189.924957 | 21.582777 | K5 | 11.890 | 11.564±0.001 | - | 9.488±0.020 | 8.934±0.022 | 8.799±0.018 | - | 9.570±999.900 | 0.086±0.037 | |XPlx |
| 190.646423 | 41.091026 | K0III | 11.700 | 11.787±0.001 | - | 9.956±0.027 | 9.398±0.030 | 9.273±0.022 | - | 11.760±999.900 | 0.634±0.028 | |NoMS* |
| 190.789703 | 24.784779 | *? | 11.030 | 13.832±0.001 | - | 10.712±0.020 | 10.076±0.021 | 9.896±0.020 | - | 2.770±999.900 | 10.551±0.098 | - |
| 191.347290 | 42.851223 | *? | 11.030 | 14.565±0.001 | - | 10.788±0.027 | 10.239±0.032 | 9.987±0.024 | - | 12.050±999.900 | 11.562±0.079 | - |
| 192.251755 | 25.359888 | K5V | 12.000 | 11.958±0.001 | - | 9.750±0.020 | 9.190±0.021 | 9.069±0.015 | - | 12.270±999.900 | 12.294±0.064 | - |
| 192.376785 | 25.536417 | K0III | 11.440 | 11.554±0.002 | - | 9.613±0.021 | 9.053±0.015 | 8.931±0.019 | - | 19.165±0.345 | 1.021±0.054 | |NoMS* |
| 192.507080 | 21.053362 | K3 | 11.160 | 11.226±0.001 | - | 9.558±0.021 | 9.075±0.019 | 8.976±0.015 | - | 13.340±999.900 | 4.419±0.459 | |XPlx |
| 193.048370 | 25.373472 | F8V | 8.830 | 8.840±0.000 | - | 7.881±0.021 | 7.652±0.021 | 7.609±0.015 | - | 6.920±999.900 | 11.747±0.043 | |XPlx |
| 193.311127 | 24.053778 | K5 | 11.030 | 12.216±0.003 | - | 10.202±0.023 | 9.573±0.031 | 9.452±0.024 | - | 19.020±999.900 | 0.615±0.035 | - |
| 193.579498 | 32.826416 | *? | 11.030 | 13.186±0.000 | - | 10.305±0.020 | 9.666±0.016 | 9.496±0.016 | - | 15.690±999.900 | 14.939±0.041 | |XPlx |
| 194.403580 | 28.979084 | G4V | 10.360 | 10.211±0.001 | - | 8.897±0.026 | 8.539±0.046 | 8.473±0.020 | - | 7.940±999.900 | 10.901±0.066 | - |
| 194.865631 | 19.687529 | K5 | 12.110 | 11.830±0.002 | - | 9.726±0.022 | 9.196±0.023 | 9.034±0.019 | - | 11.240±999.900 | 0.812±0.045 | - |
| 196.433289 | 20.055944 | K2 | 11.030 | 11.318±0.001 | - | 9.527±0.020 | 9.011±0.017 | 8.922±0.022 | - | 11.040±999.900 | 0.961±0.035 | |** |
The number of stars with measured rotational periods in each cluster and field is given under Column Per in Table 3. The number of stars that were selected after passing all data filters is under Column OK in the same table. Notice that there is a large fraction of rejected stars in most open clusters. There are many reasons for this to be so, but the most frequent is insufficiently accurate parallax (94, 60 and 47% in h Persei, M 37 and NGC 6819), generally in clusters that are farther away. Stellar parallax is also poor in a large fraction of stars associated to the two open clusters that are closer to us, Hyades and Coma Berenices (43 and 21%). The next two main reasons for rejection are poor or non-existent 2M ASS photometry and association to a multiple system, with very high levels of incidence in h Persei, IC 4665 and NGC 6819. Parallax was too inaccurate in 59% of the HAT N et field stars, and 42% of the CoRoT field stars are not in the main sequence. Fortunately, all these problems affected a much smaller fraction of Kepler field stars.
Table 3 Stars in each cluster and field*
| Cluster | P er | OK | V IR | IR | Cluster | P er | OK | V IR | IR | |||
| h Perseia | 586 | 20 | 19 | 19 | IC 4665b | 19 | 6 | 0 | 5 | |||
| NGC 2547c | 176 | 152 | 6 | 110 | Blanco 1d | 33 | 23 | 19 | 20 | |||
| Pleiades-Ce | 132 | 70 | - | - | Pleiades-Hf | 516 | 368 | - | - | |||
| Pleiades-Rg | 759 | 611 | - | - | Pleiades-All | 997 | 741 | 64 | 320 | |||
| M 35h | 441 | 297 | 82 | 282 | NGC 2301i | 133 | 83 | 83 | 82 | |||
| M 34-Ij | 83 | 60 | - | - | M 34-Jk | 55 | 34 | - | - | |||
| M 34-Ml | 120 | 22 | - | - | M 34-All | 243 | 102 | 89 | 102 | |||
| M 37m | 657 | 125 | 31 | 119 | M 48n | 54 | 51 | 51 | 51 | |||
| Coma Bero | 37 | 20 | 6 | 8 | Hyades-Dep | 62 | 30 | - | - | |||
| Hyades-Doq | 48 | 14 | - | - | Hyades-Rr | 22 | 6 | - | - | |||
| Hyades-All | 123 | 58 | 7 | 19 | Praesepe-As | 40 | 20 | - | - | |||
| Praesepe-Dt | 52 | 0 | - | - | Praesepe-Su | 54 | 36 | - | - | |||
| Praesepe-All | 137 | 114 | 28 | 90 | NGC 6811v | 71 | 53 | 52 | 52 | |||
| NGC 752w | 12 | 8 | 8 | 8 | NGC 6819x | 30 | 7 | 6 | 7 | |||
| M 67y | 20 | 16 | 16 | 16 | ||||||||
| Field | P er | OK | V IR | IR | Field | P er | OK | V IR | IR | |||
| CoRoTa | 1978 | 781 | 694 | 761 | HATNetb | 2018 | 704 | 176 | 322 | |||
| Kepler-Mc | 34186 | 28507 | - | - | Kepler-Nd | 12151 | 9841 | - | - | |||
| Kepler-Re | 24124 | 20027 | - | - | Kepler-All | 41239 | 31156 | 27494 | 29032 |
*Per: stars with measured rotational periods. OK: stars that passed all data filters. VIR: stars where the visual and infrared magnitudes were matched by a stellar model. IR: stars where only the infrared magnitudes were reproduced by a stellar model. Cluster period data: (a) Moraux et al. 2013; (b) Scholz, Eislo el & Mundt 2009; (c) Irwin et al. 2008; (d) Cargile et al. 2014; (e) Covey et al. 2016; (f) Hartman et al. 2010; (g) Rebull et al. 2016; (h) Meibom, Mathieu & Stassun 2009; (i) Sukhbold & Howell 2009; (j) Irwin et al. 2006); (k) James et al. 2010; (l) Meibom et al. 2011; (m) Messina et al. 2008, Hartman et al. 2009 & Nuñez et al. 2015; (n) Barnes et al. 2016; (o) Collier Cameron et al. 2009; (p) Delorme et al. 2011; (q) Douglas et al. 2016; (r) Radick et al. 1987 & 1995; (s) Agüeros et al. 2011; (t) Delorme et al. 2011; (u) Scholz et al. (2011); (v) Meibom et al. 2011; (w) Agüeros et al. 2018; (x) Meibom et al. 2015; (y) Barnes et al. (2016). Field period data: (a) Affer et al. 2012; (b) Hartman et al. 2011; (c) McQuillan, Mazeh & Aigrain 2014; (d) Nielsen et al. 2013; (e) Reinhold et al. 2013.
In total, the rotational period has been measured for 3769 members of the 17 clusters listed in Table 1, and for 45235 field stars observed by the CoRoT , HAT N et and Kepler projects. Out of these, the data filters approved 1876 cluster and 32641 field stars.
2.3. Extinction Correction
Gaia DR2 provides an estimate of line-of-sight extinction, AG, and reddening, E(BP - RP ) for each star. After a careful analysis of the Gaia DR2 database, Andrae et al. (2018) concluded that these line-of-sight extinction estimates are not accurate at the single star level and, concurrently, that there are no clearly defined transformations between AG and AV , and E(BP - RP ) and E(B - V ). Consequently, absolute magnitudes of open cluster stars were determined assuming that the color excess is the same for all stars and is as given in Table 1. This is a particularly weak assumption in young clusters, where dust distribution can be very inhomogeneous at the intra-cluster and individual level. For eld stars, the extinction model is a smooth vertically-exponential dust disk, and the extinction coe cient at galactic latitude b and distance d is
where C(0) is the mid-plane extinction coefficient and h is the model scale-height, which is taken as equal to 0.14 kpc (Koppen & Vergely 1998; Marshal et al. 2006; Brown et al. 2011). The assumed mid-plane extinction coefficients are CV = 1.0, CJ = 0.35, CH = 0.25 and CK = 0.15 magnitudes per kiloparsec (Indebetouw et al. 2005). Implicitly, line of sight variations are supposed to be a minor correction.
2.4. Stellar Parameters
Stellar parameters were inferred matching (within error bars) the observed absolute magnitudes in the Johnson-Cousins V band, and the Bessel & Brett J, H and K bands, with those deduced from the latest Yale-Potsdam stellar isochrones (Spada et al. 2013; Spada et al. 2017, herein YaPSI) and the semi-empirical color-temperature calibration of Worthey & Lee (2011). The 2M ASS magnitudes were con-verted to the Bessel & Brett system using formulae derived by Carpenter (2001). The parameter space of YAPSI models is dense enough to carry out de-tailed interpolations over a broad spectrum of possibilities: from the birth line to the onset of helium ignition in the core, 0.15 to 5.0 Mʘ , [Fe/H] = -1:5 to 0.3 and Y0 = 0.25 to 0.37. Notice that these are iron and helium abundances at the birth line, not the larger values they have at a posterior time. Besides the usual parameters (mass, gravity, luminosity, temperature, etc.), the YaPSI archives also include the depth of the convective envelope, the convective overtime timescale and the moments of inertia of the entire star and its convective envelope. These quantities are essential in the understanding of the evolution of angular momentum, magnetic activity and mass loss.
The physical parameters of open cluster stars are assumed to be equal to the mean values of models having 27 different age, [Fe/H] and Y0 combinations, with each of these parameters being equal to the minimum, mean and maximum values given in Table 1. For instance, the YaPSI models used for the Pleiades are 27 combinations of three age estimates (100, 120 and 140 Myr), three initial iron abundances (-0.05, 0.00 and 0.05) and three initial helium abundances (0.27, 0.28 and 0.29). No attempt is made to estimate and use the initial abundances of iron and helium, but these are probably close to the minimum values. In Table 3, the number of stars with a model accounting for their visual and infrared magnitudes is under Column VIR, and in Column IR when only the infrared magnitudes were matched. To exclude multiple observations of individual stars, data les from the Pleiades, M 34, Hyades and Praesepe clusters were merged into one (name-All).
The visual and infrared magnitudes of a substantial fraction of stars in the Hyades (65%), Pleiades (57%) and NGC 2547 (29%) open clusters could not be reproduced with any of the corresponding YaPSI models, suggesting that there may be larger than explored differences in the chemical makeup of stars that are thought to be part of these open clusters and/or that extinction corrections were inadequate in a large number of them. In this respect, model matching including visual magnitudes was substantially more ineffective in IC 4665, NGC 2547, Pleiades, M 37, M 35, Praesepe and Hyades, which may imply that uniform extinction is an inadequate assumption for these relatively young associations. Notice that this does not hold in every young cluster (for instance, h Persei, M 48, NGC 2301 and Blanco 1) and certainly not in those that are older than 1000 Myr. Fluctuations in the predicted values of all physical parameters were less than 10% in nearly all open cluster stars. The most notable exception is NGC 2301, where all predicted stellar parameters fluctuate more than 30% in every star.
Model results were equally discouraging in 1 out of 4 stars from the Hyades and 3 out of 7 in NGC 6819. Unfortunately, being more massive than 1.35 Mʘ, the few remaining stars from the relatively and conveniently old NGC 6819 open cluster are probably not subject to rotational braking. To use a sufficiently large amount of data, the impending analysis will include cluster stars where the visual magnitude could not be matched.
The physical parameters of field stars were extracted after inspecting a set of models with an initial close to solar-like metallicity and helium abundance ([Fe/H] = 0.0 and Y 0 = 0.28) and 37 possible ages, from 1 to 13000 Myr. The observed period was used as a roughly confined mass dependent age restriction. This is imperative, since there are important changes in the moment of inertia at the beginning (first ≈ 100 Myr) and during the second half of the main sequence, as can be appreciated in Figure 1.

Fig. 1 Ratio of the moment of inertia at time t, I(t), with respect to the moment of inertia at t = 1000 Myr. Dotted lines are for M=Mʘ = 0.5 (green), 0.6 (black), 0.7 (red) and 0.8 (blue). Continuous lines are for M=Mʘ 0.9 (green), 1.0 (black), 1.1 (red) and 1.2 (blue). The color figure can be viewed online.
The visual and infrared magnitudes of a very small fraction of HAT N et field stars with high quality data and no other possible sources of variability could be reproduced with a YaPSI model, and nearly half of these models were theoretically inaccurate at the 30% level or more. A stellar model matching visual and infrared magnitudes could be found for the majority of CoRoT field stars that survived the data filters, but more than half of them were also inexact to a very high level. To exclude multiple observations, Kepler field data les were merged into Kepler-All. At least one stellar model was able to account for the visual and/or infrared magnitudes of 90% of main sequence Kepler field stars. The predicted mass, temperature, radius and gravity (its logarithm) of the vast majority of these stars (at least 8 out of 10) is theoretically accurate at the 90% level or better, and less than 66% certain in roughly 1 out of 40 stars. The moment of inertia is precise at the 90% level in 8 out of 10 stars, but very un-certain in 1 out of 10. Results are slightly worse for the stellar luminosity. Since many more Kepler field stars were observed with a higher quality and success rate, CoRoT and HAT N et field stars will no longer be considered. Being more reliable, the ensuing analysis will only deal with Kepler field stars for which the visual and infrared magnitudes are reproduced.
At least one model matched the infrared magnitudes of 1311 and 30115 open cluster and field stars, and the visual and infrared magnitudes of 566 and 28364 of these stars. Electronic versions of tables with physical parameters of stars in each cluster and field are available upon request (http://vizier.u-strasbg.fr/viz-bin/VizieR?-source= J/other/RMxAA/56.1, ftp://cdsarc.u-strasbg.fr/pub/cats/J/other/RMxAA/56.1). As an example, see Table 4.
Table 4 Coma berenices. Parameters*
| AR(2000) | DEC(2000) | M M | T | L=L | R=R | log g | Ie=It | Period | J47 | NM | |
| 178.888962 | 29.728251 | 0.79 0.01 | 4780 47 | 0.240 0.006 | 0.71 0.00 | 4.62 0.00 | 0.26 0.01 | 11.55 999.90 | 28.821 0.992 | 7 | |
| 183.221786 | 26.250360 | 0.77 0.00 | 4842 11 | 0.244 0.001 | 0.70 0.00 | 4.63 0.00 | 0.24 0.00 | 10.88 999.90 | 28.544 0.538 | 2 | |
| 185.315079 | 26.153889 | 0.78 0.01 | 4734 60 | 0.226 0.007 | 0.71 0.00 | 4.63 0.00 | 0.26 0.01 | 10.88 999.90 | 29.915 1.404 | 6 | |
| 186.735336 | 22.681862 | 0.61 0.01 | 4047 47 | 0.079 0.002 | 0.57 0.01 | 4.70 0.00 | 0.36 0.01 | 11.54 999.90 | 17.351 0.943 | 19 | |
| 186.836166 | 23.329834 | 0.90 0.00 | 5445 25 | 0.514 0.007 | 0.81 0.00 | 4.58 0.00 | 0.17 0.01 | 9.05 999.90 | 44.585 0.406 | 2 | |
| 189.547791 | 23.556168 | 0.58 0.01 | 3963 41 | 0.065 0.001 | 0.54 0.01 | 4.73 0.00 | 0.39 0.01 | 14.46 999.90 | 12.206 0.621 | 3 | |
| 190.789703 | 24.784779 | 0.63 0.00 | 4095 14 | 0.089 0.001 | 0.59 0.00 | 4.69 0.00 | 0.35 0.00 | 2.77 999.90 | 78.544 1.405 | 4 | |
| 194.403580 | 28.979084 | 0.95 0.01 | 5641 84 | 0.660 0.029 | 0.85 0.00 | 4.55 0.00 | 0.14 0.01 | 7.94 999.90 | 55.409 2.500 | 6 | |
*Ie=It is the envelope-to-total moment of inertia ratio.J47 is the solid body angular momentum in units of 1047 gr cm2/s.
NM is the number of models that matched the infrared and visual magnitudes.
3. Analysis and discussion
3.1. Rotational Period as a Function of Mass and Time. First Round.
With their data, McQuillan, Mazeh & Aigrain (2014) produced a figure for the logarithm of the rotational period as a function of mass for Kepler field stars (their Figure 1). Almost all periods are within rather well defined lower and upper mass dependent limits. Referring to empirical gyrochronology models, they mention that the upper envelope period distribution is broadly consistent with an age of 4500 Myr. The rotational period lower boundary was not discussed and, consequently, no age estimate was provided for this border.
McQuillan, Mazeh & Aigrain (2014) also point out that their figure exhibits a bimodal period distribution for stellar masses less than ≈ 0:6 Mʘ . The existence of large dispersions and bimodality in the rotation rates of young open cluster G and K main sequence stars has been noticed for some time (Soderblom, Jones & Walker, 1983). Tracing fast and moderate-to-slow rotation sequences in several young clusters, Meibom et al. (2011a) found that this distribution tends to vanish in older clusters, with more massive stars being more likely to con-verge on a single rotational sequence. The bimodal period distribution of late K and M dwarf field stars is in line with this observation.
The rotational period as a function of mass for the Kepler field stars that passed all data filters and had their visual and infrared colors reproduced by a YaPSI model (as described above), is shown in the upper panel of Figure 2. The Sun, α Cen A and B (4850 ± 500 Myr; Bazot et al. 2007; Dewarf, Datin & Guinan 2010) and 16 Cygnus A and B (6800 ± 400 Myr; Davies et al. 2015) are included in this figure. McQuillan, Mazeh & Aigrain (2014) introduced a limit of Teff < 6500K in their analysis, since they were only interested in stars with convective envelopes. When this limit is not introduced, an unanticipated result is a large number of slow rotators that are more massive than ≈1:3 Mʘ . A smaller number of such stars are also found in the Reinhold et al. (2013) analysis of the Kepler database. If on the main sequence, these stars are predicted to be rotating more rapidly, since they have a very shallow convective envelope (if at all) and therefore no enhanced magnetic field to lessen their angular momentum. On the other hand, longer periods and lower temperatures are expected if they are turning away from main sequence. This combination is found in a number of cases. As can be seen in Figure 2, very few stars less massive than ≈0:5 Mʘ were left after the data filters were applied and this may be the reason why the bimodal period distribution of low mass field stars is no longer apparent. Besides these two questions, there are no other overall differences between this figure and Figure 1 in McQuillan, Mazeh & Aigrain (2014).

Fig. 2 Rotational period (P, days) as a function of mass (solar units). Upper and lower panel: Kepler eld stars (black). Lower panel: stars from the Pleiades (red, 120 Myr), M 35 (magenta, 155 Myr), Praesepe (green, 750 Myr), NGC 6811 (yellow, 1000 Myr), NGC 752 (yel-low, 1350 Myr) and M 67 (cyan, 3500 Myr) open clusters. Only open cluster stars with errors less than 10% in their observational parameters are shown in this figure. Open stars and filled triangles are for Cen A and B (yellow) and 16 Cygnus A and B (red). The data for these stars are in Table 6. The color figure can be viewed online.
Most of the lower boundary of the cone defined by the Kepler field stars draws the rotational period of stars once they have stabilized in the main sequence, sometime after reaching a steady rotational shear and moment of inertia. An age estimate of the lower boundary for the period distribution can be established plotting the period as a function of mass in stars from young open clusters with known age. The lower panel of Figure 2 also contains the rotational periods of stars from several open clusters. To avoid cluttering, only open cluster stars with errors less than 10% in their observational parameters are shown in this figure. The same conclusions are obtained when all the stars used in the numerical analysis (errors less than 20%) are included in this plot. It is quite remarkable that most of the lower boundary coincides with the position occupied by slowly rotating Pleiades stars, setting the location of a zero age rotational main sequence for late type stars at approximately 120 Myr after birth. The location of slow rotators in the M 35 cluster runs in parallel but with slightly shorter periods, suggesting that this cluster is not 155 Myr old, but younger than the Pleiades.
There is a single, well de fined, mass dependent period distribution in the Pleiades, M 35 and Praesepe open clusters, as long as the stellar mass is larger than ≈ 0:8 Mʘ . Early convergence to a single period distribution in the high mass range is sup-ported by the fact that no fast 0.7 - 1.2 Mʘ rotators were found in M 37 (450 Myr) and M 48 (500 Myr). On the other hand, M 34 is a 210 Myr old open cluster supporting the notion that convergence to a single distribution in this mass range may take more than 120 Myr; the rotational periods of most Pleiades and M 34 stars more massive than ≈ 0.8 Mʘ are comparable, but quite a few stars in M 34 are fast rotators with significantly lower periods than Pleiades and M 35 stars with a similar mass. Unfortunately, in NGC 2301 (180 Myr) there are no rotational periods for stars more massive than ≈0:8 Mʘ . In conclusion, high quality data indicate that after ≈120 Myr, most ≈0:8 1:2 main sequence stars converge to the rotational sequence defined by the Pleiades. This is earlier than previously thought (around 600 Myr). One of the possible reasons for this discrepancy is that past estimates used a larger mass bin (at least 0.2 Mʘ in Gallet & Bouvier 2013 and 2015) and combined data from clusters with different ages (Johnstone et al. 2015a). Notice that the dispersion - and the impression that there is no convergence - will increase when these operations are carried out. Finally, there are signs of a bimodal period distribution in Pleiades, M 35 and Praesepe (750 Myr) stars less massive than ≈0:8 Mʘ , but no indication of such a thing in older clusters. Notice that there are relatively few fast rotators in Praesepe and, at least down to ≈0:5 Mʘ , apparently none in clusters older than 750 Myr, such as NGC 6811 (1000 Myr) and NGC 752 (1350 Myr). Thus, nearly all 0.5 - 0.8 Mʘ stars seem to merge into a single mass dependent rotational evolutionary sequence sometime after 750 Myr.
The relative position of the rotational period distributions of stars from the Pleiades, M 35, Prae-sepe, NGC 6811 (1000 Myr), NGC 752 (1350 Myr) and M 67 (3500 Myr) open clusters leaves no doubt that there is an evolutionary sequence. Stars from the oldest open cluster depicted in this figure, M 67, do not draw a similarly clear continuous line as the Pleiades stars, and the upper boundary (long periods) drawn by Kepler field stars is not as well defined. An interesting point is that α Cen A and B, which are ≈1000 older than M 67, are close to the site occupied by stars from this open cluster. This indicates that once they merge into a single rotational sequence, angular momentum evolution of single solar type stars (mass between 0.9 and 1.1 Mʘ) is weakly dependent on binarity when the orbital period is sufficiently long (79 years in α Cen AB). Additionally, it implies that rotational braking of solar type stars is increasingly ineficient as they grow old. The second conclusion is strongly supported by the fact that there is hardly any difference between the rotational period of these stars and 16 Cygnus A and B, which are ≈3000 Myr older than the M 67 cluster. It is worth noting that the long-term rotational evolution of the Sun as a single star does not seem to have been affected in a major way by our planetary system. It remains to be seen which conditions are necessary for this to happen.
3.2. Rigid Body Angular Momentum as a Function of Mass and Time
Since angular momentum and rotational energy are the physical quantities that change during stellar evolution, we can not expect a clearly defined signature for the mass and time dependence of the mean rotational period at the stellar surface. A comprehensive and definite knowledge of these quantities - angular momentum and energy - is still beyond reach, since little is known on the radial dependence of the angular velocity as a function of stellar mass and age. Assumptions have to be made, and these are greatly influenced by what we know about the Sun, which is well advanced into its rotational history (as evinced in Figure 2).
Helioseisimology has shown that the radiative core of the Sun rotates rigidly at a rate of 431 nHz (period close to 27 days) at least down to ≈0:15 Rʘ (Kozennik & E -Darwich, 2012; E -Darwich & Korzennik, 2013). Taking a radial average, the convective envelope rotates at a similar rate (or slightly higher according to Tomczyk, Schou & Thompson 1995). Since the outer layers are slowed down by magnetic braking, this signifies that angular momentum transport from the radiative core to the convective envelope has been equally efficient for some time.
But not much is known on the internal rotation of other stars, and Lund, Miesch & Christensen-Dalsgard (2014) argued that asteroseismological measurements of Sun-like stars cannot result in clean-cut inferences on the radial pro le of the rotational period. Even so, Nielsen et al. (2017) concluded that the interior and envelope rotation rates cannot differ by more than ≈30% in 5 solar-like stars (insofar as mass and age are concerned), and Collier Cameron et al. (2009) claim that F, G and K main sequence stars rotate as rigid bodies after ≈600 Myr. Fully convective main and pre-main sequence stars are expected to rotate as rigid bodies, and Charbonnel et al. (2013) showed that the rotational frequency of a solar mass ZAMS star peaks at ≈0:25 Rʘ and is approximately constant beyond ≈0:5 Rʘ , if angular momentum is redistributed by internal gravity waves.
Modeling the rate at which angular momentum is lost at the stellar surface, and examining the constraints on internal angular momentum transport which can be inferred from the 0.2 Mʘ mass bin period distributions of several clusters, Denissenkov et al. (2010) concluded that 0.4 ≤ M/Mʘ ≤ 1.2 stars with an initial rotation period of less than ≈2 days, will rotate as rigid bodies during most of their main sequence evolutionary stage. But if the initial period is between 2 and 4 days, the core-envelope coupling timescale will be 50 ± 25 Myr when M = 1.0 ± 0.1 Mʘ , or 175 ± 25 Myr when M = 0.8 ± 0.1 Mʘ . More ex-tended periods lead to longer coupling times. Notice that by the time they reach the zero age rotational main sequence, ≈120 Myr after birth, the rotational period is close to 10 days when M/Mʘ ≈ 0.7 and less than 5 days if M/Mʘ > 1 (see Figure 2). Obviously, the initial rotational periods had to be smaller.
From the preceding paragraphs, it seems that a rigid rotation model may be not too far-o from reality. It may even be an almost precise description of stars that are older than a few hundred Myr, but not too close to the end of their main sequence life-time. Needless to say, rigid body rotation is also the simplest way to carry out an inspection of an-gular momentum evolution. The rest of this paper will discuss this subject, under the hypothesis that late-type main sequence stars rotate as rigid bodies. Arguing that there seems to be moderate differential rotation between core and envelope in stars older than 100 Myr, Johnstone et al. (2015a) introduced the rigid body assumption into the magnetic braking torque formula derived by Watt et al. (2012), to estimate the evolution of rotation and winds. In this work, the solid body assumption is used to determine the mass and time dependence of the angular momentum and, thereon, develop very simple equations for the evolution of the Rossby number (a surrogate for magnetic activity), the torque, and the mass loss rate.
The product J = I Ω= 2π I/P - where J is the angular momentum if the star is indeed rotating as a rigid body, I is the moment of inertia of the whole star as given by the YaPSI model,Ω is the observed angular frequency and P is the rotational period - is plotted as a function of stellar mass in Figure 3. For the same reason as in Figure 2, only open cluster stars with errors less than 10% in their observational parameters are shown in this figure. Take notice on the following:
The apparent or rigid body angular momentum of the vast majority of Kepler field stars lies in an area contained within well defined upper and lower limits, as long as M/Mʘ ≤ 1:2.
-
There is a wide range of rigid body angular momenta among the least massive Pleiades and Praesepe stars, with no indication of a bimodal distribution. Rather than this, this dispersal conveys the impression that it is partly due to random initial conditions and times of birth. On the other hand, the possibility of a separate population of rapidly spinning low mass stars (M/Mʘ ≤ 0.7) is favored by the substantial number of fast rotators in the Praesepe cluster, where the imprint of initial conditions is anticipated to be nearly gone. In any case, this dispersal is a major obstacle to an unambiguous age determination of stars less massive than ≈0:7 Mʘ and younger than ≈750 Myr.

Fig. 3 Rigid body angular momentum (J47, 1047 gr cm 2 s 1) as a function of mass (solar units) in Kepler eld (black), Pleiades (red, 120 Myr), M 35 (magenta, 155 Myr), Praesepe (green, 750 Myr), NGC 6811 (yellow, 1000 Myr), NGC 752 (yellow, 1350 Myr) and M 67 (cyan, 3500 Myr) stars. Only stars with errors of less than 10% in their observational parameters are shown in this figure. Stars and triangles are for Cen A and B (yellow) and 16 Cygnus A and B (red). Yellow lines in the lower panel are rough approximations to a zero age rotational main sequence isochrone as defined by the Pleiades cluster (Equation 2), the 750 Myr Praesepe isochrone (Equation 3) and the terminal main sequence rotational isochrone. (Equations 4 and 5). The color figure can be viewed online.
The angular momentum tends to pile up in a decreasing range of values in the low mass range. This implies that age estimates based on rotational periods or angular momenta should be increasingly unreliable when the stellar mass is less than ≈ 0:6 Mʘ. In addition, Epstein & Pinsonneault (2014) observed that the inherent uncertainty of the initial conditions remains large for old stars below 0.6 Mʘ .
-
For any given mass, the upper boundary (large angular momentum) of Kepler eld stars coin-cides with the position de ned by the Pleiades stars with the smallest angular momentum. Once again, it sets a well de ned zero age rotational main sequence at 120 Myr. It is depicted by the upper yellow line shown in the lower panel of Figure 3, and can be roughly traced with the following equation if 0:5 M=M 1:2,
Notice that there is a factor of 100 between the angular momentum of low and high mass stars, once they reach the zero age rotational main sequence.
Quite evidently, notwithstanding the possibility of a rapidly spinning population, lower mass stars lose a larger fraction of their angular momentum before settling on the zero age rotational main sequence and take a longer time to do so.
-
An angular momentum sequence for slowly rotating stars from the Praesepe open cluster is also evident. It corresponds to the middle yellow line, and in the same mass range it is approximately given by,
-
In contrast with the period distribution, a lower boundary for the angular momentum is very well defined by Kepler field stars. The terminal (as of today) main sequence rotational isochrone (bottom yellow line in the lower panel of Figure 3) is charted by the following equations,
-
If 0.09 ≤ M/Mʘ ≤ 1.2,and
If 0.5 ≤ M/Mʘ ≤ 0.09
The fact that less massive stars have not yet completed their main sequence rotational his-tory is the likely reason why the slope changes at M/Mʘ
As mentioned above, McQuillan, Mazeh & Aigrain (2014) use gyrochronology models (Barnes, 2007; Mamajek & Hillenbrand, 2008; Meibom et al. 2009) to set an age of 4500 Myr for stars occupying the lower boundary of the angular momentum (upper boundary for the period), but they conclude that these models under-predict stellar ages. A simpler and more intuitive estimate, is to set the timeline for this boundary considering that it must be de ned by stars having nearly the same age as their main sequence lifetime
For stellar masses between ≈0:9 and 1.2 Mʘ , the rigid body angular momentum of quite a few stars is less than the terminal value. If this is real, these stars may be leaving the main sequence. If so, they are expanding rapidly, their rotational shear and moment of inertia are escalating equally fast and, apparently, the most prominent star spots are spinning down by an even larger amount. Less massive stars are not doing so, since they are far from completing their main sequence lifetime.
Empirical relations between rigid body angular momentum and age for a specific mass can be found using either one or a combination of the Pleiades, Praesepe and terminal main sequence isochrones.
The simplest and more often used relation is an inverse square root law (a Skumanich-like relation). Choosing the Praesepe isochrone as the anchor line,
with Jpre as given in Equation 3 and t in Myr. Notice that this solution assumes a time invariant shape for the angular momentum distribution as a function of mass, in this case de fined by the Praesepe open cluster stars. Comparing Equations 2 and 3, we can see that this assumption is not verified in the Pleiades star cluster, and we can expect poor results when Equation 6 is applied to stars that are somewhat younger than the Praesepe cluster. On the contrary, the similar shape of the Praesepe and terminal (for M/Mʘ ≥ 0.9) angular momentum distributions, implies that satisfactory results can be anticipated when Equation 6 is applied to older solar type stars.
Obviously, better adjustments valid for slowly rotating stars older than 120 Myr, can be obtained from three parameter solutions involving the three isochrones, such as the following exponential law,
where t is in Myr, and A; B and C are mass dependent constants. These are given in Table 5 for a few selected masses. The table includes two e-folding times for the angular momentum, Τ0 and Τ120 (in Myr), i.e., the time it takes to reduce it by a factor equal to 1/e after the birth line, t = 0, and after the age of the Pleiades, t =120. The e-folding time after the birth line may be deceptive, since there is no reason why we should expect that the power law approximation can be extrapolated to stellar ages that are less than 120 Myr. The e-folding time after the Pleiades rotational isochrone shows that the torque is increasingly vigorous in more massive stars. An interesting result is that after spending ≈13 to 19% of their main sequence lifetime (≈ 15% after discounting the Pleiades age), all 0.5 to 1.2 M main sequence stars loose ≈85% of the angular momentum they had when they were 120 Myr old.
Table 5 Exponential fits*
| M/Mʘ | A | B | C | T0 | T120 |
| 0.50 | 1.62e+48 | 0.105 | 0.293603 | 2157 | 7261 |
| 0.60 | 3.19e+48 | 0.200 | 0.247530 | 666 | 5091 |
| 0.70 | 6.97e+48 | 0.365 | 0.206752 | 131 | 3583 |
| 0.80 | 1.50e+49 | 0.540 | 0.183679 | 29 | 2675 |
| 0.90 | 3.67e+49 | 0.812 | 0.159828 | 3.7 | 2042 |
| 1.00 | 7.56e+49 | 0.949 | 0.157111 | 1.4 | 1563 |
| 1.10 | 1.33e+50 | 0.976 | 0.162967 | 1.2 | 1274 |
| 1.20 | 2.08e+50 | 0.919 | 0.175548 | 1.6 | 1075 |
*Constants in exponential fits to the angular momentum, as given in Equation 7. The e-folding times, T0 and T120 (both in Myr), are such that ECUACION and ECUACION
Since a simpler exponential relation, J = A exp(Bt), can be summoned for fast rotators with a saturated magnetic field (Chaboyer et al. 1995) and a fixed moment of inertia (Dennisenkov 2010; Amard et al. 2016), it is worth noticing that such a relation is completely at odds with the data when it is calibrated with the Pleiades and Praesepe isochrones. Thus, the stars defining these isochrones are not in the saturated regime and, obviously, are not fast rotators.
The mean and minimum stellar angular momenta found in the open clusters listed in Table 1 are displayed in Figures 4 and 5. By reason of insufficient data, stars less massive than 0.65 Mʘ are not considered. Since there is a limited amount of information for clusters older than ≈1000 Myr, main sequence stars with ages derived from asteroseismological data modeling are included. Listed in Table 6, some of these stars are binaries or host planetary systems (as the Sun, which is also included). The inverse square root and exponential relations between angular momentum and age have been added to these figures (continuous line, equation 6; dotted line, equation 7).

Fig. 4 Rigid body angular momentum (J47, 1047 gr cm2 s 1) as a function of time for stellar masses between 0.6 and 1.2 M in 0.1 M intervals. Mean and minimum angular momentum values for the open cluster stars listed in Table 1 are shown in black and red. Single stars from a cluster or from the group of stars listed in Table 6 are shown in blue. The Sun is represented with a red circle and the green triangles in the right hand side figures stand for the angular momentum of the terminal rotational main sequence. The continuous and dotted lines are the inverse square root (green) and exponential fits (magenta) to the angular momentum of the lower and upper mass limits written at the top right hand side of these figures. The color figure can be viewed online.
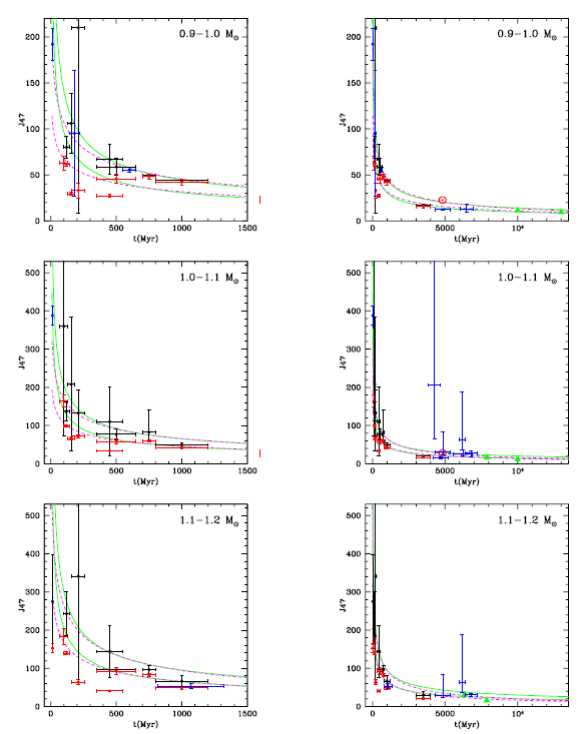
Table 6 Stars with asteroseismological data*
| Name | Mass | Age | Period | I53 |
| αCen A | 1.10±0.01 | 4850±500 | 22.50±5.90 | 9.29±0.20 |
| αCen B | 0.91±0.01 | 4850±500 | 36.20± | 6.25±0.02 |
| 16 Cyg A | 1.11±0.02 | 6800±400 | 9.98±0.72 | |
| 16 Cyb B | 1.07±0.02 | 6800±400 | 8.68±0.44 | |
| KIC 4914923 | 1.10±0.01 | 6180±180 | 20-49±0.00 | |
| KIC 6521045p | 1.04±0.02 | 6240±640 | 23.34±2.78 | |
| KIC 7871531 | 1.84±0.02 | 9150±470 | 33.72±2.60 | |
| KIC 8006161 | 0.04±0.02 | 4690±530 | 29.79±3.09 | |
| KIC 9955598p | 0.93±0.04 | 6479±450 | 34.75±6.31 | |
| KIC 10644253 | 1.13±0.05 | 1070±250 | 10.91±0.87 | |
| KIC 10963065p | 1.07±0.03 | 4260±400 | 12.38±1.22 |
*Mass given in solar units, age in million years, period in days, I53 moment of inertia in 1053 gr cm2 and J47 angular momentum in 1047 gr cm2 s 1. Periods for Cen A and B are from Bazot et al. (2007) and Dewarf, Datin & Guinan (2010), and their mass and age are from Thevenin et al. (2002). Data for 16 Cygnus A and B, Davis et al. (2015). For the rest, the data is from Mathur et al. (2012), Metcalfe et al. (2014) and Ceillier et al. (2016). Superscript \p" is for stars with planets. Moment of inertia from YaPSI models, assuming [F e=H] = 0.0 and Y0 = 0.28.
These figures show that most of the angular momentum of all late type main sequence slow rotators, is lost during their first ≈500 Myr. This implies that the torque is exceptionally strong during this period. Thereon, the torque must be much more moderate, since angular momentum is lost in a very sedate fashion. As expected, the inverse square root relation de-fined by the Praesepe isochrone is inconsistent with the mean and minimum values of the angular momentum in clusters that are younger than 450 Myr. For these clusters, the exponential t is more often than not compatible with the minimum value of the angular momentum. When M/Mʘ ≥ 0:9 and the cluster age is larger than ≈450 Myr, both relations are consistent with the mean value of the angular momentum, and their difference is usually smaller than the observational uncertainties. This statement is also valid when stars are older than 750 Myr, and their mass is somewhat larger than 0.8 Mʘ . With a couple of exceptions, these observations can be applied to stars with asteroseismological data.
According to equations 6 and 7, the rigid body angular momentum of a 4500 Myr solar mass star should be 2.1 and 2.2 1048 gr cm2 s1, only 10% larger than the rigid body angular momentum of the Sun, 1.9 1048 gr cm2 s1. Since scaling is implicitly included, the similarity with the power law t is not surprising. On the other hand, the semblance with the inverse square root relation is suggestive, since no scaling is built into it. These equations can also be used to produce an age estimate using the rigid body angular momentum; in the solar case the result is 5500 and 5600 Myr.
Thus, the rigid body angular momentum (as well as the rotational period) gives an indication of the evolutionary stage of any main sequence star, but the observational database shows that it can not be used to determine with any degree of precision the age of F and G main sequence stars younger than ≈450 Myr or K type stars younger than ≈750 Myr. This limit is likely to be substantially higher for later spectral types. On the other hand, the exponential relation supported by the Pleiades, Praesepe and terminal isochrones for the rigid body angular momentum, or the simple inverse square root relation based on the Praesepe isochrone, may provide acceptable but not too precise estimates for the ages of older stars.
3.3. Rotational Period as a Function of Mass and Time. Second Round
The rigid body angular momentum depends on the detected rotational period and the unobserved moment of inertia (J = 2πI/P ). Since the moment of inertia is mass, metallicity and time dependent, the relation between rotational period and age should be more complicated.
The metallicity dependence of the moment of inertia is weak, but not insignificant. For other-wise identical conditions, higher metallicities pro-duce larger moments of inertia, with an up to ≈10% difference between the highest ([F e=H] = 0.3, Y0 = 0:31) and lowest ([F e=H] = -0.5, Y0 = 0:25) values considered by YaPSI, the gap being smaller for lower mass stars.
As mentioned before, the time dependence of the moment of inertia can be substantially more important. The evolution of the moment of inertia of 0.5 - 1.2 Mʘ stars with a solar composition was depicted in Figure It shows that it declines very rapidly at the beginning of the main sequence. After 100 Myr or so it settles at a relatively stable value that lasts until roughly half the main sequence lifetime. Dur-ing this stage, the moment of inertia of ≈0:4 to 1.2 Mʘ stars is approximately equal to its 1000 Myr old value. YaPSI models for 1000 Myr old stars with [F e=H] = 0.0 and Y0 = 0.28, lead to the following t to the moment of inertia for a stellar mass range between 0.5 and 1.2 Mʘ ,
The regression coefficient and the square root of the mean square error are equal to 0.98 and 0.09. The metallicity effect may add an additional uncertainty of ≈5% in the high mass limit, less than this in lower mass stars. For a one solar mass star, the moment of inertia predicted by this Equation is 6:45x1053 gr cm2, somewhat less than the precise value, 6:71 x 1053 gr cm2, and appreciably smaller than the moment of inertia of a 4500 Myr old one solar mass star, 6:95 x 1053 gr cm2.
Equation 8 and the inverse square root relation between angular momentum and age lead to the following direct connection between age and rotational period during the time span where the moment of inertia is approximately constant,
This equation returns a disappointing age of 6600 Myr for the Sun. The exponential t leads to a more intricate relationship, but gives the same age for our star, i.e., ≈1000 Myr more than the age estimate based on the rigid body angular momentum.
In the second half of their main sequence lifetime, stars build an increasingly larger moment of inertia and the mean rotational period will increase even in the absence of rotational braking. Notice that the consequence on surface rotation may be more pronounced, since differential rotation may result as the core contracts and spins up and the envelope expands and slows down. These effects are still insignificant in lighter stars, but gain in importance in 1.2, 1.1, 1.0 and 0.9 Mʘ stars as soon as they are ≈ 1400, 3600, 4500 and 7900 Myr old. For instance, without rotational braking, the solar period will be around 32, 38 and 68 days when our star is 8000, 9000 and 10000 Myr old. The rotational period would be equal to 38, 47 and 90 days if the evolution of angular momentum resembles the inverse square root relation (Equation 6) or 39, 49 and 95 days if it is described by the exponential law (Equation 7). Since the longest rotational period of the one solar mass stars included in this paper is 63 days, these numbers suggest that other drivers of rotational braking (mass loss, magnetic field intensity, wind acceleration) are secondary agents in the evolution of stellar periods during the second half of the main sequence. Actually, there may be some evidence for inefficient magnetic braking in the Sun, where the high latitude wind was found to be super- Alfvenic close to the solar surface (McComas et al. 2000).
3.4. Magnetic Activity as a Function of Mass and Time
Stellar dynamos sustain poloidal-toroidal magnetic fields (the α-Ω mechanism) as long as Coriolis forces dominate inertial forces within the convective region (Durney & Latour 1978). The relation between these forces is quantified with the Rossby number, which can be defined as
where τc is the convective turnover time. A strong argument for the
conjecture that the magnetic field of main sequence stars with a convective
envelope is produced by the α-Ω dynamo mechanism is based on the observation
that the X-ray and chromospheric to bolometric luminosity ratios are
proportional to
Thus, assuming that the α-Ω mechanism is operative, magnetic activity and rotational braking will tend to be suppressed when the Rossby number is large. It has been argued that this explains the existence of anomalously rapid rotation in some old field stars (van Saders et al. 2016), and it may be the reason why KIC 4914923, KIC 5184732 and KIC 10963065 have such an atypically large angular momentum (see Table 6).
The value of the convective turnover time depends on the convection parameter (usually taken as equal to the solar value, α = 1.875) and the assumed depth of the region where the dynamo is being generated. Under the same circumstances, lengthier convection times and smaller Rossby numbers are obviously associated to dynamos running closer to the tachocline but, except for the scale difference, the mass and time dependence of the convective turnover time does not seem to be affected by this supposition (Landin, Mendes & Vaz 2010).
According to YaPSI models with solar-like composition ([Fe/H] = 0.0 and Y0 = 0.28), the convective turnover time of all late type main sequence stars is equal to a few hundred days during the first 10 to 100 Myr. Later on, it remains roughly constant, almost up to the end of main sequence. Consequently, as stars spin down during their main sequence evolution, the Rossby number will increase, the α - Ω mechanism will weaken and magnetic braking will become increasingly inefficient. Since the convective turnover time during this stage is ≥ 100 days when M ≤ 0:6 Mʘ, and ≈70, 55, 40, 30, 15 and 5 days when M = 0.7, 0.8, 0.9, 1.0, 1.1 and 1.2 Mʘ, the demise of the dynamo effect may begin significantly earlier in stars with shallow convective regions.
The history of the Rossby number for 0.5 to 1.2 Mʘ stars was determined using the exponential and inverse square root approximations for the evolution of the angular momentum (similar results are obtained). In these calculations the Rossby number of a 4500 Myr old one solar mass star is equal to 0.87. This is significantly less than an often quoted value (2.16 in van Saders et al. 2016) but, as discussed above, part of this difference is probably related to the assumed depth of the dynamo producing region. Thus, depending on the precise definition of the convective turnover time, either one of these numbers (both close to one) can be taken as the Rossby number where magnetic activity and rotational braking may begin to decline.
The evolution of the Rossby number is shown in Figure 6. Notice that Ro ≥ 1 for 1.2, 1.1, 1.0 and 0.9 Mʘ stars once they are older than ≈500, 2500, 5500, and 9500 Myr. In 1.2 and 1.1 Mʘ stars, the cessation of the dynamo mechanism may occur be-fore there is a significant change in their moment of inertia. With the un-anticipated exception of 1.2 M stars, the possible disruption of the magnetic dynamo occurs much later than the T120 e-folding times for the angular momentum.

Fig. 6 Evolution of the Rossby number during the main sequence stage, assuming that the angular momentum is as given in equation 6. Dotted lines stand for M/Mʘ = 0:5 (green), 0.6 (black), 0.7 (red) and 0.8 (blue). Continuous lines stand for M/Mʘ = 0:9 (green), 1.0 (black), 1.1 (red) and 1.2 (blue). The color figure can be viewed online.
Kitchainov & Nepomnyashchikh (2017) had noticed that the interruption of large scale dynamos may be the reason why gyrochronology fails to predict the age of older stars. If this is correct, their surviving magnetic fossil field may be the main rotational braking source during the time interval be-tween the fading α-Ω mechanism and the swelling moment of inertia. Later on, the transformation of the moment of inertia will eventually determine the evolution of the rotational period. In less massive stars, dynamo activity will decline at the same time as the moment of inertia escalates, and their continuously changing relative importance will impress the history of the rotational period during the second half of the main sequence stage.
3.5. Torque as a Function of Mass and Time
Differences in angular momentum between pairs of isochrones with respect to the youngest of the two, are displayed on the left hand side of Figure 7 (associated formulas are shown in this figure). The corresponding mean loss rates per Gyr are shown on the right hand side.

Fig. 7 On the left, differences in the angular momentum between the Pleiades, Praesepe and terminal isochrones, relative to the angular momentum of the younger one (Δ = Δ). On the right, logarithm of the mean relative angular momentum loss rate per Gyr, log(Δ J//J Δ t), for the time interval between the Pleiades and terminal isochrone (continuous line), the Praesepe and terminal isochrones (dotted line) and the Praesepe and Pleiades isochrones (short-dashed line).
Close to 60% and 25% of the initial rigid body angular momentum of 1.2 and 0.5 Mʘ slowly rotating stars is lost during the few hundred million years separating the Pleiades and Praesepe isochrones. At this stage, the mean loss rate is around 90% and a bit more than 40% per Gyr for 1.2 and 0.5 M stars. Loss rates are much smaller after ≈750 Myr. Near the end of their main sequence lifetime, 88% and 86% of the initial angular momentum of 1.2 and 0.9 Mʘ stars has been lost. At this point in time, the oldest 0.7 and 0.5 M stars have lost 80% and 73% of the angular momentum they had when landing on the Pleiades isochrone. From these two figures, it is once again clear that the relative and absolute rigid body angular momentum loss rates are always appreciably larger in shorter-lived, more massive, stars.
The inverse square root and exponential ts to angular momentum evolution (Equations 6 and 7), lead to the following expressions for the angular momentum loss rates (i.e., the torque τ = dJ/dt) acting on slowly rotating late type main sequence stars older than approximately 120 Myr,
with t in Myr, and constants A, B and C as given in Table 5. Notice that in both cases the torque can be re-written in the following way
with K = 1=2 and γ = -1 in the inverse square root relation, and K = BC and γ = C-1 in the exponential approximation.
These torques are usually smaller than those where the radiative core is spinning faster than the envelope, since there is less angular momentum when the entire star rotates at the surface rate. This can be visualized in Figure 8. Beyond 100 Myr, both of them are up to a factor of 5 smaller than the torques produced by a couple of models for the slowly rotating branch of one solar mass stars, where solid body rotation is not assumed and angular momentum is transferred from the radiative core to the convective envelope in two different ways (Amard et al. 2016).

Fig. 8 Absolute value of the specific torque per year, τs, as a function of time (Myr), for a stellar mass equal to 1.0 Mʘ . The continuous (sqrt) and dotted (exp) lines are the inverse square root and exponential ts as given by equations 11 and 12. The blue (GB13) and red (9s) tracks are from Amard et al. (2016). The color gure can be viewed online.
The temporal evolution of the absolute value of the torque under the inverse square root and exponential approximations is plotted in Figure 9. As can be seen, there is a conspicuous difference between the inverse square root and exponential approximations when stars are younger than a few hundred million years. This disparity extends for a longer time and is more pronounced in low mass stars. Since an in-verse square root law is at odds with the observed evolution of angular momentum in young stars, particularly young low mass stars (see § 3.2), it follows that equation 11 cannot be a close description of the torques applied to these objects. On the other hand, the exponential t is a reasonably close approximation to the angular momentum evolution of young stars, so it should lead to a more accurate depiction of the real torque for slowly rotating stars that are at least as old as the Pleiades cluster, as long as radial differential rotation is nearly absent. Notice that the magnitude of the torque at any given age is much smaller when the exponential t is used, and that the demands imposed by a smaller torque are more easily met.

Fig. 9 Absolute value of the torque in units of 1046 and 1044 gr cm2 s 1 Myr 1 ( 46 and 44) as a function of time, for stellar masses equal to 0.8, 1.0 and 1.2 M . The upper age limit on the left hand side figures is 750 Myr, and the lower age limit on the right hand side figures is 500 Myr. The continuous and dotted lines are torques produced by the inverse square root and exponential fits to the evolution of the angular momentum (equations 11 and 12).
Figure 9 also confirms that the torque is very powerful and variable at least during the first ≈500 Myr. After dropping by a couple of orders of magnitude, it is increasingly weaker and stable. Thus, it seems that at least one of the agents driving angular momentum losses, be it the magnetic field strength and/or the mass loss rate, is extremely robust and mutable during the early stages of main sequence evolution. Later on, when the torque is less effective and variable, at least one of these agents must be considerably more stable and moderate. No-tice that after ≈500 Myr, the torques inferred from inverse square root and exponential relations for the angular momentum are almost indistinguishable.
3.6. A Simple Model for the Torque and Mass Loss Rate as a Function of Time
These empirical approximations and an idealized model of the torque, can be used to explore the mass loss rate as stars evolve during the main sequence. At any given point and time, the torque is given by
Where M is the mass loss rate, Ω is the rotational frequency and the lever arm Rc - known as the co-rotation or Alfven radius - is the distance between the stellar surface and the point where angular momentum is being lost. The co-rotation radius is determined from the proposition that angular momentum is lost when the stellar wind is detached from the magnetic field. This happens when fluid pressure equals magnetic pressure,
where Bc is the magnetic flux density at Rc. Since the mass loss rate and the magnetic field strength are latitude, longitude and time dependent, and the angular velocity is latitude and time dependent, it follows that the co-rotation radius cannot be uniform and stable. Thus, a continuously changing crumpled ball of paper - definitely not a smooth and steady regular figure - is a plausible visual representation of the co-rotation surface.
The detailed configuration of the magnetic field above the stellar surface has long been recognized as a very di cult problem (Mestel 1968), since it is an extremely complex mixture of small, medium and large scale dynamic structures rising through-out the convective envelope (e.g., Lang et al. 2014).
But it is worth remembering that the dipole is the constituent with the slowest radial decay and there-fore presides over the strength of the magnetic field at the co-rotation radius, as was shown by Finley & Matt (2018) after analyzing the combined effect that dipolar, quadrupolar and octupolar geometries had on the magnetic braking mechanism.
In the present day Sun, magnetic fields are produced close to the tachocline, the thin layer between the radiative core and the convective envelope (Charbonneau 2010). But different processes are involved in other stars. In fully convective stars, magnetic fields cannot be generated by the classical process, and it is possible that small scale magnetic fields are produced at various depths by turbulent velocity fields (Durney, De Young & Rox-burgh 1993). Additionally, strong toroidal azimuthal fields can show up directly at the stellar surface of stars with a mass between 0.1 and 1.5 Mʘ , and it has been suggested that these are produced by dynamos distributed throughout the convection zone (Donati et al. 1992; Donati & Collier Cameron 1997; See et al. 2015), an idea supported by Brown et al. (2010). Thus, different magnetic energy sources can be located relatively close to the stellar surface but not beyond the tachocline (if there is one).
An extreme, manageable and sensible simplication is to assume that the magnetic field is produced by a collection of dipoles placed at various distances h under the stellar surface. If h is much larger than the physical size of each dipole,
where Bs is the dipole’s magnetic field density emerging at the stellar surface. Magnetic braking is effective if the co-rotation radius is at least a few stellar radii from the surface, so that it is quite likely that h=Rc < 0:01. If this is so, and the stellar surface is covered by any number of magnetic active regions produced by identical dipolar fields, the total torque is
where the filling factor, fs, is the area covered by the regions that contribute to rotational braking, over the stellar surface area. Notice that the sur-face field, the mass loss rate and the angular velocity (Bs; M and Ω) are averages of these quantities over a time period where all longitudinal and latitudinal fluctuations have been smoothed out, i.e., the twisted short-time dependent co-rotation surface has been idealized as a smooth long-time dependent spherical figure. This implies that the long-time period must comprise several stellar cycles and, even so, it is almost certain that the distance between the stellar and co-rotation surfaces depends on latitude. Consequently, these averages cannot be expected to be equal or similar to values obtained from observations, since these are completed in shorter time spans.
Mean values of the total field strength can be obtained by measuring Zeeman splitting of unpo-larized spectral lines, a procedure known as the ZB technique. This method provides no information on the magnetic field geometry, but it includes the contribution of magnetic field structures of all magnitudes and sizes. Notice that some of these structures may not participate in the magnetic braking process. With a data base of close to a couple of dozen late type main sequence stars, Saar (1996, 2001) found that, except for the most active, their magnetic field density was close to the photospheric equipartition value (same magnetic and thermal pressures), fsBs is between ≈20 and 4000 G and fsBs is nearly pro-portional to Ω5=3 if the rotational period is more than 3 days (the reported exponent is 1.7). The data show that there is an almost linear relation between the X-ray flux and fsBs, but there is no mention of possible correlations between magnetic field and age or spectral type.
The ZDI technique has been applied to Stokes V profiles, but in this case the
magnetic field flux density,
Taking these relations between magnetic field and angular velocity into account,
with
where A(M) is a mass dependent function.
Two solutions for the ratio of the mass loss rate at any time, with respect to the mass loss rate at t = 100 Myr, Ṁ(100), are displayed in Figure 10. These figures are for β = 5/3 (very similar figures are obtained when β = 4/3). Being a much better approximation to the evolution of angular momentum during the entire main sequence, the exponential t (equation 7, γ = C 1 and C as given in Table 5) was used to compute the mass loss rate. The moment of inertia is taken from YaPSI models with [F e/H] = 0:0 and Y0 = 0:28. On the left hand side, the average depth of the magnetic field source (h) is assumed to be constant in time, and is therefore included in the empirical mass dependent function A(M). On the right hand side, h does change in time but not the ratio h=ht, where ht is depth of the convective envelope. In this case, h=ht is included in A(M) and the depth of the convective envelope is an additional mass and time dependent parameter. As the moment of inertia, ht is taken from YaPSi models with [F e/H] = 0.0 and Y0 = 0.28.

Fig. 10 Ratio of the mass loss rate at time t, Ṁ_(t), with respect to the mass loss rate at t = 100 Myr, Ṁ(100). Dotted lines are for M/Mʘ = 0.5 (green), 0.6 (black), 0.7 (red) and 0.8 (blue). Continuous lines are for M/Mʘ = 0:9 (green), 1.0 (black), 1.1 (red) and 1.2 (blue). As indicated, the black dashed line shows the 1=t function, which is a good approximation to the mass loss rate when the moment of inertia is constant and the evolution of the angular momentum is described by an inverse square root law. The color figure can be viewed online.
If this simple model for the torque is basically correct and the magnetic field behaves as has been discussed, these figures call upon these outcomes:
After ≈100 Myr, the mass loss rate functions of all 0.5 - 1.2 Mʘ slowly rotating main sequence stars converge to a time dependence that is approximately proportional to t 1. After ≈750 Myr, the inverse square root approximation for the angular momentum can be used to describe the torque and it is easy to see that M_ is proportional to t8/9 if β = 5/3, and to t10-9 if = 4/3. This time dependence lasts up to the first half of the main sequence lifetime of these stars, i.e., as long as there are no major alterations in the moment of inertia and the depth of the magnetic field source. Other authors obtained very similar time dependencies for the mass loss rate of inactive 1 Mʘ stars: t 1:1 for ages between 200 and 7000 Myr (Cranmer & Saar 2011), t 1:23 (Suzuki et al. 2013) and t 0:75 (Johnstone et al. 2015a) for stars older than 700 Myr.
If the mean physical depth of magnetic field sources is constant in time, mass loss rates of all spectral types increase during the first 100 Myr and decrease very rapidly as the star approaches the end of main sequence. Obviously, this is mainly driven by changes in the moment of inertia. Intuitively, this does not make sense. The mass loss rate is expected to decrease as the star enters the main sequence since, among other things, the surface area will shrink and the escape velocity will increase as the star contracts. On the contrary, towards the end of main sequence the mass loss rate should tend to increase since the area will be larger and the escape velocity smaller as the star expands. Thus, a constant physical depth for the magnetic sources leads to an unlikely scenario.
If the physical depth of magnetic field sources relative to the physical depth of the convective envelope, h/ht, is constant in time, mass loss rates of all spectral types decrease during the first 100 Myr and increase during the second half of their main sequence. This is mainly driven by changes in the moment of inertia and depth of the convective envelope. Since this is a more likely scenario, it follows that this is a better case for this magnetic torque model, as long as the empirical formula for the torque holds its ground for stars younger than the Pleiades cluster.
In either one of these scenarios (h or h/ht constant in time) the mass dependent function, A(M), can be calibrated using a star with known mass, age and mass loss rate. At present, these quantities are known with any certainty for only one star, the Sun. Assuming that it did not have a unique rotational history, the magnetic torque model where h/ht is constant implies that the present solar mass loss rate is very close to its lowest value (2 - 3 x 10 14 Mʘ yr-1, Wang 1998) and, if magnetic braking is still dominant, leads to a mass loss rate that may be 5 - 8 10 14 Mʘ yr-1 when our star is 9000 Myr old. Under this scenario, the mass loss rate may have been 2 to 3 10 13 Mʘ yr 1 when the Sun was around 100 Myr old, if its rotational period was similar to the rotational period of solar type stars in the Pleiades cluster (as discussed in § 3.1, this is not unlikely).
Mass loss rates of a handful of late type main and post-main sequence stars have been calculated from astrospheric absorption in the stellar Lyman-α emission line (Wood et al. 2005; Linsky & Wood 2014), the only available technique to measure this quantity. There is a good looking correlation between mass loss rate and X-ray flux, as long as the latter is smaller than ≈106 erg cm-2 s-1. Combining this correlation with an X-ray flux vs. age re-lationship (Ayres 1997), Wood et al. (2005) affirm that Ṁ α t-2:33 ±0:55 in stars where the X-ray flux is smaller than the aforementioned limit. Except for stars younger than ≈100 Myr, this relationship is at odds with all the estimates that have just been mentioned.
Different explanations can be tried to account for these discrepancies. But the problem may be directly associated to the mass loss rate vs: time relationship put forward by Wood et al. (2005), since there is no connection between the mass loss rate and the rotational period of these stars, as can be seen in Figure 11. Under this circumstance, it is unlikely that a relation between mass loss rate and age is hidden in their data set. This result should not be unexpected, since the mass loss rate data set stems from a very diverse group of single and bi-nary stars: giant, sub-giant and G2 to M5.5 dwarf stars. Furthermore, there is no way to know the individual mass loss rates in the binary systems α Cen, 36 Oph, λ And, 70 Oph and ξ Boo, since the size of the modeled astrosphere includes both stars. More measurements of the mass loss rate of late type main sequence stars are required to have a better under-standing of this quantity as a function of mass and age. An important addition to this discussion is the effect that coronal mass ejections may have on the mass loss rate and rotational braking (e.g., Cranmer 2017).

Fig. 11 Rotational periods as a function of mass loss rates. Main sequence stars in black, post-main sequence stars in red. Triangles stand for single star measurements and starred symbols (linked by a line when more than one period has been measured) for measurements including both stars. All mass loss rates are taken from Wood et al. (2005). Rotational periods stem from a variety of sources: Proxima Cen (Collins, Jones & Barnes 2017), α Cen A (Bazot et al. 2007), α Cen B (Dewarf, Datin & Guinan 2010), ϵ Eri (Fröhlich 2007), 61 Cyg A, 36 Oph A and B, 70 Oph A and B, 61 Vir and δ Eri (Baliunas, Sokolo & Soon 1996), λ And (Kukarkin et al. 1971), EV Lac (Contadakis 1995), ξ Boo A and B (Noyes et al. 1984) and DK UMa (Gondoin 2005). The color figure can be viewed online.
4. CONCLUSIONS
A database comprising the rotational period, 2M ASS photometry and Gaia parallax and photometry of thousands of late type main sequence stars was put together. These stars were collected from the CoRoT satellite, the HATNet survey, the Kepler satellite field and 17 open clusters comprising a 13 to 3500 Myr age range. Special care was taken to exclude stars with a precision worse than 20% in their Gaia parallax and photometry and 2M ASS photometry, that are or may be part of a multiple system, and that have light curve modulations produced by other sources of variability besides rotation. Stellar parameters were deduced matching their ab-solute magnitudes with those predicted by different sets of YaPSI stellar isochrones, in order to analyze the behavior of angular momentum and other physical quantities as a function of mass and age.
In a figure displaying rotational periods as a function of mass (Figure 2), the vast majority of Kepler field main sequence low mass stars lie within a region with clearly de ned lower and upper limits (short and long periods). The lower boundary traces the rotational period of stars once they have stabilized in the main sequence. It is also traced by slowly rotating Pleiades stars. The M 35 cluster is supposed to be 35 ≈Myr older than the Pleiades. The location of its slow rotators runs in parallel but with slightly shorter periods, suggesting that M 35 is younger than the Pleiades.
Very few fast rotating 0.5 - 0.8 Mʘ main sequence stars are present in Praesepe (750 Myr), and none are found in NGC 6811 (1000 Myr) and NGC 752 (1350 Myr). Thus, nearly all 0.5 - 0.8 Mʘ stars merge into a single slowly rotating mass dependent sequence after ≈750 Myr. No fast 0.8 - 1.2 Mʘ rotators were found in M 48 (500 Myr), M 37 (450 Myr) and the Pleiades (120 Myr), a few in M 35 (155 Myr, probably less) and some more in M 34 (210 Myr). Thus, most 0.8 - 1.2 Mʘ main sequence stars seem to merge into a single slowly rotating sequence after ≈120 Myr. This implies that rotational convergence in the high mass range happens earlier than previously thought (around 600 Myr).
If stars rotate as rigid bodies - more precisely, if there is no gradient in the radial average of the an-gular velocity - the angular momentum of the vast majority of 0.5 to 1.2 Mʘ stars is confined within clearly outlined upper and lower bounds. The lower boundary is de ned by a couple of equations. One is valid for 0.9 ≤ M/Mʘ ≤ 1.2, and the age of this stars is taken as nearly equal to their main sequence lifetime. The second equation applies to less massive stars, with an assumed age that is close to the Milky Way’s. It can be said that these equations de ne a terminal rotational main sequence isochrone. The upper boundary coincides with the position occupied by the slowest rotators of the Pleiades cluster, thus defining a zero age rotational main sequence at ≈120 Myr. Stars from the Praesepe cluster de-lineate a third rotational isochrone at ≈750 Myr. The difference between these isochrones is increasingly smaller for less massive stars, showing that the angular momentum loss rate during main sequence is less efficient in low mass stars.
Three types of relationships between angular momentum and age were compared with the average and minimum values of angular momenta of stars within open clusters with known age, as well as the angular momentum of the Sun and stars with ages derived form asteroseismological data modeling. A simple exponential relation, calibrated with the Pleiades and Praesepe isochrones, is at odds with the data. A \classical" inverse square root relation implies that the shape of the angular momentum vs: mass distribution is time invariant, but this is not observed. Calibrated with the Praesepe isochrone, this relationship does not hold for stars younger than ≈500 Myr, but is consistent with older stars that are more massive than 0.7 Mʘ . A better t throughout the entire age range is an exponential solution involving the three isochrones and three mass dependent parameters.
During the six hundred million years separating the Pleiades and Praesepe isochrones, the mean an-gular momentum loss rate is around 90 and a bit more than 40% per Gyr for 1.2 and 0.5 Mʘ stars. Afterwards, loss rates are much smaller and near the end of main sequence ≈87% of the initial angular momentum of 0.9 to 1.2 Mʘ stars has been lost. At this point in time, the oldest 0.7 and 0.5 M stars have lost 80% and 73% of the angular momentum they had when they set foot on the Pleiades isochrone.
Age estimates based on the angular momentum are likely to be reasonable for middle aged stars if M ≥ 0:7. These estimates are unreliable at early times, since there is a wide range of periods in con-temporary F and G stars younger than 450 Myr and 750 Myr when 0.6 ≤ M/Mʘ ≤ 0.7. This is also true in aging stars, since rotational periods and angular momenta tend to accumulate in a decreasing range of values, particularly for lower mass stars.
An inverse square root relation between rotational period and age was found to be valid only after ≈500 - 750 Myr and as long as there is no significant change in the moment of inertia, i.e., roughly up to the end of the first half of the main sequence (1400, 3600, 4500 and 7900 Myr if M/Mʘ = 1.2, 1.1, 1.0, and 0.9). The data indicate that during the second half of the main sequence the evolution of the rotational period is increasingly being determined by changes in the moment of inertia, less so by other agents of rotational braking.
The evolution of the Rossby number was computed using the exponential and inverse square root approximations to the evolution of the angular momentum, in combination with YaPSI convective turnover times from isochrones with [F e/H] = 0.0 and Y0 = 0.28. It turns out that it is larger than one for 1.2, 1.1, 1.0 and 0.9 Mʘ stars, once they are older than 500, 2500, 5500 and 9500 Myr. This implies that the Parker dynamo mechanism may cease be-fore there is a significant change in the moment of inertia of 1.2 and 1.1 Mʘ stars. If so, their surviving magnetic fossil field, other kind of dynamos - such as the Babcock-Leighton cycle - or local magnetic fields produced by turbulent plasmas, may be the main rotational braking source during the time interval between the interruption of the Parker dynamo and the onset of the phase where the moment of inertia grows in a significant way. Later on, the transformation of the moment of inertia determines the evolution of the rotational period. In less massive stars, dynamo activity will decrease at the same time as the moment of inertia escalates.
The exponential and inverse square root approximations to the evolution of the angular momentum were also used to obtain an empirical formula for the torque, which is very powerful and variable at least during the first ≈500 Myr. Thus, the magnetic field strength and/or the mass loss rate is extremely robust and mutable during the early stages. Later on, after dropping by a couple of orders of magnitude, the torque and at least one of these agents must be increasingly weaker and stable. When this is so, the torques derived from the exponential and inverse square root approximations are nearly identical.
An idealized model of the torque based on these empirical approximations, on observed relationships between the rotational period and the superficial magnetic field (Saar 1996; Vidotto et al. 2014), and on the assumption that the magnetic field is produced by identical dipoles located at a physical depth that is constant in time with respect to the width of the convective envelope, leads to an uncalibrated mass and time dependent equation for the mass loss rate of late type stars. According to this model, after 100 Myr the mass loss rate functions of all 0.5 - 1.2 Mʘ stars converge to a time dependence that is roughly proportional to t-1. Towards the end of the main sequence, the mass loss rate is swiftly taken back to its initial value. If the rotational period of the Sun was near the Pleiades isochrone when it was ≈100 Myr old, its mass loss rate may have been close to 3 10 13 Mʘ yr-1. If the magnetic torque is still dominant, it will have a mass loss rate between 5 and 8 10 14 Mʘ yr-1 when it hits the 9000 Myr mark. If this model is reasonably close to reality, the mass loss rate was about five times more vigorous when life on Earth started 4280 Myr ago (Dodd et al. 2017).
The author acknowledges an unknown referee for a rigorous and productive revision.

