


 nueva página del texto (beta)
 Inglés (pdf)
 Artículo en XML
 Referencias del artículo
 Enviar artículo por email
 Citado por SciELO
  Similares en
SciELO
Similares en
SciELO 
 Permalink
1.Introduction
The existence of symmetric emitting knots (at similar distances from the outflow source) along some bipolar Herbig-Haro (HH) outflow systems implies highly synchronized jet/counterjet ejections, and therefore a small spatial extent for the jet production region. This was pointed out by Raga et al. (2011a) in their study of Spitzer Infrared Array Camera (IRAC) images of the HH 34 outflow. In a second paper, Raga et al. (2011b) developed a ballistic jet model which constrained the ejection asymmetries using the observed jet/counterjet structures, and applied the model to the HH 34 and HH 111 outflows.
These analyses of jet/counterjet asymmetries have been carried out with IR Spitzer images in the 4 IRAC channels (centered at 3.6, 4.5, 5.8 and 8.0 μm). This is because at optical wavelengths, larger jet/counterjet asymmetries are found in the knots close to the outflow source, often with one of the two lobes being undetected because of a large optical extinction (this is the case, e.g., of the HH 34, HH 111 and HH 1/2 outflows). The intrinsic symmetry of the two lobes is then only visible at infrared (IR) wavelengths, as first shown in a quite dramatic way by the H2 2.1 μm observations of HH 111 of Gredel & Reipurth (1994).
A clear candidate for this kind of study is the HH 212 outflow, which is an impressive “IR jet”, discovered at IR wavelengths by Zinnecker et al. (1998) and with only very faint optical emission (Reipurth et al. 2019). This outflow lies very close to the plane of the sky (Claussen et al. 1998) and is at a distance of approximately 400 pc (Anthony-Twarog 1982, Kounkel et al. 2017). Recent proper motion determinations (Reipurth et al. 2019) show that the jet and the counterjet have a velocity of ≈170km s-1.
H2 2.1 μm observations of HH 212 (Davis et al. 2000, Smith et al. 2007, Correia et al. 2009) show that this outflow has emitting structures with evident jet/counterjet symmetries. We present Spitzer images in the four IRAC channels (I1-I4, at 3.6, 4.5, 5.8 and 8.0 μm) and an archival VLT 2.1 μm image of HH 212, and determine the positions of knots along the jet and the counterjet.
We then use the knots within 40´´ from the outflow source to calculate jet/counterjet knot position offsets. These offsets (as a function of distance from the outflow source) are then interpreted in terms of the ballistic outflow model of Raga et al. (2011b) in order to constrain the jet/counterjet asymmetries of the ejection process. We also study the deviations of the knot positions perpendicular to the outflow axis, and interpret them in terms of the “orbiting outflow source” model of Masciadri & Raga (2002).
The paper is organized as follows. The observations are discussed in § 2. The measurement of knot intensities and positions (as well as the determinations of jet/counterjet knot offsets) are presented in § 3. § 4 presents interpretations of the HH 212 measurements, including an application of the jet/counterjet asymmetry model of Raga et al. (2011b), an application of the “orbiting source jet” model of Masciadri & Raga (2002), an evaluation of the difference in extinction towards the jet and the counterjet, and a discussion of the features of the outflow that do not show a clear jet/counterjet symmetry. The results are summarized in § 5.
2.The Observations
The IRAC data were obtained during the Cryo-Spitzer mission, program PID 3315 (PI Noriega-Crespo) on “Emission from H2, PAHs and Warm Dust in Protostellar Jets”. The data were collected in the four IRAC bands using a 30 sec high dynamic range (HDR) frame time and a 12 point medium scale Reuleaux dither pattern. A small 2×1 mosaic with a 260 arcsec stepsize was used to capture the outflow within the field of view (FoV) of the four IRAC (3.6, 4.5, 5.8 and 8.0 μm) channels. The resulting images have a 0.6´´ pixel size.
We used the final reprocessing from the Spitzer Archive with a standard angular resolution of FWHM≈2 arcsec. Figure 1 shows the entire outflow in the four bands. As expected, the HH 212 jet itself is brighter at 4.5 μm, given that some of the bright pure (0-0) rotational lines fall within the IRAC Channel 2 bandpass, i.e. S(9) 4.6947, S(10) 4.4096 and S(11) 4.1810 μm (Noriega-Crespo et al 2004a, 2004b; Looney et al. 2007; Tobin et al. 2007; Ybarra & Lada 2009; Maret et al. 2009, Raga et al. 2011a; Noriega-Crespo & Raga 2012). The IRAC Channel 2 map could also be brighter because of the CO rovibrational lines that fall in its range. However these lines require high temperatures and densities that do not normally occur in protostellar jets. Nevertheless, the jet is detected in all four bands (Figure 1).
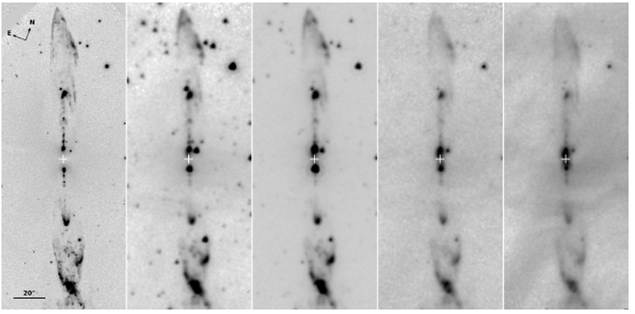
Fig. 1 The HH 212 outow in H2 2.1 μm (left frame) and in the four IRAC channels I1-I4, at 3.6, 4.5, 5.8 and 8.0 μm (four frames towards the right). The orientation and the scale of the images are shown in the left frame. The White cross (in all frames) indicates the position of the outow source.
We also used a VLT H2 2.1 μm image obtained with the High Acuity Wide field K-Band Imager (HAWK-I), as part of its Science Verification program (PI Schneider, “How symmetric is a symmetric flow. A deep H2 image of the Herbig Haro object 212”) observed in Janauary 2018, and enhanced by the ground-layer adaptive optics module (GRAAL) with an image quality of the order 0.2´´. The raw and reduced data are available through the ESO archive. The uncalibrated image has a 0.106´´ pixel size (Leibundgut et al. 2018). This image is shown in the left frames of Figures 1 and 2.
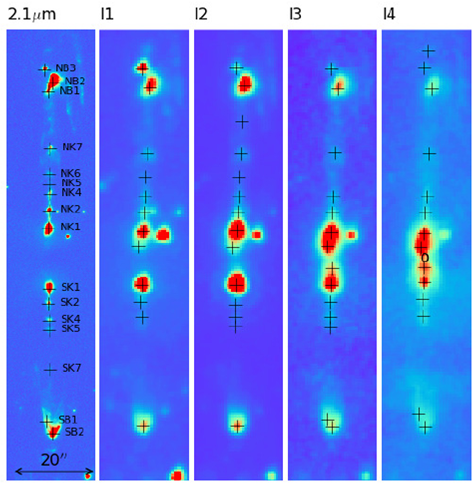
Fig. 2 The central region of the HH 212 outow in in H2 2.1 μm (left frame) and in the four IRAC channels (I1-I4, with 3.6, 4.5, 5.8 and 8.0 μm central wavelengths, respectively). The ordinate points to the NNE (at 22:5o clockwise from N). The circle in the central region of the I4 map is the position of the source. The crosses indicate the positions of knots along the jet/counterjet (see the text). The knot identifications of Lee et al. (2007) are given on the H2 2.1 μm map. The images are displayed with a linear color scale. The color figure can be viewed online.
3.The Knot Positions and Intensities
Figure 2 shows the H2 2.1μm and the I1-I4 IRAC maps (with 3.6, 4.5, 5.8 and 8.0 𝜇m central wavelengths, respectively) of the HH 212 outflow. The images have been rotated 22.5o clockwise, so that the outflow axis is parallel to the ordinate. The position of the outflow source (for which we have used the position given in § 3.1 of Galván-Madrid et al. 2004) is shown with a black circle in the central region of the I4 map. On the H22,1 μm map we show the identifications given by Lee et al. (2007) for the H2 knots.
In order to find the positions of the jet/counterjet knots, we convolved the I1-I4 maps with a “Mexican hat” wavelet with a central peak of radius, which has the effect of isolating well defined emission peaks from the spatially more extended emission. On these convolved maps we searched for peaks along the jet axis with an intensity larger than a cutoff value Ic (for which we have chosen values of 0.03, 0.05, 0.1 and 0.1 mJy/sterad for the I1, I2, I3 and I4 channels, respectively), and carried out paraboloidal fits in 3 x 3 pixel regions (around each of the peaks) to determine the knot positions. This procedure is described in detail by Raga et al. (2017).
The H2 2.1μm jet/counterjet knot positions were found on a convolution of this image with a central peak of σ=5 pixel radius. We selected peaks with at least 10-2 times the peak knot intensity (which was found for one of the SB knots of Lee et al. 2007) in the convolved frame.
The resulting knot positions are shown as black crosses on the H2 2.1μm and I1-I4 maps of Figure 2. It is clear that many of the knots along the NE jet (top half of the frames) have corresponding emitting structures in the SW counterjet (bottom half of the frames).
The knot located ≈26´´ to the N of the source (labeled NK7 by Lee et al. 2007) has no detectable counterpart in the counterjet in the IRAC I1-I4 maps. However, in the H2 2.1μm image we do detect a faint counterpart along the counterjet (labeled SK7).
In Figure 3 we show the peak intensities of the jet and counterjet knots in the I1-I4 IRAC maps (measured on the convolutions with a σ = 2 pixel radius wavelet) as a function of distance 𝑥 from the outflow source. This distance is measured along the ordinate of Figures 1 and 2, but (as the offsets of the knots along the abscissa are very small). Almost identical values are obtained if one takes the radial source/knot distances.
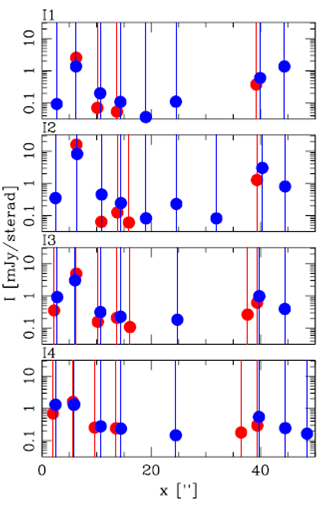
Fig 3 Fluxes measured for the knots along the jet (blue circles with vertical lines) and counterjet (red circles) as a function of distance 𝑥 along the outflow axis in the I1-I4 IRAC channel maps. The fluxes are given in mJy/sterad. The vertical lines are shown so as to highlight the occurrence of jet/counterjet knot pairs with closely matched positions. The color figure can be viewed online.
The jet and counterjet knots at similar distances from the source have intensities that differ by factors of ≈ 2. We see that at similar distances from the source:
in most cases the NE jet knots (in blue) are brighter than the SW counterjet knots (in red),
the ratios between the jet and counterjet knot intensities generally become smaller for the longer wavelength IRAC channels (see Figure 2).
These trends can be interpreted as the result of a different extinction towards the two outflow lobes, as described in § 4.3.
In the top frame of Figure 4 we show the peak H2 2.1μm intensities of the jet and counterjet knots (measured on the convolution with a σ =5 pixel radius wavelet) as a function of distance x from the outflow source. The intensities are given in units of the peak intensity of the SK1 knot (see Figure 2). The jet and counterjet knots at similar distances from the source have intensities that differ by factors of ≈3, except for knots NK7 and SK7 (at ≈26´´ from the source) which have intensities that differ by a factor of ≈10.
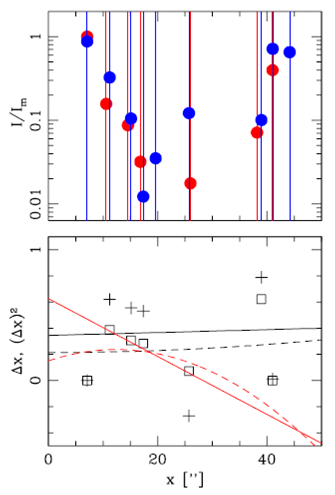
Fig. 4 Top frame: Fluxes measured for the knots along the jet (blue circles
with vertical lines) and counterjet (red circles) as a function of
distance 𝑥 along the outflow axis in the H2 2.1𝜇m map. The
fluxes are given in units of the flux of the SK1 knot. Bottom frame:
jet/counterjet knot offsets
We now use the H2 2.1μm map (which has a higher angular resolution than
the IRAC maps) to define jet/counterjet knot associations with pairs of knots which
have values of
In Figure 5 we show the (x, y) knot positions of
the inner H2 2.1μm knots, with x measured along (positive values for the
N jet) and 𝑦 across the outflow axis (positive values to the E) from the position
of the outflow source. It appears that the knots with
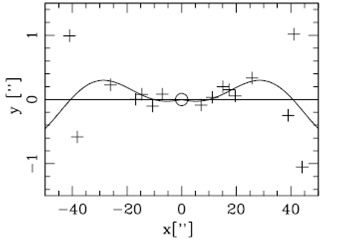
Fig. 5. Positions of the inner HH 212 knots measured on the H2 2.1𝜇m frame. The 𝑥 coordinate lies along (positive 𝑥 to the N), and the 𝑦 coordinate across the outflow axis (positive 𝑦 to the E). The solid curve is a least squares fit to the knots with |𝑥|<30″ of the ballistic “orbiting source jet” of Masciadri & Raga (2002), as described in the text. The positions along and across the outflow axis have errors of ≈0.03´´.
Finally, we used the new H22.1μm image (obtained in January 2018) together with the IRAC I1-I4 maps (obtained in February 2005) to estimate the proper motions of the HH 212 knots within 50´´ from the outflow source. This of course gives only rough estimates of the proper motions, since different knot morphologies in the different spectral bands can in principle lead to position offsets that are not due to proper motions.
We proceeded as follows. For the knots that are present in all the I1-I4 IRAC maps, we first calculate the average positions (along and across the outflow axis), and the standard deviations of these positions. We then use these I1-I4 “first epoch” average knot positions to calculate the knot proper motions together with their corresponding positions in the H22.1μm “second epoch” map. The proper motion velocities calculated from these knot offsets (assuming a distance of 400 pc to HH 212) are given in Table 1.
Table 1 Proper motions of the HH 212 knots
| Knot | x | ||
| ´´ | m s-1 | km s-1 | |
| NK1 | 7.1 | 141 (30) | -3 (12) |
| NK2 | 11.2 | 69 (15) | -1 (12) |
| NK4 | 15.1 | 105 (7) | 1 (10) |
| NK7 | 25.7 | 170 (17) | -28 (7) |
| NB2 | 41.1 | 165 (36) | 10 (12) |
| NB3 | 44.2 | -44 (10) | -29 (17) |
| SK1 | -7.1 | -145 (39) | 13 (21) |
| SK2 | -10.6 | -55 (64) | 48 (22) |
| SK4 | -14.6 | -128 (13) | 14 (10) |
| SB2 | -41.0 | -251 (11) | 32 (12) |
This table gives the knot identifications (shown in the left frame of Figure 2), the positions 𝑥 along the outflow axis (measured in the H22.1 μm map, with positive 𝑥 pointing along the N jet), and the proper motion velocities along (positive values to the N) and across (positive values to the W) the outflow axis with their errors (in parentheses). Even though the errors shown are quite small for most of the knots, it is likely that there are larger systematic errors due to the fact that we compare images with different emission features.
The determined proper motion velocities are well aligned with the directions of the jet and the counterjet axes, except for knot NB3. This knot has a motion directed to the NW, which could indicate that it does not belong to the HH 212 outflow or that it has a substantially different morphology in H22.1 μm than in the other spectral bands.
Most of the knots have axial velocities in the range from ≈ 50 to 170 km s-1, which is roughly consistent with the previously determined proper motions of the HH 212 knots 115 ± 50: km s-1 by Lee et al. (2015) and somewhat higher velocities by Reipurth et al. (2019). If one compares our results (shown in Table 1) with Table 2 of Reipurth et al. (2019), one finds quite good agreements for the motions of most of the knots present in both tables (note that the knot that we have labeled NB3 does not correspond to the knot with the same denomination in Reipurth et al. 2019).
4.Interpretation of the Results
4.1.The Jet/Counterjet Knot Position Asymmetries
We use the jet/counterjet knot offsets to constrain the jet/counterjet asymmetries along the outflow axis shown in Figure 4. We do this using the model of Raga et al. (2011b). In this model, one assumes that:
the knots travel ballistically,
the jet/counterjet knot pairs are ejected with velocities that differ by 𝛥𝑣 (positive values indicating a faster knot along the jet), with this velocity difference following a uniform distribution with a mean value v0 and a half-width
the knot pairs are ejected with a time-difference
The values of
We carry out the linear and quadratic fits to the
These parameters were derived assuming a distance of 400 pc and a flow velocity of (170 ± 30)-1 for HH 212 (see Reipurth et al. 2019).
In other words, the jet/counterjet knot position asymmetries of HH 212 can be explained with:
an ejection velocity asymmetry with a distribution centered at 0 (i.e., the value of v0 determined from the fits is not significantly different from 0, see above) and half-width of ≈ 1.6 km s-1,
an ejection time asymmetry with a distribution centered at ≈4 yr, and a (barely significant) width of ≈7 yr.
These results are qualitatively similar to the ones found for the HH 34 jet/counterjet system by Raga et al. (2011b).
It is fair to say that through this analysis we are basically not detecting a significant asymmetry in the jet/counterjet ejections, and are only estimating upper boundaries (of ≈ 2 km s-1 for the velocity and ≈ 4 yr for the ejection time) for possible asymmetries in the ejections.
The large uncertainty in our estimate of the ejection asymmetries is illustrated
with the following exercise. One could argue that the local intensity maxima of
knots NB1, NB2, SB1 and SB2 actually correspond to local features in larger bow
shocks (see Figure 2), and therefore the
associations NB1-SB1 and NB2-SB2 used to calculate the offsets at x≈40´´ (see
the two frames of Figure 4) are not
necessarily meaningful. Therefore, we repeat the linear and quadratic fits (to
the
The results of these fits are shown with the solid (linear fit to
Given the lack of a clear correlation of the jet/counterjet knot offsets as a
function of distance from the source (evidenced by the fact that the results
change in a quite drastic way by removing the knots at x ≈4´´) it is probably
fairer to just note that the knot offsets have a mean value
4.2.The Mirror Symmetric Precession Pattern
The inner jet/counterjet knot positions of HH 212 show sideways deviations from
the outflow axis with an apparent “mirror symmetric pattern”. In Figure 5, we see that the jet/counterjet
knots within 30´´ from the source show trends of larger values of 𝑦 (i.e.,
towards the E) with increasing distances from the source. At
The simplest explanation of mirror symmetric patterns in jet/counterjet systems is in terms of an orbital motion of the (binary) outflow source. A ballistic, analytic model of this situation was presented by Masciadri & Raga (2002), for the case of a circular orbit and by González & Raga (2004), for elliptical orbits.
Noriega-Crespo et al. (2011) used the “circular orbit model” of Masciadri & Raga (2002) to fit the “mirror symmetric precession pattern” of the HH 111 jet/counterjet system. From this fit, they derived estimates of the orbital parameters and stellar masses of the assumed binary source of the HH 111 system.
We follow these authors, and carry out a least squares fit of the jet/counterjet locci:
where x is the axial coordinate and (y, z) are the axes parallel to the orbital plane (with y being parallel to the plane of the sky). Also, Ψ is the orbital phase, τo the orbital period, and ECUACION the ratio between the orbital and jet velocities. These equations (see Noriega-Crespo et al. 2011) correspond to the small orbital radius limit of the circular orbit model of Masciadri & Raga (2002). We also assume that the outflow is ejected perpendicular to the orbital plane.
We project equations ([yx]-[zx]) onto the plane of the sky assuming an angle of 5o between the outflow axis and this plane (see Reipurth et al. 2019), and carry out a least squares fit to the mirror symmetric pattern of the knots within 30´´ of the HH 212 source. From this fit, we obtain:
With these values for the orbital velocity and the orbital period we can derive the orbital radius:
and a mass
for the primary (jet source) star. In equation ([m1]), G is the gravitational
constant
We should note that Lee et al. (2015) made a fit of a much tighter precession spiral (with a spatial wavelength ≈ 6´´, corresponding to a ≈90 yr period) to the observed CO/SiO emission of HH 212. This small scale structure of curved jet segments can also be seen in the NK1-NK4 region of the H22.1 μm jet shown in the left panel of Figure 2. Analogously, the larger scale structure (with a period of ≈600 yr, see above) we are describing here is also seen in the CO/SiO map (Figure 8 of Lee et al. 2015).
4.3.The Jet/Counterjet Extinction
As discussed in § 3, the jet knots (blue points) in the IRAC channel maps are
generally brighter than the counterjet knots (red points, see Figure 3) at the same distances from the
outflow source, especially for the shorter wavelengths channels (I1 and I2). In
order to quantify this effect, we calculate the Ij/Icj
jet-to-counterjet knot intensity ratios for the three knots at distances
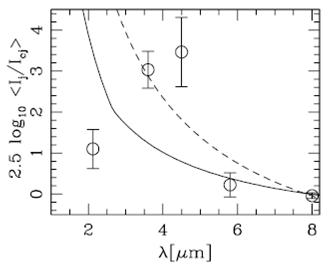
Fig. 6 Mean values of the jet/counterjet intensity ratio (calculated with the three knot pairs at x = 5 → 15´´, see the text) as a function of central wavelength of the IRAC channels and of the VLT H2 map. The intensity ratios are shown as a magnitude, and as a function of the central wavelength. The solid line shows a least squares fit to the observed line ratios of a linearly transformed R= 5extinction curve. The fit to the data gives a higher absorption towards the counterjet of Av = 16.9 ± 2.3. The dashed line shows a fit to the intensity ratios with λ >3μm.
We carried out a weighted least squares fits with a linear transformation of the
a fit to the jet-to-counterjet intensity ratios measured in the IRAC maps (dashed curve in Figure 6). The fit gives a visual extinction to the counterjet larger by
a fit to the jet-to-counterjet intensity ratios measured in the IRAC maps and in the 2.1 μm map (solid curve in Figure 6). The fit gives a visual extinction to the counterjet larger by
These of course are estimates only of the difference between the jet and counterjet extinction, and not a determination of the value of the total extinction to the HH 212 outflow.
The measured Ij/Icj jet-to-counterjet knot intensity ratios shown in Figure 6 have quite large deviations from the extinction curves. This indicates that the jet and counterjet knots at similar distances from the source have relatively large intrinsic intensity differences, not attributable in a direct way to a difference in the extinction.
4.4.Knot NK7
Knot NK7 is located along the NE jet at a distance x ≈ 25´´ from the outflow source (see Figures 2 and 3). Lee et al. (2007) show that this knot has a very faint H2 2.1 𝜇m southern counterpart, but they do not detect it in SiO and CO (at sub-mm wavelengths). We also see the faint SK7 counterpart to NK7 in our H2 image (see Figure 2). This result, together with the fact that we do not see the southern counterpart of NK7 in the IRAC images, indicates that this knot is intrinsically much brighter along the NE jet than the coresponding ejection along the counterjet, and that this strong brightness asymmetry is not an extinction effect (as the extinction should be much less important at longer wavelengths).
Should we therefore conclude that even though the jet/counterjet ejection from the HH 212 source appears to have a remarkable degree of symmetry (see § 4.1), every now and then it produces highly asymmetrical ejections? This is a possible interpretation of the lack of a bright counterpart for the NK7 knot.
Another possible mechanism for producing the observed intensity asymmetry is that knot NK7 corresponds to the merger of two knots (travelling down the jet at slightly different velocities), and that the brightening is associated with the merging process (which produces a knot of boosted shock velocities). If this were the case, we might expect to see a sudden brightening of an “SK7” knot (at x ≈ 25´´ from the source) along the counterjet when the corresponding knot merger occurs in the counterjet.
5. Conclusions
We present Spitzer (IRAC) observations and an H22.1μm image of the HH 212 outflow. In these maps, the general structure of the two outflow lobes is seen (see Figure 1).
For the inner ≈1´ of the outflow, we determine the positions of knots along the NE
jet and SW counterjet (see Figure 2), and find
that they mostly fall into “jet/counterjet knot pairs” (with distances from the
source differing by at most ≈ 1.2´´). We then calculate the jet/counterjet knot
offsets
We interpret the observed jet/counterjet position offsets with the quasi-symmetric
ballistic ejection model of Raga et al.
(2011b). Through this exercise we determine that the knot pairs are ejected
with time-differences
One can in principle use the determined jet/counterjet ejection coordination to
estimate a physical size for the jet production region. In the cool, magnetized
ejection mechanisms appropriate for low mass young stars, the signal transmission
velocity (which could be either the Alfvén or the sound speed) is expected to lie in
the
We use the knot positions measured on the H22.1 μm image together with the IRAC maps (which were obtained ≈13 yr earlier) to determine proper motions of the knots along the jet and the counterjet. We find generally good agreement with the proper motions obtained by Reipurth et al. (2019) with two H22.1 μm epochs covering an ≈8 yr time-interval.
We also analyze the deviations of the knot positions perpendicular to the mean axis
of the outflow. These deviations show a mirror symmetric jet/counterjet pattern,
which can be interpreted in terms of a ballistic outflow from a source in an orbit
around a binary companion. We fit the model of an outflow source in a circular orbit
of Masciadri & Raga (2002) to the
observed deviations (see Figure 5). From the
model fit we deduce an (80 ± 30) AU binary separation and a
The general structure of HH 212 has an important asymmetry in that the NK7 knot (at ≈ 25´´ along the NE jet, see Figures 2 and 3) does not have a comparably bright counterpart along the counterjet. This asymmetry is observed at all wavelengths at which the HH 212 outflow has been observed (see Lee et al. 2007), and therefore cannot be accounted for by differential extinction (see § 4.3 and § 4.4). We suggest that the asymmetric knot NK7 could be interpreted as a true ejection asymmetry, or as a recent brightening of the knot due to the merger of two “outflow events”. If this latter explanation is correct, we might expect a future brightening of a counterjet knot at a comparable distance to the outflow source.
Finally, we use the wavelength dependence of the jet/counterjet intensity ratio (measured in the four IRAC channels) to determine the difference in the extinction to the HH 212 jet and counterjet. We conclude that the extinction towards the counterjet is larger (than the one towards the jet) by A v ≈ 10 magnitudes. This result is similar to the one found by Raga et al. (2019) for the HH 34 outflow. However, we find large deviations between the extinction curve and the jet/counterjet intensity ratios (as a function of wavelength). This indicates that the jet and counterjet knots at similar distance from the outflow source have relatively large intrinsic intensity differences.

