


 nova página do texto(beta)
 Inglês (pdf)
 Artigo em XML
 Referências do artigo
 Enviar este artigo por email
 Citado por SciELO
  Similares em
SciELO
Similares em
SciELO 
 Permalink
1. INTRODUCTION
Hot massive stars exhibit fast stellar winds that sweep up the surrounding interstellar medium (ISM) creating structures known as interstellar bubbles. Weaver et al. (1977) described an analytical model used to predict the X-ray emission of such objects, considering an inner zone of shock-heated gas with temperatures of order 106 K enclosed within a dense spherical shell with temperatures of order 104 K. This analytical model considered an isotropic stellar wind with constant mechanical luminosity interacting with a homogeneous ISM, and predicted a center-filled X-ray sphere surrounded by optical emission.
Wolf-Rayet stars offer an ideal laboratory for the study of such bubbles because they are massive stars (progenitor stellar masses greater than 30 M⊙) with mass loss rates of Ṁ ≈ 10-5 -10-6 M⊙ yr-1 and stellar wind velocities that go from 1000 to 2000 km s−1. However, observations show bubbles with asymmetric structures meaning that the predictions of the analytical models are not valid in general (Chu et al. 1983; Heckathorn et al. 1982; Miller & Chu 1993; Marston et al. 1994a, b). This observed asymmetry can be caused either by inhomogeneities in the ISM (Toalá et al. 2017) or by anisotropic mass loss rates (Chita et al. 2007, 2008). An alternative mechanism considers the stellar motion that provides a pressure asymmetry, producing asymmetric stellar wind bubbles. The stellar proper motion is supersonic for many massive stars and produces bow shocks when interacting with the ISM (van Buren & McCray 1988; Cox et al. 2012; Peri et al. 2012, 2015). Both analytical models (van Buren et al. 1990; Mac Low et al. 1991; van Buren & Mac Low 1992) and numerical models (Brighenti & D’Ercole 1995a,b; Mackey et al. 2015; Meyer et al. 2015) have been presented to describe stellar wind bow shocks.
Additionally, filamentary structures and clumps have been observed in these WR nebulae in optical bands (Chu 1981; Chu et al. 1983; Moore et al. 2000; Gruendl et al. 2000; Stock & Barlow 2010) and X-ray emission (Wrigge et al. 1994, 2005; Chu et al. 2003; Zhekov & Park 2011; Toalá et al. 2012, 2014). These features can be obtained with numerical models that take into account the evolution of the star (mainly the change in mechanical luminosity over time) and its interaction with the circumstellar gas. The evolution history that precedes the WR phase starts from the main-sequence (MS) phase to either the red supergiant (RSG) or luminous blue variable (LBV) phases. Each stage of the stellar evolution is characterized by its own mechanical luminosity and by the formation of a new shell. The interaction b-tween these shells develops instabilities that give rise to the formation of clumps and filamentary structures that have been reproduced by hydrodynamic simulations (Garcia-Segura et al. 1996a,b; Brighenti D’Ercole 1997) and radiation-hydrodynamic simulations (Toalá & Arthur 2011; Dwarkadas & Rosen-berg 2013; Freyer et al. 2006). An important result obtained from these works is the conclusion that the X-ray luminosity is dominated by the emission from the WR shell rather than the shocked WR wind which is the source of the X-ray in the analytical models (Freyer et al. 2006). The numerical models show that soft X-ray emission can be enhanced by thermal conduction, in agreement with the observations (Toalá & Arthur 2011).
In this work we tested, by means of three-dimensional hydrodynamic numerical simulations, the joint effects of the evolutionary phases of a Wolf-Rayet star that moves through the ISM during its lifetime. The hydrodynamic simulations were carried out with the adaptive grid code YGUAZU-A with the aim of reproducing the morphology observed in the X-ray emission. We used the numerical results to obtain synthetic thermal X-ray emission maps. This manuscript is organized in the following way: in § 2 the models of the WR nebulae are presented. In § 3 the initial conditions of the numerical simulations are listed as well as an explanation on how the simulation of the thermal X-ray emission was carried out. The results are given in § 4 and a comparison with observations is given in § 5. Finally in § 6 a summary of the conclusions is presented.
2. MODELLING WR NEBULA
The runaway WR nebula was modelled considering the evolution of the central star from RSG to WR. The first step was to simulate the RSG phase which will produce a bow shock as a result of the motion of the runaway star. This was done in the frame of reference of the runaway star, i.e., the star was kept at the center of the computational domain with the ISM moving at the velocity at which the star travels (−V ⋆). The momentum balance between the stellar wind ram pressure and the ISM, known as stand-off distance (R 0) (see Wilkin 1996), is:
where M W and V W are the stellar mass-loss rate and the wind velocity respectively, V ⋆ is the velocity of the star, n0 is the numerical density of the uniform ISM, µ is the mean atomic mass and m H is the mass of the hydrogen atom. For the RSG stage we chose the values for the mass loss rate and the stellar wind velocity as M W = M RSG and V W = V RSG respectively. The cells where the wind is injected were imposed within a sphere of radius 5 × 1017cm for both the RSG and the WR stages. At a certain integration time, when the shell reaches R0, the RSG stage enters a quasi-stationary state. At this time the second step of the simulation is imposed by replacing the RSG wind with a WR stellar wind.
The parameters for the different winds used in these simulations are summarized in Table 1 and correspond to the values obtained by Garcia-Segura et al. (1996b) for 35M⊙ stars. The RSG wind velocities range from 30 km s−1 to 75 km s− 1, with the velocity of the star assumed to be within typical values of V ⋆ < 100 km s−1. The table also shows the numerical density values of the ISM.
TABLE 1 SIMULATED MODELS
| Models | MSRG M ⊙ yr −1 | VSRG km s −1 | V ⋆ km s−1 | MW R M ⊙ yr −1 | VW R km s −1 | n 0 cm−3 | R 0 pc |
|---|---|---|---|---|---|---|---|
| M1 | 8 × 10⁻⁵ | 75 | 75 | 3 × 10⁻⁵ | 2000 | 0.4 | 2.4 |
| M2 | 3 × 10⁻⁵ | 50 | 75 | 3 × 10⁻⁵ | 1600 | 0.1 | 2.5 |
| M3 | 8 × 10⁻⁵ | 50 | 50 | 3 × 10⁻⁵ | 1600 | 1.0 | 1.9 |
| M4 | 3 × 10⁻⁵ | 30 | 75 | 3 × 10⁻⁵ | 1600 | 1.0 | 0.6 |
The second step in the simulation is carried out until a bubble is formed by the interaction between the WR wind and the shell produced by the RSG stellar wind. We used a constant mechanical luminosity for each stage similar to Garcia-Segura et al. (1996a) and did not include the stellar ionization photon flux. The notation for the models is: model 1 (M1), model 2 (M2), model 3 (M3) and model 4 (M4).
3. THE NUMERICAL MODEL
The 3D numerical simulations where carried out with the Yguazúa hydrodynamical code (Raga et al. 2000, 2002). The code integrates the gas dynamic equations with a second-order accurate implementation of the flux vector splitting method (see van Leer 1982) on a binary adaptive grid, along with a system of rate equation for the atomic/ionic species: [H I], [H II], [He III], [He II], [He III], [C II], [C III], [C IV], [N I], [N II], [N III], [O I], [O II], [O III], [O IV], [S II] and [S III]. A computational domain with a physical size of (16pc×8pc×16pc) along the x−, y−, and z− directions, respectively, with a maximum spatial resolution of 9.7×1016cm, was employed. The xz-plane was chosen as the plane of the sky.
The numerical simulation provided us with density and temperature distributions which were combined with synthetic X-ray spectra to simulate the X-ray emission of the WR nebulae. The X-ray emissivity coefficient (j ν (n, Z, T)) was calculated in the limit of low-density regime, which is j ν (n, Z, T) = n2 χ(Z, T), where χ(Z, T ) is a function of the metallicity and the temperature. Both the gas electron density (n) and temperature (T) were obtained from the numerical results. The synthetic spectra were obtained with the CHIANTI data base (Dere et al. 1997; Landi et al. 2006), where a thermal optically-thin plasma in ionization equilibrium (IEQ) was considered. To compare with observations the X-ray emission coefficient (j ν (n, T )) was calculated in the energy range [0.3 − 1.2] keV assuming an ISM absorption due to a hydrogen column density of N H = 3.13 × 1021cm−2. Abundances in the WR stage were selected from Mesa-Delgado et al. (2014) for the WR nebulae NGC 6888 since this is a WR nebula in which a diffuse X-ray emission was de-tected (Toalá et al. 2016, 2014; Zhekov & Park 2011; Wrigge & Wendker 2002).
4. RESULTS
4.1. RSG Stage
As mentioned in § 2, the RSG phase was sim-ulated until an integration time corresponding to when the stand-off distance R0 was reached in each model. The top row panels of Figures 1, 2, 3, and 4 (left panel) display the temporal evolution of the density distribution on the xz− plane. These show a characteristic bow shock bubble produced by the interaction of the isotropic RSG wind and the plane-parallel wind (modelled as the ISM moving towards the star due to our reference system moving with the star).
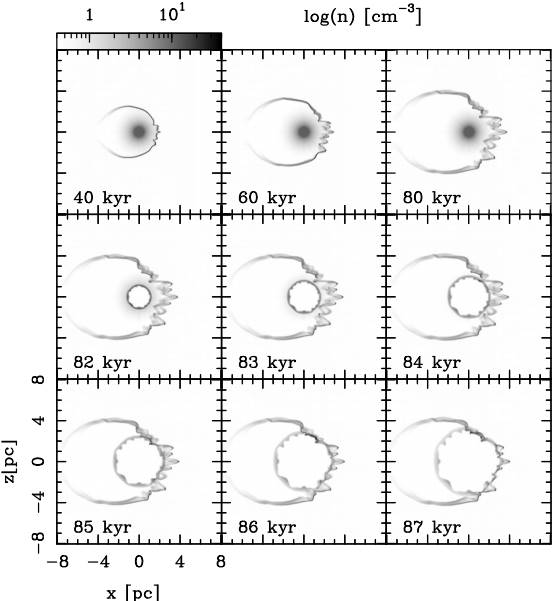
Fig. 1 For the M1 run temporal evolution of the density distribution is shown, on the xz−plane, for several integration times. The three top panels display the interaction between the RSG stellar wind and the plane-parallel ISM wind, which produces a characteristic bow shaped morphology. The evolution of the WR stellar wind into the asymmetric RSG shell is shown in the middle three panels, while the three bottom panels display the inter-action between the RSG and WR shells. Both axes are given in units of pc, while the logarithmic grey scale gives the density in units of cm-3.
The axisymmetry of the bow shock bubble is broken by the development of Vishniac instabilities (Vishniac 1983). At this stage of the evolution the RSG wind is dense enough to produce a radiative terminal shock forming a thin, dense shell which is observed in the [H II] density distribution for M1 (see Figure 5 top row panel). We show that this region has temperatures, at 80 kyr, of ≈ 104 K as shown in Figure 6. The models are hydrodynamic and do not take into account the stellar radiation, so they are expected to produce a thin shell in the H II density distribution, produced by the shock wave. In works where stellar radiation is included the ionization regions are extended and fully ionized (Dwarkadas & Rosenberg 2013; Meyer et al. 2015).
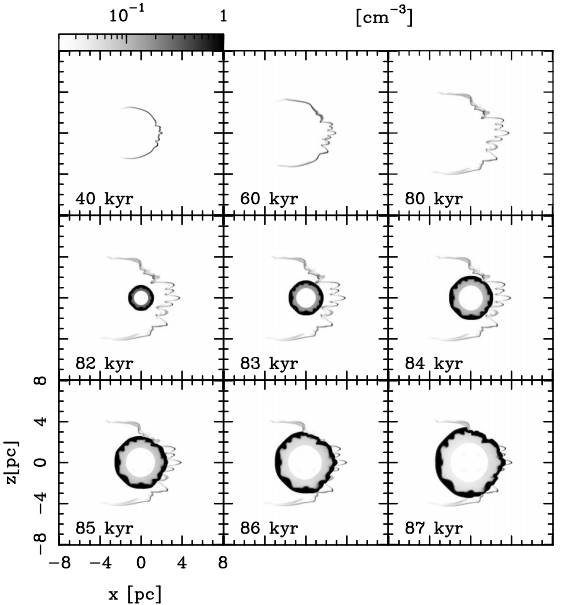
Fig. 5 For the M1 run, the temporal evolution of the number density distribution of the ionized hydrogen, [H II], is shown. These synthetic maps were computed considering that the line of the sight is along the y− axis (i.e. xz− plane is the plane of the sky). Both axes are in units of pc. The logarithmic gray scale is given in units of cm-3
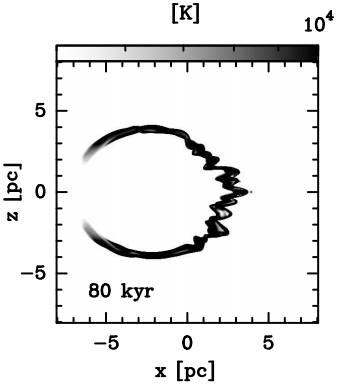
Fig. 6 For M1 the synthetic temperature map at pre-collision time t = 80 kyr is shown. This synthetic map was computed considering that the line of the sight is along the y− axis (i.e. xz− plane is the plane of the sky). Both axes are in units of pc. The logarithmic gray scale gives the temperature in units of degrees K.
At 80 kyr and 100 kyr for models M1 and M2, respectively, and at 120 kyr for both models M3 and M4 the balance between the ram pressure of the stellar wind and the ISM are achieved. Stellar evolution models for 35M⊙ predict that the duration of this stage is ≈ 200 kyr (Garcia-Segura et al. 1996b), approximately twice to what was obtained.
4.2. WR Stage
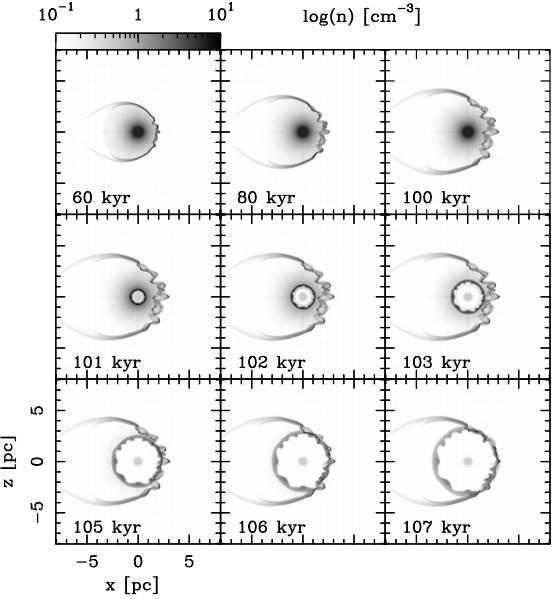
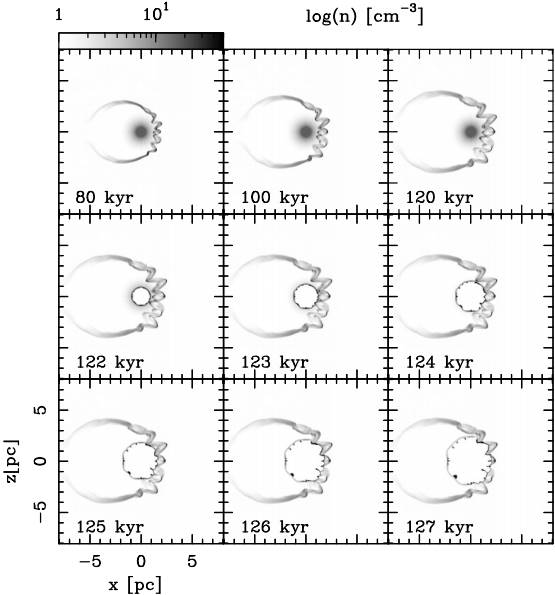
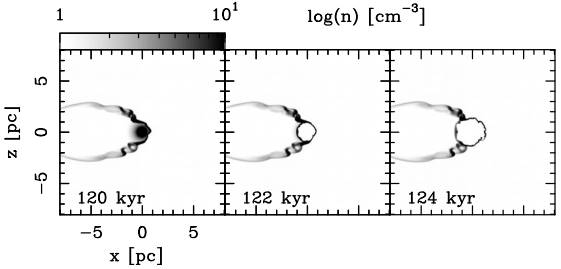
As mentioned above the WR stage starts at times t = 80, t = 100 kyr for M1 and M2, respectively, and at t = 120 kyr for both M3 and M4, i.e. when the WR stellar wind is turned on. The middle row panels in Figures 1, 2, 3, and 4 (middle panel) show how the WR stellar wind evolves through the RSG wind material. A spherical shell is formed due to the fast-slow wind interaction which takes place inside the smooth RSG medium, showing the development of Rayleigh-Taylor instabilities. A similar behavior is observed for the ionized hydrogen, H II density distribution in Figure 5 (middle panel) for M1. At integration times of t = 84, 103, 124 and 122 kyr for M1, M2, M3, and M4, respectively, the collisions between RSG and WR shells have just started.
4.3. Shell Collision
The hypothesis is that Wolf-Rayet nebulae are originated in the collision between the shells formed during the WR and RSG stages. In order to check this, the evolution of the collision of the wind shells was followed. The panels in the bottom row of Figures 1, 2, 3, and 4 (middle and right panel) display this evolution. They show that for M1 the start of the interaction occurs at an integration time between 84 and 85 kyr. The end of this interaction occurs at a time of 87 kyr, when the WR wind has passed completely through the bow shock structure generated by the RSG wind. Similarly, for M2 the shell collision takes place at an integration time [105−107] kyr, for M3 [124 − 127] kyr, and 122 kyr for M4.
4.4. X-ray Emisson From Shell Collision
Synthetic maps were created for each model for X-ray emission in the [0.3 − 0.7], [0.7 − 1.2], and [1.2 − 3] keV bands. We found only soft emission, so there is no considerable emission in the interval [1.2 − 3.0] keV. The emission is significant for the ([0.3−1.2]) keV energy band which is displayed in the top, middle, and bottom row panels of Figure 7, for models M1, M2, and M3, respectively (these maps correspond to the collision times). These maps show a clumpy and filamentary morphology. The size of the emitting region increases as the collision evolves in time, to a lesser extent for M3. This suggests that this nebula could be the product of the collision be-tween the WR and the RSG winds. Figure 8 (left panel) shows the spatial distribution of the temperature at a time t = 87 kyr for M1. A shell with temperatures 106 − 107 K, surrounded by an outer shell with temperatures of 105 − 104 K is observed.
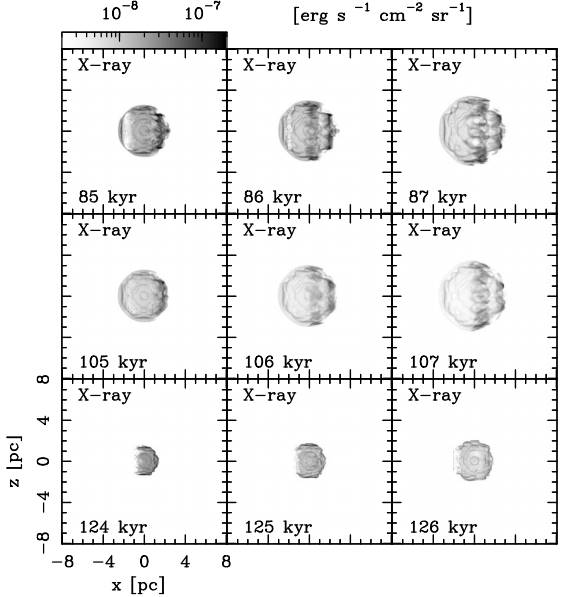
Fig. 7 X-ray emission in the [0.3 − 1.2] keV band. Top row panel, middle row panel, and bottom row panel for M1, M2, and M3, respectively. Both axes are in units of pc. The logarithmic gray scale gives the flux in units of erg s−1 cm−2 sr−1
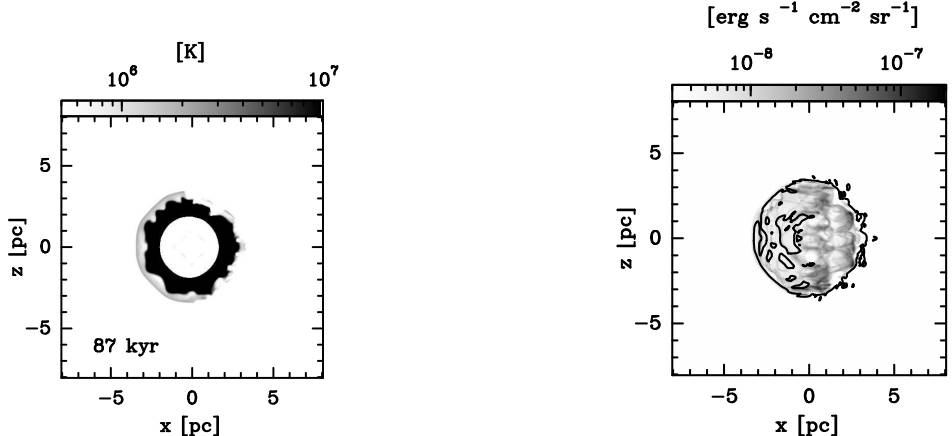
Fig. 8 Left panel. For M1 the synthetic temperature map at collision time t = 87 kyr is shown. This synthetic map was calculated considering that the line of the sight is along the y− axis (i.e. xz− plane is the plane of the sky). Both axes are in units of pc. The logarithmic gray scale gives the temperature in units of degrees K. Right panel. For Mod1 comparison between the X-ray (in gray scale) and the [H α] emissions is shown (black contours at level 4 × 10⁻⁹) for an integration time of 87 kyr. Both axes are in pc. The logarithmic gray scale is in units of erg s-1 cm-2 sr-1
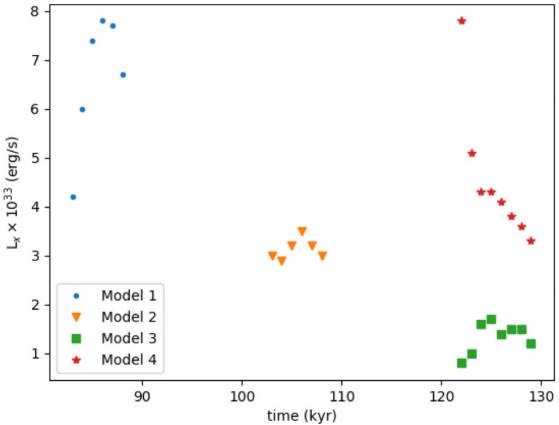
In order to analyze the spatial distribution of the H α and X-ray emission, the right panel of Figure 8 compares both emissions. In gray scale the thermal X-ray emission is displayed while the H α emission is shown as black contours. From this figure we can see that the optical emission appears to wrap around the thermal X-ray emission. An important result is that the maximum in X-ray emission occurs in the collision, as shown in Figure 9. The maximum emission for M1 takes place at a time of 86 kyr with a value of 7.8 × 1033 erg s−1. For M2 it occurs at 107 kyr with a value of 3.5 × 1033 erg s−1, M3 reaches maximum at 125 kyr with value 1.7 × 1033 erg s−1, and for M4 the maximum occurs at 122 kyr, with a value of 7.8 × 1033 erg s−1.
5. DISCUSSION
The standard model from Weaver et al. (1977) proposes thermal conduction at the interface be-tween hot gas (or shocked wind) and cold and dense gas (or shocked interstellar medium) with temperatures of 106 K and 104 K, respectively, as the mechanism for explaining the X-ray emission in stellar wind bubbles. The density of the hot gas increases due to the photoevaporation caused by the thermal conduction in the interface, producing an increase on the X-ray emission. However, their predictions are not compatible with the low luminosities observed.
Soft X-ray emission has been detected in Wolf-Rayet nebulae with luminosities in the range L x = 1033 − 1034 ergs−1 (Chu et al. 2003; Toalá et al. 2012, 2015, 2016). Our models show that the total X-ray luminosity L x (corrected by absorption) at the time of collision is close to these values, summarized in Table 2. A large part of the emission in the [0.3 − 1.2] keV band comes from the subinterval [0.3 − 0.7] keV; for our models it represents 90 %. The soft X-ray emission is associated to a short period of time of the order of ≈ 1 to 2 kyr (see Figure 9). Hydrodynamic models with thermal con-duction show a similar behavior, although soft X-ray emission lasts for periods of time < 50 kyr (Toalá & Arthur 2011). If we consider the ISM absorption in our calculation of the X-ray luminosities they turn out to be lower by two orders of magnitude (see Table 2).
TABLE 2 LUMINOSITIES OF THE MODELS
| Model | Lx[erg/s] | Time [kyr] | |||
|---|---|---|---|---|---|
| [0.3 − 0.7]a keV | [0.3 − 1.2]a keV | [0.3 − 0.7]bkeV | [0.3 − 1.2]b keV | ||
| M1 | 6.9 × 1033 | 7.8 × 1033 | 1.6 × 1031 | 6.5 × 1031 | 86 |
| M2 | 3.0 × 1033 | 3.5 × 1033 | 0.8 × 1031 | 3.5 × 1031 | 107 |
| M3 | 1.5 × 1033 | 1.7 × 1033 | 0.2 × 1031 | 2.2 × 1031 | 125 |
| M4 | 6.8 × 1033 | 7.8 × 1033 | 1.5 × 1031 | 9.9 × 1031 | 122 |
a Corrected for absorption.
b With absorption.
The synthetic maps show a clumpy structure formed by instabilities due to the wind interaction. We also note that the brightness distribution of these emissions exhibits limb-brightening (at most one or-der of magnitude higher to the right of our syn-thetic nebulae). The limb-brightening is observed to a lesser degree for M3 (see Figure 7).
The synthetic X-ray emission maps (see Figure 7) show that most of the emission is coming from several filaments produced by the wind collisions be-tween the shells from the RSG and WR stages, while according to the theory the X-ray profile should be centrally filled. Previous works have shown that soft X-ray emissions in models of WR nebulae come from clumps and can be enhanced by thermal conduction (Freyer et al. 2006; Toalá & Arthur 2011). In spite of our models being hydrodynamic, which do not con-sider the effect of thermal conduction, we measure luminosities similar to the ones obtained by Freyer et al. (2006) and Toalá & Arthur (2011).
Only 12 runaway WR stars in our Galaxy have been reported. For WR 3, WR 148, and WR 124 corrected absorbed luminosities of ≈ Lx = 1032 erg s−1 (Rosslowe & Crowther 2015) were obtained, one or-der of magnitude lower than the ones obtained in these models, see Table 2. The asymmetric nebula observed in NGC 6888 can be due to the motion of the star through the ISM. The star WR 136 is classified as a runaway star with a velocity (from the proper motion) ≈ 100 km/sec. However, the orientation between the bow shock symmetry axis and the velocity is 90 degrees (van Buren et al. 1995).
6. CONCLUSIONS
We have carried out 3D hydrodynamical simulations in order to model the evolution and emission of WR nebulae. As in previous works (Garcia-Segura et al. 1996a) we have followed the evolution of the stellar wind of the central star from the RSG to WR phase. We considered the velocity of the central star in the nebula as moving in an ISM with a constant density. This produces a RSG shell with bow shock morphology. From the density and temperature distributions obtained from our numerical results several synthetic X-ray emission maps (in the [0.3 − 1.2] keV energy range) were generated. These synthetic X-ray emission maps show a non-uniform brightness distribution. Limb-brightened, clumpy, and filamentary emissions are displayed in Figure 7, in good agreement with observational results (Gruendl et al. 2000; Moore et al. 2000). This spatial distribution of the emission is generated by the joint action of the stellar motion and the stellar evolution from the RSG to WR phases. The limb-brightened structure is produced by the collision of the SRG shell with the WR stellar wind. This collision pro-duces an enhancement of the density and the temperature, giving as a result an increase in the X-ray emission, with a difference between the low and high emission regions of one order of magnitude at most. The total X-ray luminosity computed from the simulations displays an increase after the shell collision (see Figure 9). The emission in hard X-rays is weak, only the soft X-ray emission is considerable.
In summary, our model, which includes the stellar wind evolution from the RSG to the WR stage and the motion of the central star of the WR nebulae, can reproduce an asymmetric morphology in X-ray emission.

