


 text new page (beta)
 English (pdf)
 Article in xml format
 Article references
 Send this article by e-mail
 Cited by SciELO
  Similars in
SciELO
Similars in
SciELO 
 Permalink
1. INTRODUCTION
The evolution and fate of massive stars (M > 8 M⊙) is strongly influenced by their mass loss history(Chiosi & Maeder 1986), whereas their photon and mechanical luminosities affects the dynamics and energetics of the circumstellar medium (CSM). Massive stars (8 − 40 M⊙) experience large mass loss during the red supergiant (RSG) phase. Those stars generate low temperature winds during this phase, reaching mass loss rates from 10−4 to 10−6 M⊙ yr−1 (Salasnich et al. 1999; Moriya et al. 2011)and ejecting an important fraction of their initial mass. The amount of mass loss during the RSG
phase is critical to determine the fate of those massive stars. They can either explode as supernova in the RSG stage or they can evolve bluewards in the Hertzsprung-Rusell (HR) diagram, giving a completely different appearance to the core-collapse progenitor. The amount, velocity and chemical composition of the subsequent wind stages during the post-RSG stages influence the structure and energetics of the circumstellar gas, prior to the supernova (SN) explosion. Therefore, it is important to understand the main features of mass loss rate during and after the RSG phase.
The measurements of mass loss rates for RSG stars using multiwavelength observations are still very uncertain (Smith 2014). Thus, our knowledge of the stellar wind parameters and evolution for late type supergiants remains poor. Numerical evolution models use empirical ”recipes” to set the RSG mass loss rates. Some of them are based on observational prescriptions for hot stars (de Jager et al. 1988; Nieuwenhuijzen & de Jager 1990), but slightly enhanced to ensure post-RSG evolution of stars with initial masses greater than 25 - 30 M⊙, according to observations (Humphreys et al. 1985). Other approaches use empirical mass loss recipes specific for RSG (Reimers 1975; Salasnich et al. 1999; Van Loon et al. 2005), that only describe time-averaged and smoothed mass-loss rates derived from observational diagnostics. Using those mass loss rates as input in numerical models predicts that massive stars between 8 and 25 M⊙ will end their life as a RSG with a massive hydrogen envelope, leading to a type II-P or II-L SN. However, Smartt et al. (2009) found that none of the observed progenitors of confirmed SN-IIP are more massive than 15 - 17 M⊙ and it is unclear why no RSG with an initial mass range of 15 - 25 M⊙ has been observed to explode as a SN-IIP, as expected from numerical simulations. This is known as the “RSG problem”.
A possible solution for the RSG problem would be to invoke higher mass loss rates than those currently used in canonical stellar models (Vanbeveren 1998; Yoon & Cantiello 2010; Georgy 2012A; Georgy et al. 2013A; Meynet et al. 2015), leading to a smaller hydrogen content in the SN progenitor envelope, and resulting in a H-poor SN type II, or even a SN-Ib/c. There is some evidence in favor of higher RSG mass loss rates than those currently in use; Schröder & Cuntz (2005) derived a semiempirical relation for the mass loss by cool winds and found that the RSG mass loss rates must be higher relative to Reimer’s classical parametrization. Pérez-Rendón et al. (2009) also found that some observational features of Cass A could be better explained with higher RSG mass loss rates. Additionally, there are observations of low luminosity WC stars that cannot be explained with current stellar models (Maeder & Meynet 1994; Georgy et al. 2012B), but these could be explained if WNE and WC were (probably) less massive, due to an enhanced mass loss in previous evolutionary stages, i.e. in the RSG phase. However, these stars could also be the result of binary evolution. Van Loon et al. (2005) observed that dust-enshrouded RSG present mass loss rates are a factor 3 - 50 times higher than those obtained by de Jager et al. (1988) for galactic RSG, but Mauron & Josselin (2011) found that RSG mass-loss rates based on infrared excesses agree within a factor of 4 with de Jager et al. (1988) rates. Alternatively, Beasor & Davies (2016) have proposed that dust extinction could affect the determination of the SN-IIP progenitor masses, lowering their estimated initial mass. Thus, if this effect is taken into account, the inferred SN-IIP progenitor masses often increase, making the required larger RSG mass loss rate unnecessary.
In this work we explore the consequences of higher mass loss rates for RSG stars with initial masses in the range of 15 to 23 M⊙, regardless of the underlying physical mechanisms that could cause such an increase. We examine its impact on the structure of the circumstellar gas and uncover some clues to better understand the “RSG problem”. We also study the influence of this extreme mass loss on the evolution and on the pre-supernova structure. Depending on stellar parameters (L, M , Z, etc.), stellar winds are closely linked to stellar evolution, coupling the evolution of the CSM to the star itself.
The evolution of a set of stellar models with inital masses in the range 15 - 23 M⊙ and different mass loss rates during the RSG phase (taking care to keep them within the observational uncertainties) was calculated with the code BEC (Binary Evolutionary Code). Then the magnetohydrodynamical ZEUS-3D code was used to follow the evolution of the CSM. The effect of RSG extreme mass loss has been explored recently by Georgy et al. (2012B); Meynet et al. (2015); Renzo et al. (2017). They found that the evolution of the models strongly depends on the chosen RSG mass-loss prescription. This behavior has important implications regarding the connection be-tween stellar evolution and their CSM, which will be explored in this work.
We propose to study the impact of enhanced RSG mass loss on the stellar evolution, and thereafter on their circumstellar medium. In § 2 we briefly summarize the physics, and numerical setup used to explore the stellar evolution with the BEC code. In § 3 we explore the dynamics of the CSM with ZEUS-3D. In 4 we show our results and describe the impact of the higher RSG mass loss rates on the stellar evolution and the circumstellar medium. In § 5 we discuss the results.
2. INPUT PHYSICS OF STELLAR MODELS
We built a set of single star models using the stellar code BEC (Binary Evolutionary Code), extensively described by Petrovic et al. (2005); Yoon et al. (2006). The models consider ZAMS masses of 15, 18, 20 and 23 M⊙ and a fixed chemical composition of Z = 0.014 (Asplund et al. 2009). The simulations are performed with OPAL opacities (Iglesias & Rogers, 1996), and a nuclear network including the major H, He, C, Ne and O burning reactions. The models were built either without rotation (Case A models), or with initial rotational velocities of Vrot = 100 km s−1 at the ZAMS (Case B). We used the Ledoux criterion to define the zones of stellar convection, and the processes of convective transport. Rotation triggers some additional trans-port mechanisms of chemical species inside the star and, following (Heger et al. 2000), the effects of rotational mixing were considered as diffusive processes. Convective overshooting was taken into account using a moderate overshoot parameter of 0.2 times the local pressure scale height. We set the α parameter α = L/HP = 1.6 on the main sequence. This α parameter in the RSG phase was set to 2.5, in order to fit the observational position of galactic RSG in the H-R diagram(Levesque et al. 2005). Mass loss rates used in each evolutionary stage are described in § 3.
The stellar models were computed from the ZAMS up to carbon core exhaustion. After this point, the stellar core evolution is faster than in previous stages, and the external layers are not affected. Thus, our final models correspond to the structure of the supernova progenitor star. Due to numerical difficulties, the 23 M⊙ rotating models were evolved up to core He exahustion, but their final features are uncertain and must be taken with caution.
3. WIND PARAMETERS AND CIRCUMSTELLAR MEDIUM MODELS
To build the stellar models we adopted empirical mass-loss rate formulations (“recipes”) that depend on stellar parameters such as mass, radius, luminosity, metallicity, etc. These parameters, in turn, are dependent on stellar evolution: one parameter affects the behavior of the others.
3.1. Mass Loss Prescriptions
Mass loss rates are a key ingredient in this work. In this section, we describe the specific parametrization used at each stellar evolutionary stage in or-der to obtain mass-loss rates and wind velocities as a function of time. These can be regarded as an output from the stellar models. Wind mass loss rates for hot stars were calculated according to the prescription given in equation (24) of Vink et al. (2001), for OB stars in the temperature range of 27500 < Teff ≤ 50000 K (see their equation (24)), and for 12500 < Teff ≤ 22500 K we used their equation (25). Outside this temperature range, we ap-plied the Nieuwenhuijzen & de Jager (1990) mass loss rate (hereafter NdJ90):
including a metallicity dependence of Ṁ ∝ Z 0 86 (Vink & de Koter 2005).
For the RSG phase (defined when log Teff < 3.65), we explored the influence of increasing the mass loss rates to values higher than commonly used in the evolution of the star and their circumstellar medium. For this purpose, we simply increased those of equation (1) in NdJ90 by a factor of 2 (hereafter, “canonical” mass loss), 6 and 10. The evidence that RSG mass-loss rates are higher than those by de Jager et al. (1988) can be found elsewhere (Salasnich et al. 1999; Yoon & Cantiello 2010). Here, we have chosen our factors to maintain the rates within the observational limits (Mauron & Josselin 2011; Van Loon et al. 2005). Non-rotating models are labeled with an “A” tag whereas models with an initial rotation of (vrot = 100 km s−1 ) are tagged with a “B”. The number next to this rotational label indicates the initial mass of the star and the mass loss rate enhancement factors during the RSG phase are labeled by “×2” , “×6” and “×10”, for models with increased loss rates by a factor of 2, 6, and 10, respectively. Note that all RSG mass loss rates thus obtained lie within observational values for Galactic stars (Figure 1). It is likely that the numerical mass loss rates could be increased by an even higher factor.
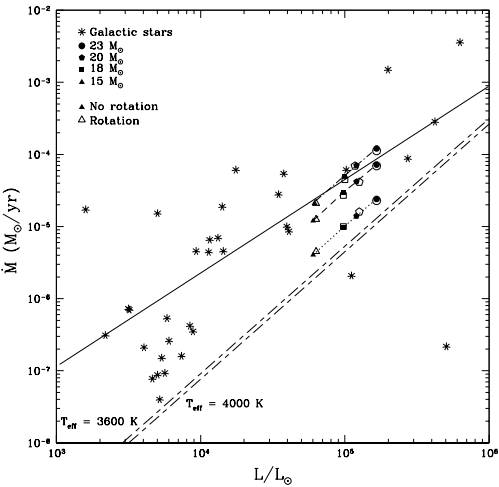
Fig. 1 RSG mass loss averages obtained from our numerical models in comparison with observational mass loss rates for oxygen-rich AGB, and RSG Galactic stars. The solid line shows the mass-loss versus luminosity relation fitted to a Galactic sample (Matsuura et al. 2016). The short-dash line connects our “×2” models, long-dash and dot-dash lines our “×6” and “×10” models, respectively. We note that our numerical mass-loss rates lie within the observational ones. For a comparison to canonical numerical models, the long-dash/short-dash line shows the linear approximation of the empirical mass-loss formula of de Jager et al. (1988) for typical temperatures of RSG (Teff = 3600 K, upper line; Teff = 4000 K lower line).
The mass loss rates for the post-RSG evolution when the surface hydrogen mass fraction falls below Xs < 0.45 and Teff > 10000 K are set according to Hamann et al. (1995):
and we have further adopted the Nugis & Lamers (2000) mass-loss rate when the surface H fraction drops below Xs < 0.3 (WNE star):
For rotating stars there is an increase in the mass-loss rates due to the effect of the centrifugal forces at the outermost stellar layers. The rotational mass loss rate is enhanced (Friend & Abbott 1986) by a factor of:
where ξ = −0.43, (ω = 0) is the mass-loss rate of the non-rotating star and Ω ≡ v/vcritic is the ratio of the the surface equatorial velocity to the critical rotation velocity (break-up peed) defined as vcritic 2 = 1/2 vescape 2 [equation 5].
The escape velocity is calculated as a function of the stellar parameters, changing over time:
and the corresponding stellar wind velocity was set to:
β is a free parameter which accounts for the relation between wind velocity and the escape velocity and is the Eddington’s factor. To set the value of β, we used the criterion from Eldridge et al. (2006) and made a linear interpolation for uncovered ranges. The wind velocity of WR stars was derived according to Nugis & Lamers (2000):
Using these equations, we obtained the mass-loss rates and wind velocities as a function of time during the entire evolution, from the ZAMS until the end of core C-burning, for stars with initial masses of 15,18, 20 and 23 M⊙. At this point the outer layers of the star have their final configuration (pre-SN stage). These results are then used to perform numerical models of the CSM structure and dynamics that are closely linked to the details of stellar evolution.
3.2. Hydrodynamical Models
To simulate the circumstellar gas around our stars, we used the hydrodynamical code ZEUS-3D, which is a three-dimensional, finite-difference Eulerian explicit code that integrates the hydrodynamical ideal gas equations in the absence of viscosity (Stone & Norman, 1992; Clarke, 1996). The stellar evolution outputs (mass loss rate, velocity, effective temperature and stellar radius) are used as the time-dependent, inner boundary conditions in the hydrodynamical simulations. This is done in a similar way as in Pérez-Rendón et al. (2009), but in this paper we follow the gas dynamical evolution in a 2D grid over the entire stellar lifetime, from ZAMS to supernova explosion. The average wind velocities, total mass lost and lifetimes at each stage are given in Tables 3 to 7 for some typical models. Post-main sequence stages are defined as a function of the stellar effective temperature as follows: we considered a RSG star when log(Teff /K) < 3.65; a yellow supergiant (YSG) when 3.75 < log(Teff /K) < 3.9; and a luminous blue supergiant star (LBSG) when log(Teff /K) > 4.0 (but the star is not a Wolf-Rayet star). The “YSG/LBSG” label refers only to post-RSG phases. In the WR stage we distinguished two subtypes: the star is a WNL when it is a Wolf-Rayet star with some presence of hydrogen (Xs < 0.45 and log(Teff /K) > 4.0); whereas it is a WNL star when Xs < 0.30.
For the physical grid, we used spherical coordinates with periodic boundary conditions in the altazimuthal direction. The simulations were done on a two-dimensional r−θ grid of 200 cells in radial direction and 90 cells in the angular coordinates. For the 15 M⊙ models, the physical radial extension is 12 pc (giving a spatial resolution of 0.06 pc/cell) whereas the rest of the models have a radial length of 15 pc (0.075 pc/cell). In colatitude, we considered a range of (0, 90 ◦), giving an angular resolution of 1 ◦/cell.
Here we do not consider the effects of photoionization from the stellar UV flux, nor the effects of magnetic fields or heat conduction. To simulate the ionization, we set the lower cutoff temperature to 104 K. The hydrodynamical calculations start at the ZAMS, with the stellar wind flowing into an al-most uniform and homogeneous interstellar medium (ISM), of no = 100 cm−3 (typical of molecular clouds), with small random perturbations of 1.0 % in density, and an initial thermal energy density corresponding to a background temperature of Tb = 10 K.
4. RESULTS
4.1. Stellar Models
Figures 2 and 3 show the evolutionary tracks in the Hertzsprung-Russell diagram (HRD) for non-rotating (Case A) and rotating stellar models (Case B). For models having the same initial mass, rotational velocity and metallicity, the differences in evolution are a consequence of the adopted value for the RSG mass-loss rate.
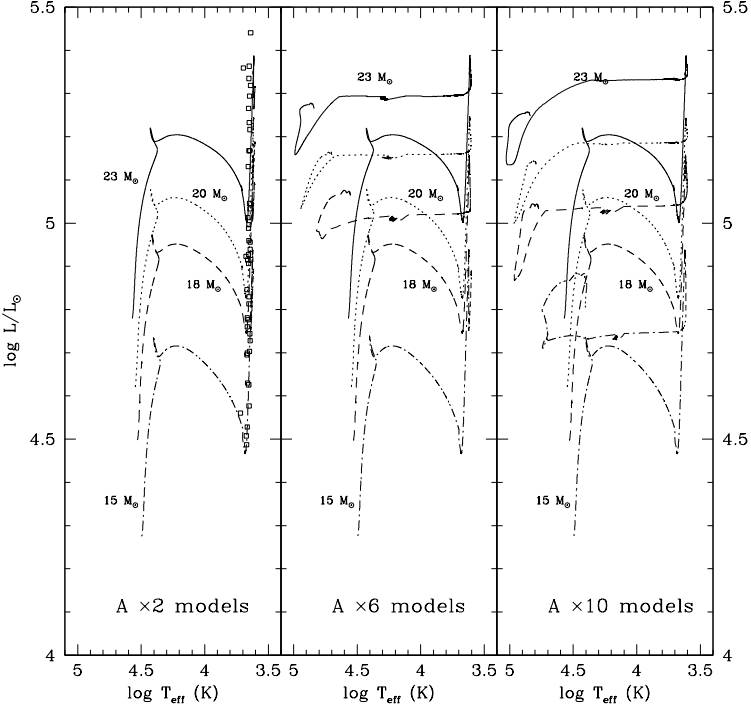
Fig. 2 Case A (vrot = 0 km s−1 ): Set of evolutionary tracks for stars in the range 15-23 M⊙, from the ZAMS up to the exhaustion of carbon in the stellar core. The left panel shows the evolution using a mass-loss rate of Nieuwenhuijzen & de Jager (1990) increased by a factor of 2 during the red supergiant phase (“×2” models). The squares indicate the position of galactic RSG observed by Levesque et al. (2005). Models displayed in the central panel are calculated with RSG mass-loss rate enhanced by a factor of 6 (“×6”) and in the right panel they are enhanced by a factor of 10 (“×10”). Note that the differences in the evolutionary tracks come only from the enhancement of the RSG mass loss rates.
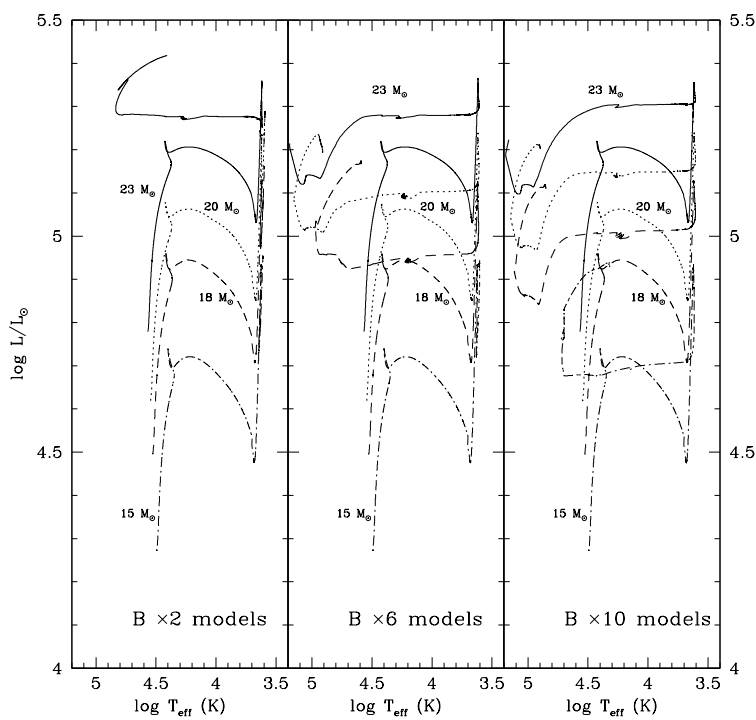
Fig. 3 Case B (vrot = 100 km s−1 ): Set of evolutionary tracks from the ZAMS up to the exhaustion of carbon in the core, for rotating stars with masses in the range 15-23 M⊙. The left panel shows the evolution using the mass-loss rate of Nieuwenhuijzen & de Jager (1990) increased by a factor of 2 during the red supergiant phase (“×2” models). The central panel models are calculated with RSG mass-loss rates enhanced by a factor of 6 and the right panel is calculated with mass-loss rates enhanced by a factor of 10 in RSG. Due to numerical difficulties the 23 M⊙ models were only evolved until He core exhaustion.
Figure 2 shows evolutionary tracks for non-rotating models. In Figure 2- left , we show the “canonical” models, whose RSG mass loss rate is that of NdJ90, but increased by a factor of 2 (“×2” tag). All these models evolve redwards after the main sequence, crossing only once the HR diagram towards the cool side to end their life as a red supergiants. The RSG mass loss is not large enough to produce a bluewards track. Massive stars produce core-collapse supernovae, so we assume that all our models will end up as a SN. As expected, all our canonical models end their lives as RSG stars keeping a massive H-envelope, and will lead to a II-L or II-P supernovae, according to Heger et al. (2003).
The evolutionary paths change for models with a higher RSG mass loss rate. For “×6” models, only the 15 M⊙ star ends up as a red supergiant. In the rest of the models, the increase of the RSG mass loss peels off a significant mass from the H-envelope and triggers post-RSG evolution in stars of 18 M⊙ and larger, which evolve bluewards through a short yellow and blue supergiant phase, diminishing or losing their H-rich envelope, to become Wolf-Rayet stars (WR). When their He-core fraction drops below 0.10 (Yc < 0.10), the stars stop their path towards the blue and evolve to slightly cooler temperatures, de-scribing a blue loop beyond the main sequence band. The Wolf-Rayet stars will remain the rest of their life on the blue side of the HRD, to finally explode as stars with an H-poor envelope (WNL), or as an hydrogen lacking one (WNE). Table 1 shows the supernova progenitor for all our models: A18×6 model will explode as a WNL star, whereas the A20×6 and A23×6 models end their lives as lack-of-H WNE stars. The final supernova type will be II-L/b for the WNL star and a SN-Ib for WNE progenitors (Heger et al. 2003) .
TABLE 1 PRE-SUPERNOVA PROPERTIES OF NON-ROTATING STELLAR MODELS (CASE A)
| Model | tlife(yrs) | Mfin/M⊙ | Rfin/R⊙ | Teff (K) | log L/L⊙ | Ys | Tc(108 K) | pre-SN star |
|---|---|---|---|---|---|---|---|---|
| A15×2 | 12 717 026 | 12.0 | 538.0 | 4 143 | 4.89 | 0.295 | 13.0 | RSG |
| A15×6 | 12 716 338 | 6.2 | 574.0 | 4 000 | 4.88 | 0.295 | 13.0 | RSG |
| A15×10 | 12 724 001 | 5.2 | 13.2 | 25 275 | 4.80 | 0.677 | 12.5 | WNL |
| A18×2 | 10 232 270 | 12.5 | 708.0 | 4 061 | 5.09 | 0.310 | 15.1 | RSG |
| A18×6 | 10 219 431 | 6.8 | 8.8 | 36 040 | 5.07 | 0.707 | 12.0 | WNL |
| A18×10 | 10 225 965 | 6.4 | 3.1 | 59 364 | 5.04 | 0.976 | 17.8 | WNE |
| A20×2 | 8 910 644 | 12.4 | 807.5 | 4 019 | 5.19 | 0.300 | 15.0 | RSG |
| A20×6 | 8 909 797 | 7.6 | 5.0 | 50 129 | 5.16 | 0.782 | 15.1 | WNE |
| A20×10 | 8 913 075 | 7.4 | 3.2 | 62 010 | 5.14 | 0.936 | 12.0 | WNE |
| A23×2 | 7 684 136 | 12.6 | 933.5 | 4 026 | 5.32 | 0.314 | 15.1 | RSG |
| A23×6 | 7 684 127 | 8.9 | 3.0 | 68 942 | 5.27 | 0.987 | 12.5 | WNE |
| A23×10 | 7 689 342 | 8.6 | 2.9 | 69 027 | 5.25 | 0.987 | 13.0 | WNE |
All the models with extreme RSG mass loss (“×10”) undergo post-RSG evolution to end their lives as Wolf-Rayet stars. Only the A15×10 model keeps a small H-envelope, ending as WNL, whereas more massive stars end their life as more evolved WNE stars. The mass loss was insufficient to produce a WC star (a bare core of CO).
The time that the stars spend in each post-MS stage changes depending on the RSG mass-loss rate: Tables 3 to 7 show the stellar lifetimes in each evolutionary phase for some interesting models. We note that the lifetime as a red supergiant decreases as the mass-loss rate grows. This occurs because the post-RSG evolution to bluewards is triggered when the ratio of the mass of the envelope to that of the stellar core drops to a value of 0.4-0.6 (Giannone 1967; Meynet et al. 2015) . In our simulations, this ratio is reached when the models lose the same amount of their envelope mass (the mass loss rate does not affect the size of the He core). For larger mass loss rates, the critical ratio is attained at shorter times. Our A18×2 model lost 5.16 M⊙ during the RSG stage, whereas the models A18×6 and A18×10 lost 10.48 M⊙ and 10.60 M⊙, respectively, before evolving bluewards to become WRS. The same occurs for the 20 M⊙ models: the A20×2 model lost 7.23 M⊙, whereas the A20×6 and A20×10 models lost 11.35 M⊙ and 11.39 M⊙ as RSGs to end their lives as blue WR stars. The mass lost by quiescent winds during Wolf-Rayet phases is only a small amount of the total mass (less than 5 % of the initial mass).
TABLE 2 PRE-SUPERNOVA FEATURES OF ROTATING STELLAR MODELS (CASE B). Vrot = 100 km s−1
| Model | tlife(yrs) | Mfin/M⊙ | Rfin/R⊙ | Teff (K) | log L/L⊙ | Ys | Tc(108 K) | p-SN |
|---|---|---|---|---|---|---|---|---|
| B15×2 | 12 972 695 | 11.7 | 599.2 | 4 070 | 4.95 | 0.301 | 15.0 | RSG |
| B15×6 | 12 951 069 | 5.7 | 598.2 | 4 030 | 4.93 | 0.305 | 11.6 | RSG |
| B15×10 | 12 957 966 | 5.1 | 22.6 | 20 753 | 4.93 | 0.663 | 12.2 | WNL |
| B18×2 | 10 299 185 | 11.6 | 811.1 | 3 950 | 5.16 | 0.316 | 10.7 | RSG |
| B18×6 | 10 347 978 | 6.6 | 8.3 | 39 283 | 5.17 | 0.770 | 19.1 | WNE |
| B18×10 | 10 386 567 | 5.9 | 2.4 | 71 123 | 5.11 | 0.986 | 15.3 | WNE |
| B20×2 | 9 186 509 | 10.4 | 1009.0 | 3 900 | 5.29* | 0.318 | 11.6 | RSG |
| B20×6 | 9 255 333 | 6.8 | 2.0 | 81 313 | 5.19 | 0.985 | 17.0 | WNE |
| B20×10 | 9 253 252 | 6.5 | 2.1 | 80 222 | 5.21 | 0.985 | 16.5 | WNE |
| B23×2 | 7 965 195 | 9.4 | 26.3 | 25 429 | 5.42* | 0.708 | 6.6 | WNL |
| B23×6 | 8 010 574 | 7.6 | 0.6 | 152 871 | 5.21 | 0.980 | 4.9 | WNE |
| B23×10 | 8 019 565 | 7.4 | 0.7 | 144 412 | 5.22 | 0.978 | 5.4 | WNE |
TABLE 3 WIND PROPERTIES OF THE A15×2 MODEL
| Stage | Δt (Myr) |
log Ṁ (M⊙ yr−1) |
ΔM (M⊙) |
v∞
(km s−1) |
|---|---|---|---|---|
| MS | 11.997 | −7.93 | 0.14 | 2200 |
| RSG | 0.699 | −5.38 | 2.89 | 35 |
We must remember that the wind blown mass, the duration of each evolutionary phase and the final stage of the stellar evolution have a strong influence not only on the final core-collapse supernova explosion, but also on the evolution and morphology of the circumstellar medium.
Note: t refers to the duration of the stage, log Ṁ is the logarithm of the mass loss rate, M is the mass lost during each phase and v∞ is the average velocity of stellar wind. Same notation for Tables 4, 5, 6 and 7.
TABLE 4 WIND PROPERTIES OF THE A15×10 MODEL
| Stage | Δt (Myr) |
log Ṁ (M⊙ yr−1) |
ΔM (M⊙) |
v∞
(km s−1) |
|---|---|---|---|---|
| MS | 12.017 | −7.93 | 0.14 | 2200 |
| RSG | 0.428 | −4.66 | 9.28 | 35 |
| YSG/LBSG | 0.217 | −5.83 | 0.32 | 800 |
| WNL | 0.061 | −5.74 | 0.11 | 2000 |
TABLE 5 WIND PROPERTIES OF THE A18×6 MODEL
| Stage | Δt (Myr) |
log Ṁ (M⊙ yr−1) |
ΔM (M⊙) |
v∞
(km s−1) |
|---|---|---|---|---|
| MS | 9.723 | −7.53 | 0.29 | 2265 |
| RSG | 0.318 | −4.48 | 10.48 | 30 |
| YSG/LBSG | 0.082 | −5.59 | 0.21 | 800 |
| WNL | 0.080 | −5.51 | 0.25 | 2100 |
TABLE 6 WIND PROPERTIES OF THE A20×6 MODEL
| Stage | Δt (Myr) |
log Ṁ (M⊙ yr−1) |
ΔM (M⊙) |
v∞
(km s−1) |
|---|---|---|---|---|
| MS | 8.483 | −7.41 | 0.33 | 2300 |
| RSG | 0.209 | −4.27 | 11.35 | 25 |
| YSG/LBSG | 0.004 | −4.76 | 0.07 | 900 |
| WNL | 0.127 | −5.47 | 0.43 | 2800 |
| WNE | 0.073 | −5.56 | 0.20 | 2000 |
Table 1 shows the pre-supernova properties of non-rotating models. The symbols have the usual meaning: “Mfin” and “Rfin” refer to final mass and radius, “Ys” is the He fraction on the surface, “Tc” is the stellar core temperature and the “pre-SN” col-umn refers to the supernova progenitor type. Note that a 15 M⊙ single non-rotating star could become a WR star if it has an extreme RSG mass loss rate (increased by a factor of 10 or more), so we have found that the minimum initial mass necessary to form a Wolf-Rayet star decreases as the RSG massloss rates increase, as expected. For the rest of models we found a similar behavior.
Figure 3 shows evolutionary tracks for rotating stars (CASE B). As expected, stellar rotation in-creases the MS lifetimes with respect to non-rotating models, due to the increase of the core size, and its enrichment with fresh fuel coming from the outer layers. Stellar rotation also modifies the later evolutionary paths, in comparison to the CASE A models: for example, for a low RSG mass loss rate (“×2” tag) the rotating 23 M⊙ model (B23×2) evolves post-RSG, unlike the non-rotating case.
Rotational mixing also modifies the chemical composition of the stellar surface, more efficiently bringing nucleosynthesis products from the core to the surface. The outer envelopes of rotating models are slightly He-enriched, even during the MS, favoring the formation of WR stars and causing rotating stars to end their lives with a higher surface He abundance, or even as WC/WO stars. This enriched material is wind-blown away from the star, impacting the chemical evolution of the surrounding stellar gas.
All our models will end up as supernova progenitors, but rotation often changes their mass, radius and/or color, in comparison to Case A models, as shown in Table 2. We observe that the pre-SN luminosity increases compared to non-rotating models, yielding more evolved progenitors, as a consequence of the higher rotational mass loss and mixing.
4.2. Circumstellar Medium
The evolution of the circumstellar gas strongly depends on the stellar evolution, through stellar wind properties such as the mass loss rate, velocity, and temperature. These properties change dramatically depending on the evolutionary phase, causing the dynamical behaviour of circumstellar gas to be quite distinctive in each stage. In this section we will describe the formation of shells and bubbles around the star as a consequence of the variation of the mass loss rate and wind velocity in the course of stellar evolution.
Main Sequence Stage: The evolution of circum-stellar gas in all our models is qualitatively the same during the main sequence; only in the physical dimensions of the sculpted structures and the values of physical parameters vary. During the main sequence, a massive star blows a hypersonic wind (≈ 2 − 3 × 10³ km s−1 ) that collides with the cold ISM leading to the formation of a double shock structure: an outer shock traveling outwards (in the star’s reference frame) colliding with the ISM and a reverse shock that separates the free blowing wind from the shocked one. This reverse shock advances inwards leaving a hot and initially isobaric region of shocked stellar wind (called stellar bubble) surrounding the free wind zone. The bubble region is pressure dominated, and has high temperatures and low densities (T ≈ 107 K, ρ ≈ 10−28 g cm−3 ).
In the main sequence, the mass loss rate is approximately 10−7 − 10−8 M⊙ yr− 1 , and increases slightly with time, as a function of the effective stellar radius and luminosity. The wind velocity drops in an opposite way, as shown in Figure 4 for the A18×6 model. The kinetic energy of the free blowing wind is converted into thermal energy inside the stellar bubble, which progressively grows in size. The external shock pushes an overdense shell of swept interstellar material (called MS shell), which surrounds the bubble (Weaver et al. 1977).
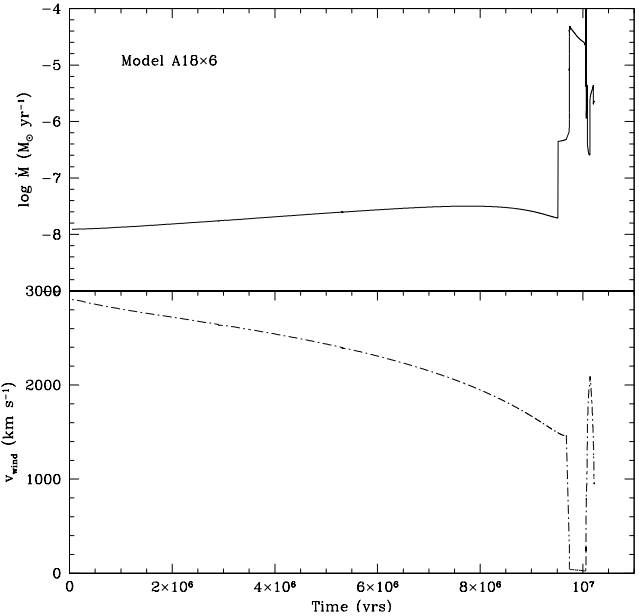
Fig. 4 Plots of typical stellar mass loss rate (top) and wind velocity (bottom) as a function of time for the A18×6 model. The main sequence, red supergiant and Wolf-Rayet phases are clearly distinguishable. These data were used as input for the circumstellar hydrodynamic simulations.
As the bubble grows, we observe the appearance of turbulence as a consequence of pressure and density fluctuations (Dwarkadas, 2007). The dense MS shell shows shear instabilities due to variations in the shock front position, maybe as a result of the initial perturbations in our simulations, or due to Vishniac instabilities in radiative shells (Ryu & Vishniac, 1987). However, these instabilities grow slowly as the MS shell expands, and they do not fragment the shell, or affect its sphericity; this is the CSM structure where the RSG will expand afterwards. Table 8 shows the final position of MS shells at pre-SN time for RSG supernova progenitors.
TABLE 7 WIND PROPERTIES OF THE B20×2 MODEL
| Stage | Δt (Myr) |
log Ṁ (M⊙ yr−1) |
ΔM (M⊙) |
v∞
(km s−1) |
|---|---|---|---|---|
| MS | 8.531 | −7.41 | 0.33 | 2300 |
| RSG | 0.642 | −4.84 | 9.27 | 20 |
TABLE 8 FINAL POSITION OF STELLAR SHELLS FOR RSG SUPERNOVA PROGENITORS
| Model | RSG shell radius (pc) |
MS shell radius (pc) |
|---|---|---|
| A15×2 | 1.2 | 9.8 |
| A15×6 | 2.3 | 9.8 |
| A18×2 | 1.7 | 13.1 |
| A20×2 | 3.2 | 13.9 |
| A23×2 | 3.6 | 15.0 |
| B15×2 | 2.0 | 11.0 |
| B15×6 | 3.0 | 11.0 |
| B18×2 | 2.3 | 13.5 |
| B20×2 | 3.0 | 13.8 |
Red Supergiant Stage: After the main sequence, all our models evolve toward the cool side of the HRD to become a red supergiant. The mass loss rate increases and the RSG wind becomes denser and slower, with velocities fluctuating be-tween ≈ 10-160 km s−1 . Ram pressure of the dense RSG wind eventually balances the thermal pressure of the hot main sequence bubble, and a termination shock is formed. The RSG wind is decelerated and piles up into the shock to build a second shell (RSG shell) which expands at low velocity (≈ 5 km s−1 ). The outer edge of the RSG shell presents Rayleigh-Taylor instabilities (Dwarkadas 2007), and we could observe the growth of RT “fingers” that, in some cases, extend far: up to 1-2 pc beyond the shell. Figure 5 (top), shows the pre-supernova circumstellar medium around a typical RSG star (model A15×2); we note the MS shell with a radius of 10.8 pc enclosing the hot and rarefied stellar bubble. Inside the bubble, near to the star, we observe an unstable RSG shell with a radius of r ≈ 1.2 pc. This CSM configuration is the same for all models that end their lives as red supergiants, only the position of the MS and the RSG shells vary, due to the difference of the stellar phase’s lifetimes, and of the injected mechanical luminosity. Table 8 shows the position of the MS and the RSG shell at the pre-supernova stage for our RSG supernova progenitor models. The pre-SN circumstellar medium consists of a dense and free streaming RSG wind with a profile ρ ∝ r−2, inside an unstable and massive RSG shell. The hot MS bubble remains beyond the RSG shell bordered by the shocked MS shell. This will be the circumstellar medium, where the supernova blast wave will expand, producing a SNII-L or SNII-P light curve. The circumstellar medium pre-supernova for some typical RSG progenitors is shown in Figure 5 ( top ) and Figure 9.
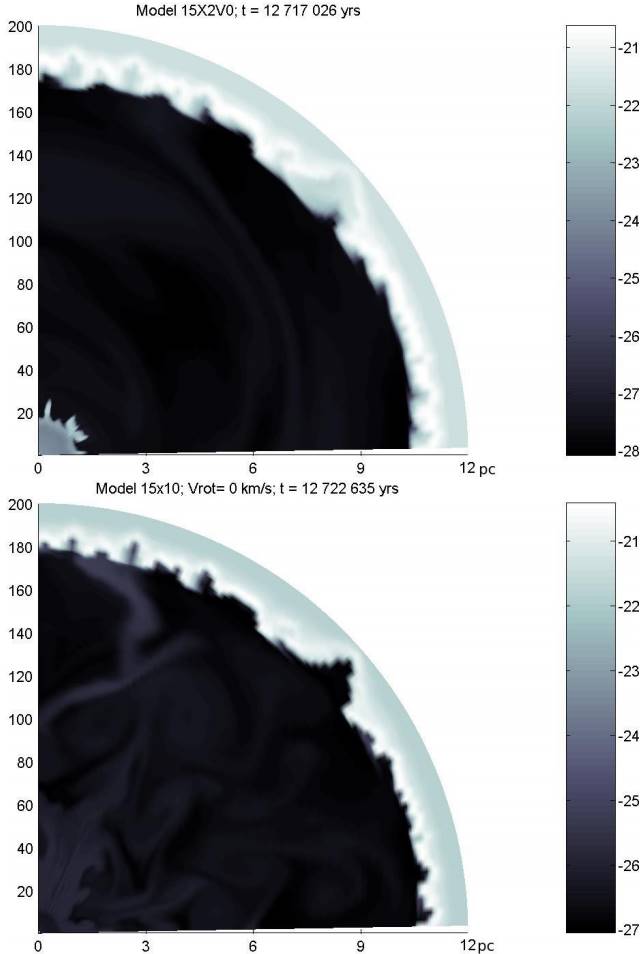
Fig. 5 Top: Logarithm of the circumstellar gas density (g cm−3 ) of the A15×2 model at the presupernova stage (t = 12, 717, 026 yrs). The initial density of the ISM is n = 100 cm−3 and the grid has dimensions of 200×90 cells in r × θ direction, corresponding to a physical distance of 12 pc in radial extension (0.075 pc/cell) and 90 degrees in latitude (1 deg/cell). Stellar equator is on the x-axis. The main sequence shell has a radius of ≈ 10.8 pc. An unstable RSG shell appears at a distance of r ≈ 1.2 pc from the star. Note the presence of “Rayleigh-Taylor” fingers. The RSG wind and shell have a combined mass of 2.9 M⊙. Labels on y-axis indicate the r-cell number in our simulation. Bottom: Same representation for the A15×10 model at pre-SN (t = 12, 724, 001 yrs). The MS shell encloses the hot bubble with a turbulent structure. The RSG shell and the WR shells previously built have already merged with the outer MS shell before the SN explosion. The color figure can be viewed online.
Wolf-Rayet Stage: Some of our models inlude post-RSG evolution7. These stars shed the H-envelope to become Wolf-Rayet stars that blow a less dense and faster wind (of order 2500 − 3000 km s−1 ), whereas the star evolves back to the blue side of the HRD, to finally explode as supernova.
At the onset of the Wolf-Rayet phase, the fast wind sweeps the previous slow RSG wind forming a miniature version of the MS bubble: differences in velocity in the transition zone result in a rarefaction wave, possibly accompanied by a shock (Georgy, Walder et al. 2013), and build-up in the inter-face a new WR shell expanding with high velocity (≈ 100 km s−1 ). This fast WR shell is Rayleigh-Taylor unstable, and presents a filamentary structure.
In Figure 6, we show the shell formed near the star in the WR phase for the A18×6 model (r ≈ 1.7 pc) bordered by the dense RSG wind zone and the previous RSG shell (r ≈ 3.0 pc). Eventually, the fast WR shell will strongly collide with the slower RSG shell, and both shells will merge and break up in some zones, forming clumps and tails of dragged material, which travel outwards into the interior of the MS bubble, spreading the WR+RSG shell de-bris in an asymmetrical manner. The stellar bubble has a turbulent structure with dense knots and irregular tails expanding into it. Depending on the time remaining until the final core collapse, the fingers and knot debris could reach the outer MS shell to stop and/or merge into it. This is important for the morphology of the circumstellar medium at the pre-supernova stage.
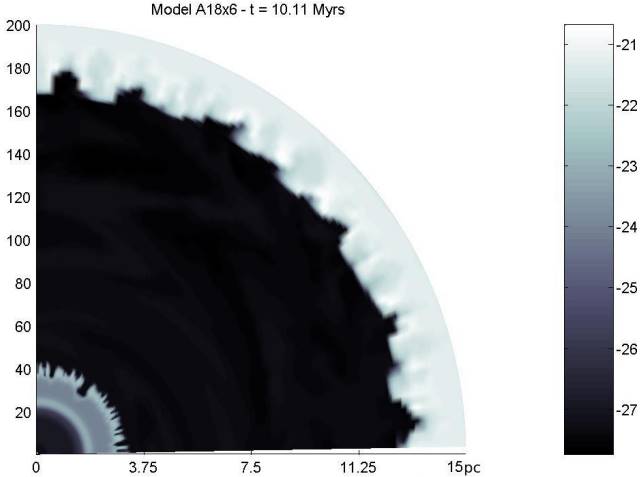
Fig. 6 Logarithm of gas density ( g cm−3 ) surrounding a star of 18 M⊙ (model A18×6) at a time of 10,110,512 yrs. The grid (200 × 90 cells) has a radial length of 15 pc (0.075 pc/cell) and 90 degrees in latitude (1 ◦/cell). Three shells are formed during the entire evolution of the star: near to the star is the fast WR shell at r ≈ 1.9 pc bordered by the dense RSG wind and the RSG shell at a position of ≈ 3 pc. Between this and the outer MS shell (rMS ≈ 12.8 pc) a hot pressure dominated bubble with a slightly turbulent structure is formed. The color figure can be viewed online.
The circumstellar medium for WR progenitors is shown in Figures 5 (bottom) , 7, and 8, for three different cases of interest. Figure 5 (bottom) corresponds to the A15×10 model which ends life as a WNL star, after following the next evolutionary path:
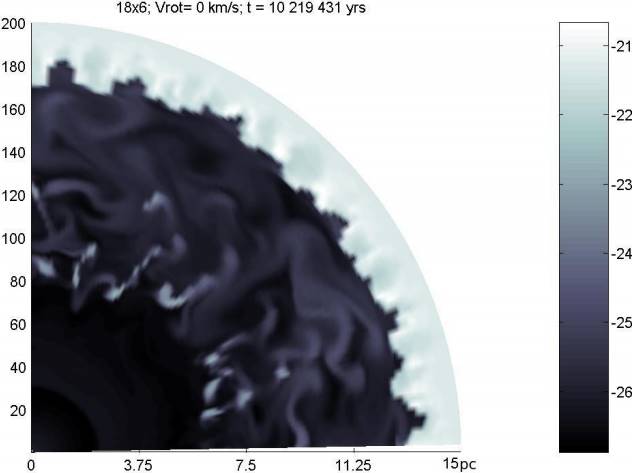
Fig. 7 Logarithm of gas density ( g cm−3 ) surrounding a star-- of 18 M⊙ (model A18×6) at pre-SN stage (t = 10, 219, 431 yrs). The physical dimensions are the same than Figure 6. The MS shell has a radius of 12.8 pc surrounding a turbulent hot bubble with some knots of dense debris from the former RSG + WR shell (broken by their collision). The debris spreads from 6 to 8 pc. Note the high turbulence inside the hot bubble. The color figure can be viewed online.
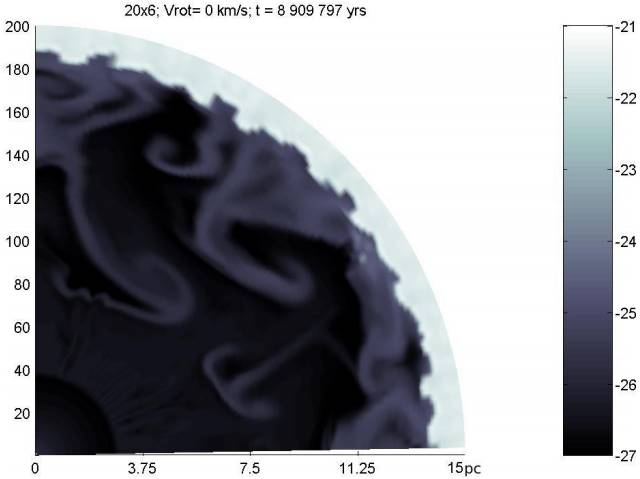
Fig. 8 Logarithm of gas density ( g cm−3 ) of the CSM for the A20×6 model at pre-supernova stage (t = 10, 272, 006 yrs). The dimensions are the same as in Figure 6. The WR shell has collided and merged with the former RSG shell, both dissipating into the hot wind shocked bubble. Most of the mass of these shells has merged with the outer MS shell. The color figure can be viewed online.
During the evolution of this star, we observe the formation of the MS, RSG, and WR shells. As presupernova, the outer MS shell has a radius of r ≈ 10.8 pc. The fast WR shell has already collided with the previous RSG shell, breaking both and traveling outwards; the debris are spread into the hot stellar bubble. This fragmented material reaches the MS shell, merges with it and in some cases bounces back.
The presupernova medium for this first case con-sists of a zone of a fast WR wind, that blows into an anisotropic and slightly turbulent hot bubble, where the pressure and density vary from point to point. The interaction of the SN blast wave with this turbulent medium will be highly wrinkled, with the trans-mitted and reflected wave shocks traveling outward at slightly different velocities (Dwarkadas 2007).
As second case of interest, Figure 7 shows the presupernova medium of the A18×6 model. This star follows a similar evolutionary path, ending its life as a SN IIL/b. During the evolution, the star develops its MS, RSG and WR shells. The last two also collide and break up just as before. However, in this case the time between the onset of the WR shell and the supernova explosion is too short and the collisional debris traveling outwards (WR + RSG shell) do not have enough time to reach the outer MS shell. As a result, the CSM presupernova for this case consists of the free WR wind still carrying the shell debris dense knots (ρ ≈ 10−22 g cm−3 ) traveling outwards with low velocities. We can see the complex velocity field in the regions of free WR wind, the dense WR+RSG shell debris and an aspherical termination shock. The interaction of the supernova shock wave with the densest zones will result in an increased temperature of the X-rays, and in optical emission of the knots (Dwarkadas 2005) at different times, due to their uneven positions.
Figure 8 shows the presupernova CSM of the model A20×6. The evolutionary path is similar to the previous cases, except for the supernova progenitor stage:
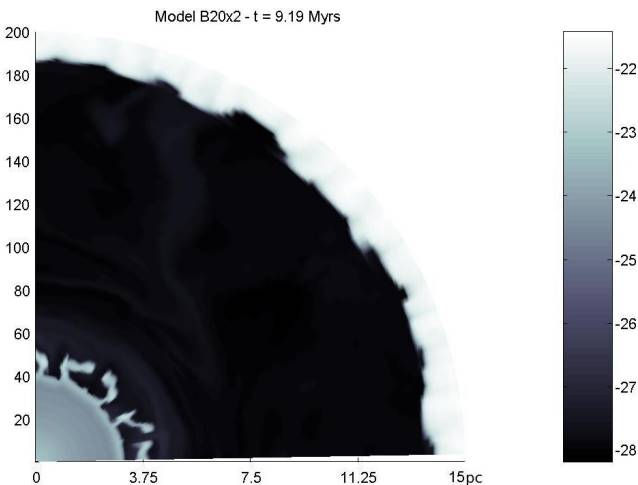
Fig. 9 Logarithm of gas density ( g cm−3 ) of the CSM at pre-SN of the B20×2 model at pre-supernova (t = 9, 186, 509 yrs). The RSG shell has a radius of 3 pc. Note the presence of large “Rayleigh-Taylor” fingers formed in the outer edge of the decelerated RSG wind. The color figure can be viewed online.
The interaction of the supernova blast wave with the CSM will be similar to the first case (A15×10 model), but with a more turbulent medium. However, the SN ejecta will be hydrogen lacking, leading to a very different chemical return into the circum-stellar gas.
5. DISCUSSION AND CONCLUSIONS
In this work, we have built numerical models of stellar evolution and circumstellar gas dynamics for single stars with initial masses of 15, 18, 20 and 23 M⊙ (rotating and non-rotating) to explore the im-pact of increased mass loss rates in the RSG phase. We found that the stellar evolution post-RSG (if any) is fully determined by the RSG mass-loss rate, also having a strong impact on the gas distribution around the star at pre-supernova time.
We found that an extreme RSG mass-loss has a strong impact mainly on:
• Post-RSG stellar evolution. Canonical models of stellar evolution predict that all massive stars with masses smaller than ≈ 25 M⊙ will end their lives as RSG stars, producing a supernova explosion of type SNII-P, or even a SNII-L. In agreement with this, our “canonical” simulations (“×2” models) end their lives as RSG stars, except for the rotational model of a 23 M⊙ star (B23×2) where the rotational in-ternal mixing favors post-RSG evolution bluewards. When we increased the RSG mass-loss rate by a factor of 6, the stellar evolutionary tracks were different, presenting post-RSG evolution to blueward for stars with lower masses, which is in agreement with other authors (Salasnich et al. 1999; Ekström et al. 2012). Our 18, 20 and 23 M⊙ stars evolve blue-wards after the RSG stage to become Wolf-Rayet stars. We noted that a consequence of increasing the RSG mass-loss rate is a lower minimum mass limit for the formation of a Wolf-Rayet star (for single stars).
The models with an RSG mass-loss rate increased by a factor of 10 (“×10” models) further decrease the lower mass limit to develop post-RSG evolution. In this case, even a 15 M⊙ star becomes a WR star. Extreme RSG mass-loss is also a possible channel for the formation of low luminosity WR stars from stars evolving away from their RSG phase, at lower masses than predicted by models with a standard mass loss rate.
• The lifetime that the star spends in each evolutionary stage and the chemical yields. The time spent by the star in each evolutionary stage is strongly influenced by the RSG mass-loss rate, but the total stellar lifetime seems not to depend on it. Larger RSG mass-loss rates modify the time that the star spends in the red and blue zones of the HRD during the He-main sequence, shortening the RSG and the YSG-LBSG stages, and lengthening in some cases the duration of the Wolf-Rayet phase. This behavior has a strong impact on the blue to red supergiant (B/R) ratio: a shorter RSG phase combined with an increase in the WR lifetime leads to a B/R ratio that grows with higher RSG mass loss rates.
Larger RSG mass-loss rates also contribute to the metal enrichment of the circumstellar medium by favoring the subsequent evolution to WR stars. Surface abundances of (post-RSG) WR stars are enriched with He-burning products and their stellar winds change the metals proportion of the chemical composition of the CSM gas bubble and shells. Lowering the mass limit to form WR stars causes a more efficient return of enriched material into the ISM affecting the chemical evolution of the galaxies in a new way.
• Supernova progenitor and SN type. Increasing RSG mass-loss plays a dominant role in determining the outcome stellar evolution, and even modifies the type of SN progenitor. Our simulations with a standard mass loss end their lives as red super-giants (SNIIP), but the largest RSG mass-loss rates cause the red supergiant phase to become only a transition phase, and triggers extended blue loops to form Wolf-Rayet stars that will end their lives as supernovae of type IIL/b or Ib. An increase in the RSG mass-loss rate causes stars to be supernova progenitors for masses as low as 15 M⊙ (with extreme RSG mass-loss rate and rotation), lowering the mass that we expect for a star to explode in the blue side of the HRD. This could explain the lack of observed supernova progenitors of Type II-P with masses M ≥ 15 − 17 M⊙ due to the strip-off of their H-rich envelope before the explosion. This is a crucial point to understand the “RSG problem”.
Note that even though all our models end their lives as red (RSG) or blue (WR) supernova progenitors, none of them explodes as a YSG or LBSG stars. This behavior contradicts other authors (Meynet et al. 2015) who also study the increase of the RSG mass-loss for massive stars. They find that none of their models become WR stars despite their higher RSG mass-loss rates; their RSG stars usually lose less mass during their red stage but the final models are less massive than ours (for non-rotating simulations).
• The circumstellar medium. Stellar evolution has a strong impact on the interstellar gas dynamics through the amount of lost mass and the wind velocity. Both quantities are set in the evolutive stage. The blown wind sculpts the surrounding gas, leading to the formation of distinctive bubbles and shells. Canonical models predict that 15 − 23 M⊙ stars will end their lives as red supergiants surrounded by a dense and slow wind, and enclosed by a massive RSG shell lying at different distances from the star (depending on the mechanical luminosity during the RSG phase). However, in our models we found that this canonical behavior deviates when the stellar evolutionary path changes. By increasing the RSG mas-loss rate we found that 18 M⊙ stars (or even 15 M⊙ with extreme mass loss) are able to become WRs and explode as supernova in this phase. Unlike the RSG case, the Wolf-Rayet star develops a fast third shell that collides and breaks the former RSG shell, spreading their coupled de-bris into the wind-blown bubble. The turbulence inside the bubble leads to an inhomogeneous distribution of the stellar material and of the chemical species. This turbulence is the former circumstellar medium around the Wolf-Rayet progenitors, except for one case, where the time between the WR on-set and the supernova event is too short, and the RSG+WR clumps are still near the star at the moment of the supernova explosion. This will change the supernova blast wave dynamics and may show strong lines of He and N from the knots being photoionized or shocked by the supernova front.
RSGs are pulsationally unstable during a part of their lifetimes (Yoon & Cantiello 2010), perhaps playing a key role in driving strong mass loss in an episodic way. We have explored this scenario and found that massive ejections in the RSG phase are swept away by the intense WR wind. This behavior will be investigated in a forthcoming paper.
We have shown that larger mass-loss rates during the RSG stage modify the stellar evolution for stars with the same initial mass, rotational velocity and metallicity. We found that the evolution of massive stars (15 to 23 M⊙ ) depends on the initial mass, metallicity, rotational velocity and RSG mass-loss rate. The gas dynamics of their circumstellar medium also changes, because it is tightly bound to the stellar evolution, so that the distribution of density, temperature, velocity field and chemical com-position at the pre-supernova stage vary with the RSG mass-loss rates, even for the same initial stellar mass. We note that the global appearance of CSM for a specific type of SN progenitor star is not unique, because the gas dynamics is also strongly affected by the duration of each evolutionary stage in the star’s life.

