


 text new page (beta)
 English (pdf)
 Article in xml format
 Article references
 Send this article by e-mail
 Cited by SciELO
  Similars in
SciELO
Similars in
SciELO 
 Permalink
1. Introduction
Since its discovery, the HH 34 jet has been one of the finest, brightest, and best collimated HH jets known to emanate from a young star. Early studies established the basic characteristics of the jet, showing that the jet moves out of a compact cloud core in the L1641 cloud in Orion (Reipurth et al. 1986, Bührke et al. 1988, Raga & Mateo 1988, Reipurth & Heathcote 1992).
A series of distant bow shocks have been discovered both to the south and the north, showing that HH 34 comprises a giant HH flow (Bally & Devine 1994), modeled by Cabrit & Raga (2000) and Masciadri et al. (2002). At the here adopted distance of 400 pc (Kounkel et al. 2017, Menten et al. 2007), the total projected extent of the HH complex is 2.5 pc.
The source is an embedded Class I protostar with a total luminosity of 21 L⊙ (value from Reipurth et al. 1993, but converted to a distance of 400 pc); the source was detected in the radio continuum by Rodríguez & Reipurth (1996) and Rodríguez et al. (2014). The HH 34 source is surrounded by a molecular cloud core, which has been studied by Stapelfeldt & Scoville (1993), Davis & Dent (1993), and Anglada et al. (1995). As the jet moves out from the core it entrains gas and forms a small molecular outflow (Chernin & Masson 1995).
HH 34 moves away from the driving source with a velocity of about 300 km/s at an angle of roughly 25◦ to the plane of the sky (Heathcote & Reipurth 1992, Eisloeffel & Mundt 1992), values that have been confirmed and refined with subsequent HST images obtained over longer timescales (Reipurth et al. 2002, Raga et al. 2012a).
Devine et al. (1997) showed that the components of the giant HH complex slow down with distance and come to almost a stand-still at the terminal bow shocks. Physical conditions along the jet have been studied by e.g. Morse et al. (1992, 1993), Takami et al. (2006), Beck et al. (2007), García López et al. (2008), Rodríguez-González et al. (2012), and Nisini et al. (2016). The shocks within the HH 34 jet have been successfully modelled as resulting from multi-mode variable velocity flows (Raga & Noriega-Crespo 1998). Refined models have been presented by Raga et al. (2002a, b, 2011b, c, 2012b) and Raga & Noriega-Crespo (2013).
The optical images of the HH 34 complex show that the jet is one-sided, but using Spitzer data Raga et al. (2011a) concluded that this is due to extinction from the cloud core surrounding the driving source, and they found that a counterjet is detected at infrared wavelengths (see also García López et al. 2008 and Antoniucci et al. 2014). In this paper, we discuss the nature of the counterjet based on archival near-infrared HST images which reveal its fine structure.
In particular, we discuss an archival HST image taken with the F160W filter (with a dominant contribution from the [Fe II] 1.64 µm line), which shows the northern HH 34 counterjet at higher resolution than the Spitzer 4.5 µm image of Raga et al. (2011a). The counterjet emission (in the [Fe II] 1.64 µm and H2 2.12 µm lines) has been previously seen in the long-slit spectra of García López et al. (2008), and in the [Fe II] 1.64 µm image of Antoniucci et al. (2014).
In § 2, we describe the F160W HST image, as well as the 4.5 µm Spitzer image of Raga et al. (2011a). In § 3, we present these two images and determine knot positions along the jet and the counterjet. In § 4, we discuss the lateral offsets of the knot positions from the jet axis and the 1.5 and 4.5 µm intensities as a function of position for the jet and the counterjet. The 4.5 to 1.5 µm intensity ratios are then used to estimate the visual extinction to the knots along the HH 34 jet and counterjet. Finally, the results are summarized in § 5.
2. The observations
In this paper we analyze an archival HST image of HH 34 obtained under proposal 11548 (P.I. Thomas Megeath) in October 2009. This image was taken with the F160W filter on the WFC3 camera, with a 2946 s exposure. The F160W filter has a 1.5369 µm pivot wavelength and a 0.0826 µm RMS bandwidth. For the HH 34 jet, the emission in the F160W filter bandpass is dominated by the [Fe II] 1.64 µm line, with a smaller contribution (at
In order to obtain a calibrated [Fe II] 1.64 µm map, we multiply the original HST image by the “PHOTFLAM” parameter (in the header of the fits file) and by the 0.268 µm “rectangular passband width” of the F160W filter. This width is given in the WFC3 Instrument Handbook.
We compare the F160W image with the 4.5 µm Spitzer image of Raga et al. (2011a). This image is a
3. The 1.5 and 4.5µm emission of the HH 34 outflow
The left frame of Figure 1 shows the 1.5 µm image of a region around the source of the HH 34 outflow. It is clear that the counterjet is detected. The central frame of Figure 1 shows a convolution of this image with a
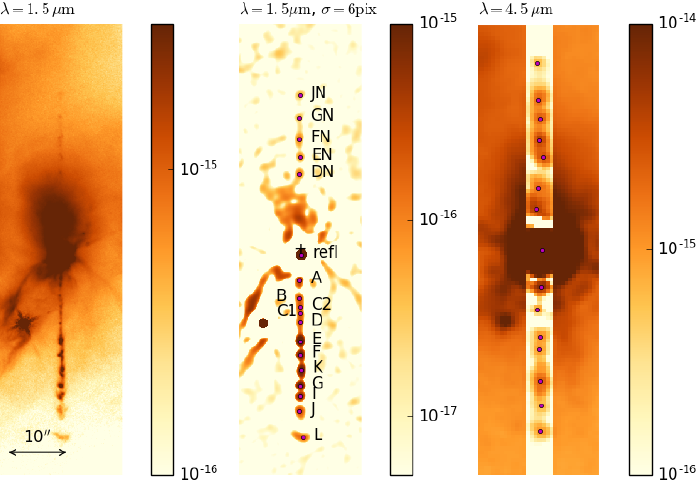
Fig. 1 The HH 34 jet/counterjet system, rotated (14◦, counterclockwise) so that the outflow axis is parallel to the ordinate. Left: HST 1.5 µm image. Center: 1.5 µm image convolved with a 6 pixel (0′′.54) half-width wavelet. Right: Spitzer 4.5 µm image, with a central band in which a linear background (tied to the fluxes at the edges of the band) has been subtracted. In the central and right frames we show the positions of the fitted intensity peaks; the identifications of the peaks are given only in the central frame. The position of the outflow source is shown with a cross in the central frame. The images are displayed with a logarithmic scale on the right of each frame (in units erg cm−2 s−1 arcsec−2). The color figure can be viewed online.
In the central frame of Figure 1 (showing the 1.5µm image convolved with a
The knot along the outflow axis closest to the outflow source (labeled “refl” in Figure 1) corresponds to the reflection nebula at the base of the HH 34 jet. The position of the VLA source of Reipurth et al. (2000a), shown with a cross (in the central frame of Figure 1) is ≈ 1′′ to the N of the reflection nebula. This radio source most probably coincides with the position of the outflow source.
4. The knot positions and intensities
We have determined the positions and intensities of the knots along the HH 34 jet and counterjet by fitting paraboloids to the intensity peaks along the outflow axis. The resulting knot positions are shown on the central (1.5 µm) and right (4.5 µm) panels of Figure 1.
Figure 2 shows the (x, y) positions of the 1.5 µm knots, where x is the distance from the outflow source along the flow axis (with x < 0 for the jet and x > 0 for the counterjet), and y is the distance perpendicular to this axis (with positive y to the W).
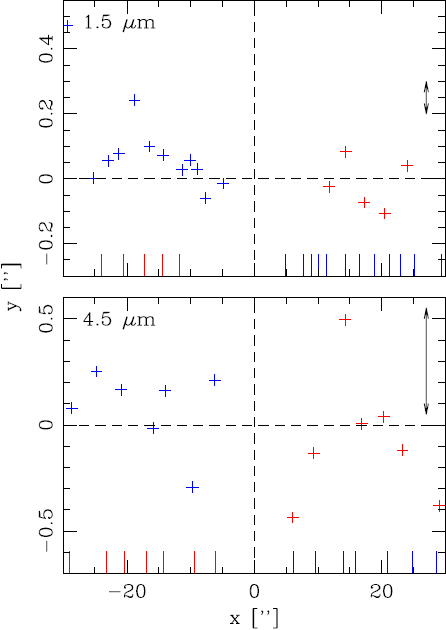
Fig. 2 Offsets perpendicular to the outflow axis as a function of distance from the source measured in the convolved 1.5 µm (top) and in the 4.5 µm frame (bottom). The blue crosses correspond to the southern jet (negative x values), and the red crosses to the northern counterjet (x > 0). Positive y values denote offsets to the W of the outflow axis. The blue (jet) and red ticks (counterjet) along the bottom axis show the positions of the knots along the oppositely directed outflow lobes. The double arrows on the right of the plots show the errors in the offsets. The color figure can be viewed online.
From this figure, we note several interesting features:
the 4.5 µm jet and counterjet show almost coincident knots at distances < 15′′ from the source, and somewhat larger offsets in the jet/counterjet knot positions at larger distances. This effect was described in detail by Raga et al. (2011a, c),
for x > 12′′ we see reasonable position coincidences between the 1.5 and 4.5 µm jet and counterjet knots. Offsets of
for
Also, the 1.5µm knots have systematic displacements, with the knots at
Figure 3 shows the intensities of the jet and counterjet knots in the 1.5 µm convolved frame (top) and in the 4.5 µm frame (bottom) as a function of distance from the outflow source. The 1.5 µm emission shows that:
the jet knots start at
the counterjet knots start at
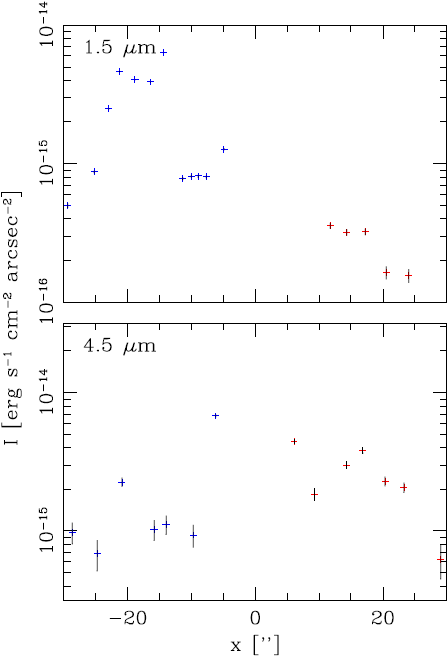
Fig. 3 Peak intensities of the knots along the jet (negative x, blue crosses) and counterjet (positive x, red crosses) in the convolved 1.5 µm (top) and in the 4.5µm frame (bottom). The color figure can be viewed online.
The lack of counterjet knots and low jet knot intensities close to the source (at
The 4.5 µm emission (bottom frame of Figure 3) shows that:
the jet and counterjet knots start at a distance
the jet/counterjet knots at similar distances from the source have intensities that differ by factors of at most 3, with brighter knots in the jet or in the counterjet at different values of x.
We now assume that the 4.5 to 1.5 µm intrinsic intensity ratio has the same value for all of the jet/counterjet knot pairs (grouping into pairs the jet and counterjet knots with similar distances to the outflow source) at distances larger than 10′′ from the source (i.e., excluding the first two knots along the jet and the counterjet seen in the bottom frames of Figures 2 and 3). We additionally assume that the
For the jet knots within 10” from the source, we assume that the intrinsic 4.5/1.5 µm ratios are constant, with values equal to the 4.5/1.5 µm ratio of knot D (at
In order to convert the “observed vs. intrinsic” 4.5/1.5 µm ratios to a visual extinction AV, we use an
The results of this exercise are given in Figure 4 (where we show the extinction obtained for the southern jet with negative x and for the northern counterjet with positive x). To derive the plotted values we have set

Fig. 4 Optical extinction AV (calculated from the 1.5 and 4.5 µm intensities, as described in the text) as a function of distance x from the outflow source. The region of the southern jet is shown with negative x values, and the northern counterjet with positive x. The color figure can be viewed online.
In Figure 4 we see the following:
there is a region within
as we approach the source along the jet (with
as we move away from the source along the counterjet (for
We note that Podio et al. (2006) used optical and near-IR diagnostics to obtain an
5. Conclusions
We present a previously unpublished HST 1.5 µm archival image that shows the HH 34 jet and counter-jet. This is the first time that we can see the structure of the HH 34 counterjet at
A comparison of the positions of the jet and counterjet knots shows that in the lower resolution 4.5 µm image we do not see significant off-sets from the outflow axis. However, in the new, higher resolution 1.5 µm image we see systematic offsets which indicate (somewhat marginal) point-symmetric jet/counterjet curvatures (see Figure 2).
This result implies that we are probably seeing the effect of a small precession of the outflow axis.
We also measure the intensities of the knots along the jet and counterjet in the 1.5 and 4.5 µm images. We find that at 4.5 µm the knots at similar distances along the jet and counterjet have intensities that differ by at most a factor of ≈ 3 (with brighter counterjet knots at distances
The fact that the jet and counterjet show highly symmetric structures at 4.5 µm (Raga et al. 2011a), while the HH 34 system shows a “one sided” jet at optical wavelengths (with an invisible counterjet that reappears at the HH 34N “head”, see Bührke et al. 1988), indicates that a strong asymmetry in the extinction towards the jet and the counterjet is present.
We have then computed the relative extinction between the jet and the counterjet assuming that the intrinsic 1.5 to 4.5 µm ratios have identical values for the jet and counterjet knots at similar distances from the outflow source. With this assumption (and using an appropriate extinction curve) we have calculated the visual extinction A V along the HH 34 jet and counterjet.
We find that, approaching the outflow source along the southern jet, AV grows quite dramatically within
Moving away from the source along the northern lobe of the outflow, the counterjet emission is first detected at
We therefore see the existence of:
a very high extinction region within
a plateau in the extinction along the counterjet from
It then appears that we see evidence for the existence of two structures that produce the extinction:
a central core with a
a spatially more extended, dense structure in the foreground of the counterjet.
This extended structure could be related to the complex molecular emission observed in the region around the HH 34 outflow (see, e.g., Stapelfeldt & Scoville 1993 and Anglada et al. 1995).
Our determination of the extinction, however hinges on an assumed symmetry between the 4.5/1.5 µm ratios of the jet and counterjet knots with
A more precise measurement of the extinction in the HH 34 jet and counterjet will be obtained with future James Webb Space Telescope observations of this outflow system. These observations will provide the IR diagnostic lines appropriate for carrying out a proper determination of the position-dependent extinction.
AR acknowledges support from the DGAPA-UNAM grant IG100218. We thank an anonymous referee for relevant corrections.

