


 nueva página del texto (beta)
 Inglés (pdf)
 Artículo en XML
 Referencias del artículo
 Enviar artículo por email
 Citado por SciELO
  Similares en
SciELO
Similares en
SciELO 
 Permalink
1. Introduction
Generally, Extragalactic Radio Sources (EGRS) are classified based on their observed geometric structures, and the amount and variability of the magnitude of radio power they emit (e.g. Fanarof & Riley 1974; Scheuer & Readhead, 1979; Barthel 1989). With improved observations and better theoretical foundation, the general understanding is that the nature and processes that govern the generation and dynamical evolution of EGRS is common to them all. Thus, unification schemes have been developed which posit that, fundamentally, all EGRS are similar in nature and differ only by the factors limiting/affecting their observations. These factors include the viewing angle, relativistic beaming, screens through which the sources are viewed; obscuring torus, time travel and time delay effects (Rees 1967; Ryle & Longair 1967; Zensus 1997; Urry & Padovani 1995; Laing 1988; Garrington et al. 1988; Garrington & Conway 1991; Willot et al. 1998; Barthel 1989; Ubachukwu & Ogwo, 1998; Antonucci 1993; Ubachukwu 2002; Gopal-Krishna & Wiita 2004).
In the relativistic beaming and orientation based unification scheme, the projected linear size D of a radio source is believed to be fore-shortened due to orientation effect and is given by (e.g. Ubachukwu 2002)
where D
0
in the intrinsic linear size of the radio source in its rest frame and
where
where
In the orientation based unification scheme of extragalactic radio sources, radio loud quasars and FR-II radio galaxies are expected to differ only in their orientation dependent properties, since FR-II radio galaxies are believed to lie closer to the plane of the sky than radio loud quasars (e.g. Barthel 1989). Thus, we expect a stronger anti-correlation between the projected linear size
In this paper, using the projected linear size as orientation parameter, the arm-length ratio and the lobe-luminosity ratio as asymmetry parameters, we test the FR-II radio galaxy and radio-loud quasar unification scheme for a well-defined sample (e.g Nilsson 1998), and the effect of selection bias in the two classes of radio sources in their luminosity-redshift plane.
2. Data
The data used for this analysis comprises 1045 heterogeneous sources (543 FR-II radio galaxies (Gs), 366 radio loud quasars (Qs) and 135 unidentified radio sources based on optical classification) taken from Nilsson (1998). For the present analysis, we selected the sources with complete information on the parameters: the redshift
Figure 1 shows the
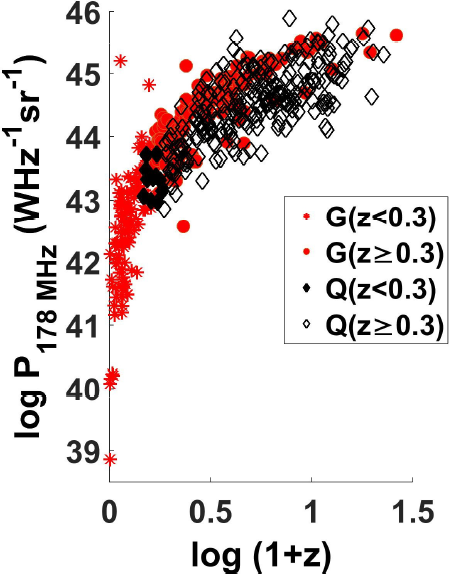
Fig. 1 Distribution plot log P178MHZ against log(1 + z) for z < 0.3 and z ≥ 0.3 for galaxies (red) and quasars (black). The color figure can be viewed online.
3. Analyses, results and discussion
We show in Table 2 the results of the average values (the means with the associated error and the median values) for the analysed radio source parameters (D, Q and R) for the different ranges of z and Q subsamples. Generally, the projected linear sizes of galaxies
Table 2 Average values (mean with associated error & median) of the projected linear size (D).*
| z Range |
D(kpc) mean |
D(kpc) median |
Q mean |
Q median |
R mean |
R median |
|
| z(All) | Gs(All Q) | 401.5 ± 308.4 | 270.0 | 1.4 ± 0.3 | 1.3 | 1.1 ± 0.6 | 0.9 |
| z(All) | Qs(All Q) | 221.4 ± 162.0 | 146.6 | 1.6 ± 0.5 | 1.3 | 2.0 ± 1.8 | 1.0 |
| z(All) | Gs(Q ≤ 1.5) | 380.2 ± 255.8 | 300.3 | 1.2 ± 0.1 | 1.2 | 1.1 ± 0.5 | 0.9 |
| z(All) | Qs(Q ≤ 1.5) | 257.8 ± 181.8 | 167.0 | 1.2 ± 0.1 | 1.2 | 2.2 ± 2.1 | 1.0 |
| z(All) | Gs(Q > 1.5) | 462.2 ± 465.5 | 185.0 | 2.0 ± 0.4 | 1.8 | 1.1 ± 0.8 | 0.7 |
| z(All) | Qs(Q > 1.5) | 159.3 ± 115.4 | 106.3 | 2.2 ± 0.7 | 1.8 | 1.6 ± 1.3 | 1.2 |
| z ≥ 0.3 | Gs(All Q) | 310.6 ± 222.3 | 223.9 | 1.5 ± 0.4 | 1.3 | 1.2 ± 0.8 | 0.9 |
| z ≥ 0.3 | Qs(All Q) | 205.9 ± 146.8 | 141.5 | 1.6 ± 0.5 | 1.3 | 2.0 ± 1.8 | 1.0 |
| z ≥ 0.3 | Gs(Q ≤ 1.5) | 322.6 ± 213.7 | 241.0 | 1.2 ± 0.1 | 1.2 | 1.2 ± 0.6 | 1.0 |
| z ≥ 0.3 | Qs(Q ≤ 1.5) | 234.8 ± 160.4 | 160.1 | 1.2 ± 0.1 | 1.2 | 2.2 ± 2.2 | 1.0 |
| z ≥ 0.3 | Gs(Q > 1.5) | 284.4 ± 236.9 | 151.9 | 2.2 ± 0.5 | 2.0 | 1.4 ± 1.2 | 0.7 |
| z ≥ 0.3 | Qs(Q > 1.5) | 158.8 ± 116.0 | 105.5 | 2.2 ± 0.7 | 1.8 | 1.7 ± 1.3 | 1.2 |
* Redshift and log P178MHZ estimated using all the sources in the sample for radio-loud quasars and FR-II radio galaxies, and for the sample and the subsample with z ≥ 0.3.
Generally, for the sample and
For all the samples and z-subsamples considered, and for the Q ≤ 1.5 subsample, the ratio R
G
/R
Q
≈ 1 but it decreases to R
G
/R
Q
≈ 0.6 for the Q > 1.5 subsample. The observed similarities/differences between the lobe-luminosity ratio of galaxies and quasars for Q ≤ 1.5/Q > 1.5 suggest that the beaming/orientation effects that foreshorten the observed projected size of quasars (note D
G
/D
Q
is systematically smaller for Q > 1.5 than Q ≤ 1.5 - see the median values) may also be responsible for enhancing its brightness, thus the lower values of R
G
/R
Q
obtained for Q > 1.5. We also note that several authors (e.g. Ingham & Morrison 1975; Valtonen 1979; Macklin 1981; McCarthy et al. 1991; Best et al. 1995; Wardle & Aaron 1997; Jeyakumar & Saikia 2000; Saikia et al. 2003; Arshakian & Longair 2004; Jeyakumar et al. 2005; Subrahmanyan et al. 2008; Safouris et al. 2009; Priya et al. 2012; Onuchukwu & Ubachukwu 2013; Onuchukwu 2017)) have pointed at other factors (e.g. environment/intrinsic) as being important in the interpretation of the dynamics and evolution of such highly asymmetric radio sources. We also observe that the quasars in our sample are located in denser environments than galaxies (the density
In Figures 2-7 we display the distribution plots of D, Q and R of the radio sources for different Q and z subsamples. In Figure 2, the distribution plots of D for all Q, Q ≤ 1.5 and Q > 1.5 for the sample and the z-subsample indicate a lognormal distribution for both galaxies and quasars, though with a seemingly increasing tendency to be more left-skewed for the galaxy subclass than for the quasar subclass of radio sources. We have used the natural logarithm considering the range in values of D in our sample 1.1 - 5853.3 kpc.
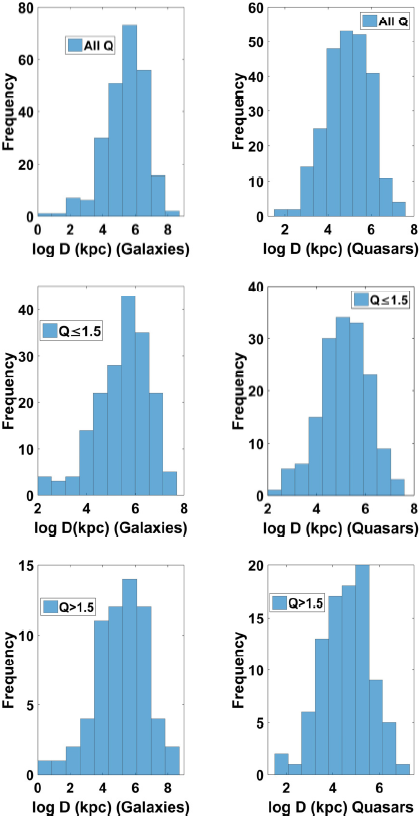
Fig 2 Distribution plots of
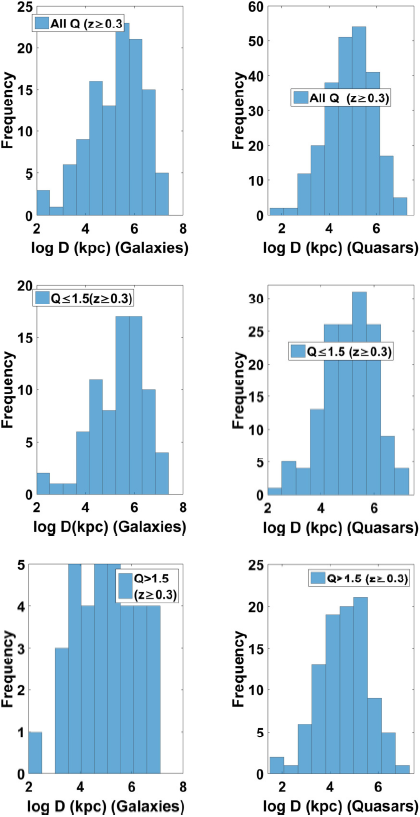
Fig 3 Distribution plots of
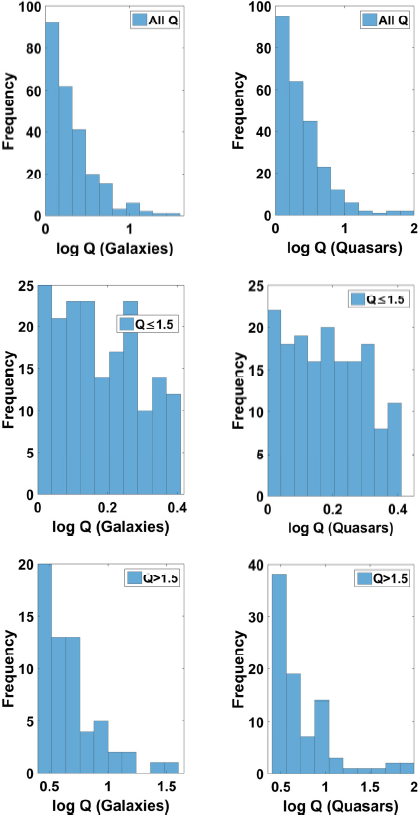
Fig. 4 Distribution plots of Q for galaxies and quasars for all Q (Top Panel),
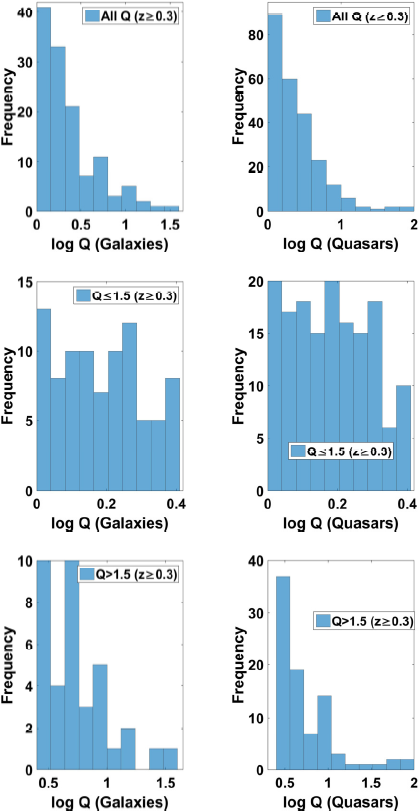
Fig. 5 Distribution plots of Q for galaxies and quasars for all Q (Top Panel),
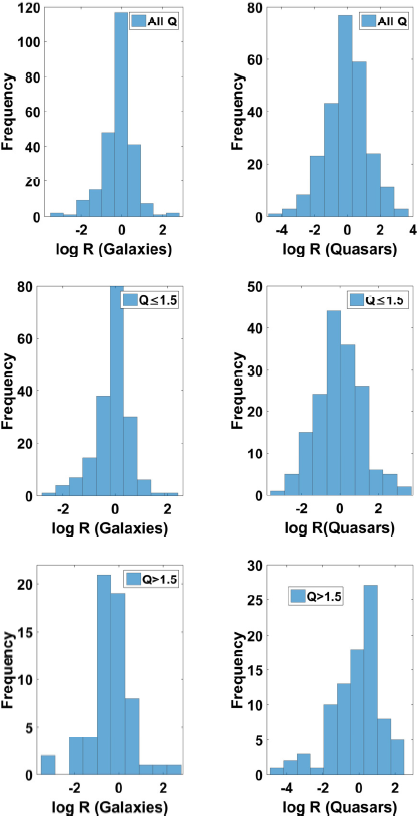
Fig. 6 Distribution plots of R for galaxies and quasars for all Q (Top Panel),
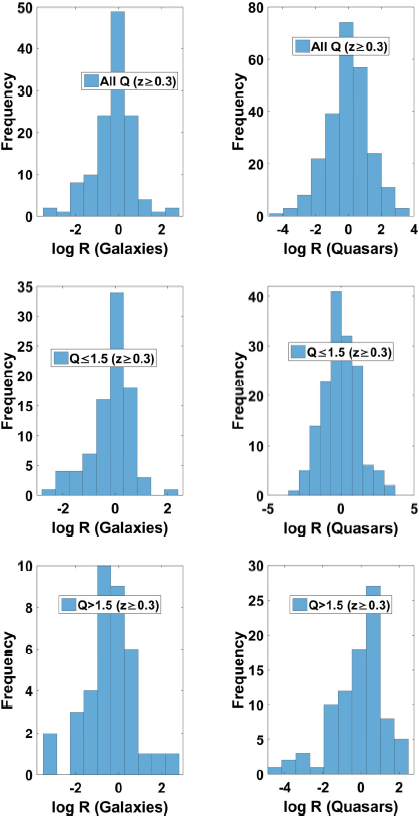
Fig. 7 Distribution plots of R for galaxies and quasars for all Q (Top Panel),
At z > 0.3, there is a noticeable difference in the distribution of the linear sizes of galaxies and quasars (shown in Figure 3), which seems to increase with increasing Q. For quasars at all Q (Q ≤ 1.5 and Q > 1.5 combined) sample, the D distribution approximates lognormal; but for the galaxies, for Q > 1.5 subsample, the projected linear size distribution seems constant from above 100 kpc to more than 1000 kpc. The remarkable differences in the distribution of D for Q > 1.5; z > 0.3 between galaxies and quasars may be due to selection and beaming effects. At large z, it is expected that only relatively large sized galaxies of higher luminosity will be easily observable (the median luminosity of galaxies for Q > 1.5, z ≥ 0.3 is a factor of 7 higher than that of Q > 1.5, z < 0.3). The median redshift for Q > 1.5; z > 0.3 is: for quasars (z
median ≈ 1.0) and for galaxies (z
median ≈ 0.7). Environmental differences, if present in the host galaxies, may be responsible for this observed difference, since the density of the universe scales as
Figure 4 shows the distribution plots of Q for the whole sample and the z-subsample. The distributions appear similar for quasars and galaxies for all the different Q-subsamples (right skewed for Q > 1.5 and for all Q subsamples but seem to have a constant distribution for the subsample 1 ≤ Q ≤ 1.5). For the z > 0.3 subsample, (see Figure 5), the Q distributions for the quasar and galaxy subclasses are similar as is the case for the all −z sample. In Figures 6 and 7 we display the distribution plots of lobe-luminosity ratio, R, for radio-loud quasars and FR-II radio galaxies for the whole samples and various z and Q subsamples. The distributions appear lognormal for both classes of object. These distributions show that the observed asymmetries must have been caused by a number of independent factors (relativistic beaming, selection effects, environmental effects, etc.).
In Figures 8 and 9 we show the D − Q/R data for the different z and Q subsamples. The results of the one-dimensional regression analyses of the plots are shown in Table 3. Equations (2) and (3) imply that if
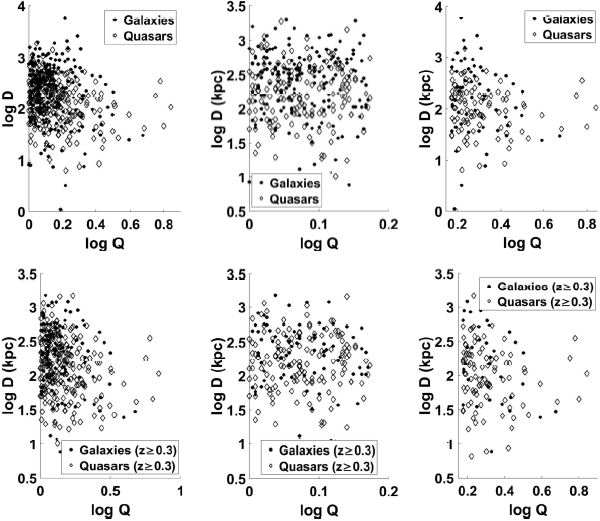
Fig. 8 log − log plots of D against Q for galaxies and quasars for all Q (Right),

Fig. 9 log − log plots of D against R for galaxies and quasars for all Q (Right),
Table 3 Correlation coefficient results for D − Q/R.*
| Gs | Qs | Gs | Qs | ||
| R (All) | D/Q | D/Q | D/R | D/R | |
| z(All) | Q(All) | −0.2 | −0.2 | 0.1 | −0.1 |
| z(All) | Q ≤ 1.5 | 0.0 | 0.0 | 0.1 | −0.2 |
| z(All) | Q > 1.5 | −0.2 | −0.1 | 0.1 | 0.0 |
| z ≥ 0.3 | Q(All) | −0.3 | −0.2 | 0.2 | −0.1 |
| z ≥ 0.3 | Q ≤ 1.5 | −0.2 | 0.0 | 0.2 | −0.2 |
| z ≥ 0.3 | Q > 1.5 | −0.4 | −0.1 | 0.3 | 0.1 |
| R > 1.0 | |||||
| z(All) | Q(All) | −0.2 | −0.2 | 0.1 | −0.3 |
| z(All) | Q ≤ 1.5 | −0.2 | −0.1 | 0.1 | −0.5 |
| z(All) | Q > 1.5 | −0.3 | 0.0 | 0.2 | 0.1 |
| z ≥ 0.3 | Q(All) | −0.4 | −0.2 | 0.0 | −0.3 |
| z ≥ 0.3 | Q ≤ 1.5 | −0.5 | −0.1 | −0.2 | −0.5 |
| z ≥ 0.3 | Q > 1.5 | −0.1 | 0.0 | 0.5 | 0.1 |
| R ≤ 1.0 | |||||
| z(All) | Q(All) | −0.1 | −0.3 | 0.2 | 0.2 |
| z(All) | Q ≤ 1.5 | 0.1 | 0.1 | 0.2 | 0.1 |
| z(All) | Q > 1.5 | −0.2 | −0.2 | 0.1 | 0.1 |
| z ≥ 0.3 | Q(All) | −0.2 | −0.3 | 0.2 | 0.2 |
| z ≥ 0.3 | Q ≤ 1.5 | 0.1 | 0.1 | 0.1 | 0.1 |
| z ≥ 0.3 | Q > 1.5 | −0.5 | −0.2 | 0.4 | 0.1 |
* Relations for different redshift and Q subsamples for radio-loud quasars and FR-II radio galaxies.
Table 4 Average values of D, Q, and R.*
| D | D | Q | Q | R | R | ||
| Galaxy | Mean | R ≤ 1.0 | R > 1.0 | R ≤ 1.0 | R > 1.0 | R ≤ 1.0 | R > 1.0 |
| z(all) | QAll | 399.5 | 398.7 | 1.5 | 1.3 | 0.6 | 1.8 |
| z(all) | Q ≤ 1.5 | 359.8 | 406.6 | 1.2 | 1.2 | 0.7 | 1.7 |
| z(all) | Q > 1.5 | 488.1 | 364.9 | 2.1 | 1.9 | 0.5 | 2.5 |
| z ≥ 0.3 | QAll | 268.6 | 346.0 | 1.6 | 1.4 | 0.5 | 2.1 |
| z ≥ 0.3 | Q ≤ 1.5 | 251.1 | 400.0 | 1.2 | 1.2 | 0.6 | 1.8 |
| z ≥ 0.3 | Q > 1.5 | 300.3 | 188.3 | 2.3 | 2.0 | 0.5 | 3.0 |
| Quasar | Mean | ||||||
| z(all) | QAll | 229.3 | 216.8 | 1.6 | 1.6 | 0.5 | 3.5 |
| z(all) | Q ≤ 1.5 | 251.6 | 270.6 | 1.2 | 1.2 | 0.5 | 4.0 |
| z(all) | Q > 1.5 | 187.3 | 135.2 | 2.2 | 2.2 | 0.4 | 2.7 |
| z ≥ 0.3 | QAll | 221.2 | 194.1 | 1.6 | 1.6 | 0.5 | 3.5 |
| z ≥ 0.3 | Q ≤ 1.5 | 240.2 | 235.0 | 1.2 | 1.2 | 0.5 | 4.1 |
| z ≥ 0.3 | Q > 1.5 | 186.8 | 135.2 | 2.2 | 2.2 | 0.4 | 2.7 |
| Galaxy | Median | ||||||
| z(all) | QAll | 255.0 | 276.0 | 1.3 | 1.2 | 0.7 | 1.3 |
| z(all) | Q ≤ 1.5 | 282.4 | 312.0 | 1.2 | 1.1 | 0.7 | 1.3 |
| z(all) | Q > 1.5 | 228.6 | 151.9 | 1.9 | 1.8 | 0.6 | 1.4 |
| z ≥ 0.3 | QAll | 189.7 | 256.4 | 1.3 | 1.2 | 0.6 | 1.4 |
| z ≥ 0.3 | Q ≤ 1.5 | 178.5 | 327.0 | 1.2 | 1.2 | 0.6 | 1.4 |
| z ≥ 0.3 | Q > 1.5 | 228.6 | 149.7 | 2.0 | 2.1 | 0.6 | 1.4 |
| Quasar | Median | ||||||
| z(all) | QAll | 168.5 | 131.2 | 1.3 | 1.3 | 0.4 | 2.0 |
| z(all) | Q ≤ 1.5 | 196.9 | 157.5 | 1.2 | 1.2 | 0.5 | 2.2 |
| z(all) | Q > 1.5 | 153.8 | 93.7 | 1.8 | 1.9 | 0.3 | 1.9 |
| z ≥ 0.3 | QAll | 164.7 | 128.3 | 1.3 | 1.3 | 0.4 | 2.0 |
| z ≥ 0.3 | Q ≤ 1.5 | 182.5 | 153.4 | 1.2 | 1.2 | 0.5 | 2.3 |
| z ≥ 0.3 | Q > 1.5 | 130.2 | 93.7 | 1.8 | 1.9 | 0.4 | 1.9 |
* For different redshift, Q and R subsamples for radio-loud quasars, and FR-II radio galaxies.
Table 5 Ratio D G /D Q , Q G /Q Q and R G /R Q .*
| D G /D Q | D G /D Q | Q G /Q Q | Q G /Q Q | R G /R Q | R G /R Q | ||
| R ≤ 1.0 | R > 1.0 | R ≤ 1.0 | R > 1.0 | R ≤ 1.0 | R > 1.0 | ||
| Median | |||||||
| z(all) | Q(All) | 1.5 | 2.1 | 1.0 | 0.9 | 1.5 | 0.7 |
| z(all) | Q ≤ 1.5 | 1.4 | 2.0 | 1.0 | 1.0 | 1.6 | 0.6 |
| z(all) | Q > 1.5 | 1.5 | 1.6 | 1.1 | 0.9 | 1.6 | 0.7 |
| z ≥ 0.3 | Q(All) | 1.2 | 2.0 | 1.0 | 0.9 | 1.3 | 0.7 |
| z ≥ 0.3 | Q ≤ 1.5 | 1.0 | 2.1 | 1.0 | 1.0 | 1.3 | 0.6 |
| z ≥ 0.3 | Q > 1.5 | 1.8 | 1.6 | 1.1 | 1.1 | 1.5 | 0.7 |
| Mean | |||||||
| z(all) | Q(All) | 1.7 | 1.8 | 0.9 | 0.8 | 1.3 | 0.5 |
| z(all) | Q ≤ 1.5 | 1.4 | 1.5 | 1.0 | 1.0 | 1.4 | 0.4 |
| z(all) | Q > 1.5 | 1.6 | 1.7 | 0.9 | 0.9 | 1.3 | 0.9 |
| z ≥ 0.3 | Q(All) | 1.2 | 1.8 | 1.0 | 0.9 | 1.2 | 0.6 |
| z ≥ 0.3 | Q ≤ 1.5 | 1.0 | 1.7 | 1.0 | 1.0 | 1.2 | 0.4 |
| z ≥ 0.3 | Q > 1.5 | 1.6 | 1.4 | 1.0 | 0.9 | 1.1 | 0.8 |
* For different redshift and Q subsamples using the average (mean and median) values.
Table 6 Correlation coefficient results for D − Q/R relations.*
| Mean | D/Q | D/Q | D/R | D/R | |
| z | Q | r | r | ||
| z(All) | Gs(ALL Q) | −0.8 | D ∝ Q−9.3±0.3 | 0.4 | D ∝ R1.7±0.5 |
| z(All) | Qs(ALL Q) | −0.9 | D ∝ Q−8.6±0.2 | −0.9 | D ∝ R−2.4±0.2 |
| z(All) | Gs(Q ≤ 1.5) | −0.2 | D ∝ Q−5.9±0.5 | 0.2 | D ∝ R0.8±0.5 |
| z(All) | Qs(Q ≤ 1.5) | −0.1 | D ∝ Q−2.0±0.5 | −0.8 | D ∝ R−1.4±0.3 |
| z(All) | Gs(Q > 1.5) | −0.7 | D ∝ Q−9.1±0.5 | 0.2 | D ∝ R0.5±0.7 |
| z(All) | Qs(Q > 1.5) | −0.5 | D ∝ Q−4.6±0.4 | 0.2 | D ∝ R0.4±0.5 |
| z ≥ 0.3 | Gs(ALL Q) | −0.9 | D ∝ Q−6.9±0.3 | 0.5 | D ∝ R1.5±0.4 |
| z ≥ 0.3 | Qs(ALL Q) | −0.7 | D ∝ Q−5.8±0.3 | −0.8 | D ∝ R−2.1±0.3 |
| z ≥ 0.3 | Gs(Q ≤ 1.5) | −0.4 | D ∝ Q−8.6±0.4 | 0.2 | D ∝ R0.6±0.5 |
| z ≥ 0.3 | Qs(Q ≤ 1.5) | 0.0 | D ∝ Q−0.5±0.4 | −0.8 | D ∝ R−1.2±0.3 |
| z ≥ 0.3 | Gs(Q > 1.5) | −0.6 | D ∝ Q−3.6±0.4 | 0.4 | D ∝ R0.8±0.5 |
| z ≥ 0.3 | Qs(Q > 1.5) | −0.3 | D ∝ Q−2.5±0.5 | 0.3 | D ∝ R0.9±0.5 |
| Median | D/Q | D/Q | D/R | D/R | |
| z | Q | r | r | ||
| z(All) | Gs(ALL Q) | −0.5 | D ∝ Q−9.5±0.5 | 0.4 | D ∝ R4.4±0.5 |
| z(All) | Qs(ALL Q) | −0.8 | D ∝ Q−10.8±0.3 | −0.6 | D ∝ R−2.2±0.4 |
| z(All) | Gs(Q ≤ 1.5) | −0.4 | D ∝ Q−8.4±0.4 | 0.2 | D ∝ R1.8±0.5 |
| z(All) | Qs(Q ≤ 1.5) | −0.1 | D ∝ Q−2.5±0.4 | −0.5 | D ∝ R−1.5±0.4 |
| z(All) | Gs(Q > 1.5) | −0.6 | D ∝ Q−9.7±0.5 | 0.2 | D ∝ R0.7±0.7 |
| z(All) | Qs(Q > 1.5) | −0.3 | D ∝ Q−3.8±0.4 | −0.2 | D ∝ R−0.4±0.5 |
| z ≥ 0.3 | Gs(ALL Q) | −0.7 | D ∝ Q−6.4±0.4 | 0.8 | D ∝ R3.7±0.3 |
| z ≥ 0.3 | Qs(ALL Q) | −0.9 | D ∝ Q−10.5±0.2 | −0.5 | D ∝ R−1.9±0.4 |
| z ≥ 0.3 | Gs(Q ≤ 1.5) | −0.5 | D ∝ Q−7.4±0.4 | 0.4 | D ∝ R1.5±0.4 |
| z ≥ 0.3 | Qs(Q ≤ 1.5) | 0.0 | D ∝ Q0.6±0.4 | −0.2 | D ∝ R−0.5±0.4 |
| z ≥ 0.3 | Gs(Q > 1.5) | −0.6 | D ∝ Q−3.6±0.4 | 0.4 | D ∝ R0.7±0.5 |
| z ≥ 0.3 | Qs(Q > 1.5) | −0.4 | D ∝ Q−4.4±0.4 | −0.2 | D ∝ R−0.4±0.4 |
* For different redshift and Q subsamples for radio-loud quasars and FR-II radio galaxies.
Analyses based on R > 1.0 follow the same trend as that of the sample where all the R values were used but with a slight improvement in the strength of the correlation, especially for the quasar subsample with
Table 4 indicates that linear sizes of FR-II radio galaxies depend on both Q and R; being larger for less asymmetric sources
Note that for the comparison we used the ratio obtained from the median value data due to the wide dispersion of the D-values.
It should be noted that the original sample is quite heterogeneous, and contains both lobe- and core- dominated quasars (which may also exhibit different types of D/R & D/Q relations) and covers a wide range of redshifts
We divided each subsample into 10 (this choice is arbitrary, though motivated by the fact that the histogram plots were arranged into 10 bins). We evaluated the averages (mean and median) of each bin, which we used in the regression analysis shown in Table 6. In the power-law fitted to the D − Q/D − R relations, we have assumed that the power-law index is an indication of the strength of the relation, while the associated error indicates the level of scatter.
The D − Q relation using the mean and the median values of the binned samples indicates a strong anti-correlation for both quasar and galaxy subclasses, except for the quasar subsample with
The D−R correlation is mildly strong and inverse for quasars, decreasing with increasing Q, while it is mild and direct for galaxies, and seems not to vary with Q. The fairly strong inverse D − R correlation for quasars supports the beaming hypotheses while the observed direct D − R correlation for galaxies suggests other factors at play in the evolution of this class of radio sources.
4. Conclusion
We have compared the radio size (D) and radio asymmetry parameters Q/R relations based on the pure orientation and relativistic beaming unification scheme for FR-II radio galaxies and radio loud quasars. Using the median values, our results in general indicate that the projected linear sizes of the radio sources are smaller at higher redshift and at larger Q values, with the linear size of quasars generally smaller than those of galaxies across all Q, z and R bins. Moreover, the linear sizes of galaxies seem smaller at lower values of Q if
On the assumption that as
According to the orientation and unification scheme, the Q/R analysis should indicate a stronger beaming effect in quasars than in galaxies. We note that in the sample we have used no effort was made originally to identify the “approaching” and “receding” side (Nilsoon 1988). The longer side was assumed to be the “approaching” side. Thus, a simple Q/R analysis from this sample will give an inconclusive result. This is because, for most of the sources, to assume the longer side as the approaching side may be incorrect. Moreover, environmental factors (Onuchukwu 2017) that may shorten a side can also brighten the side, creating an anti-correlation in Q/R relation, but a more positive correlation in the D/R relation.
The authors acknowledge the ASN (Astronomical Society of Nigeria) for providing the platform for exchanging ideas with colleagues and the contribution of the anonymous referee to improve this work.

