


 nueva página del texto (beta)
 Inglés (pdf)
 Artículo en XML
 Referencias del artículo
 Enviar artículo por email
 Citado por SciELO
  Similares en
SciELO
Similares en
SciELO 
 Permalink
1. Introduction
The creation of a stellar evolutionary scheme requires a knowledge of the fundamental parameters of stars in different stages of their evolution. Eclipsing binary systems, especially the W Ursae Majoris type, are among the most important sources of such information (Kjurkchieva et al. 2017).
W UMa systems have orbital periods, typically, between 0.2 days and 0.8 days and consist of two dwarf stars with spectral types ranging from A to K sharing a common convective envelope resulting in a near equalization of the surface temperature with differences of no more than a few percent (Christopoulou et al. 2011).
Light curves of W UMa stars show continuous changes in brightness with nearly equal depth minima and maxima that are not always symmetric. This difference in maximum light levels, sometimes referred to as the O’Connell effect (O’Connell 1951), is caused by the inhomogeneity in the surface brightness distribution of one or both stars, commonly associated with dark or hot spots. The difference between the maxima can change from orbit to orbit because of the motion and evolution of these active regions. This phenomenon may indicate the presence of an activity cycle similar to that of the Sun (Mitnyan et al. 2018).
According to our modern understanding, these systems are most likely formed from the moderately close binaries (Chen et al. 2016) through either nuclear evolution of the most massive component in the detached phase or angular momentum evolution of the two component stars within a convective envelope (Hilditch et al. 1988; Tutukov et al. 2004; Yildiz & Doğan 2013).
V1009 Per (GSC 2344-00092, NSVS 6662264, α2000 = 03h16m49s.62, δ2000 = +33°30′ 14′′ .1) was first reported by Kuruslov (2011) as a short-period contact eclipsing binary candidate with an orbital period of about 0.23414 days. The published light curve presented the typical EW-type behavior. However, the data of its light curve are scattered to some extent, and it is not clear that the light curve shows the O’Connell effect or argues about the features of the light curve at the time of the observations. We found the O’Connell effect in our observed light curves and adopted a bright spot model to interpret it.
CRTS J031642.2+332639 (hereinafter J031642, α2000 = 03h16m42s.23, δ2000 = +33°26′ 39′′ .0) is listed as a variable star with a period of 0.3009380 days, in the Catalina Surveys Periodic Variable Star Catalog (Drake et al. 2014). This object also shows the typical behavior of W UMa type systems.
Since no photometric or spectroscopic studies are found in the literature, the aim of the present study is to analyze our B, V, R C and I C light curves to obtain the first orbital and fundamental parameters of these eclipsing binaries.
2. Observations
Photometric observations were carried out at the San Pedro Martir Observatory, on December 16, 2017 and January 18, 2018, with the 0.84-m telescope, a filter-wheel and the Spectral Instruments 1 CCD detector (a deep depletion e2v CCD42-40 chip with a gain of 1.39 e−/ADU and a readout noise of 3.54 e−). The field of view was 7.6′ × 7.6′ and a binning of 2×2 was used during all the observations. Alternated exposures were taken in filters B, V, R C and I C with exposure times of 40, 25, 15 and 15 seconds respectively. A total of 371 target images were acquired during the first night covering an interval of 5.7 hours while 414 images were acquired during the second night over 6.3 hours. Flat field and bias frames were taken during both observing runs.
All images were processed using IRAF3 routines. Images were bias subtracted and flat field corrected before the instrumental magnitudes of the marked stars in Figure 1 were computed with the standard aperture photometry method. This field was also calibrated in the U BV (RI) C system and the results, along with the 2MASS magnitudes, are presented in Table 1. Based on this information, we decided to use Object #3 as comparison star since it has a magnitude and color similar to both V1009 Per and J031642, making differential extinction corrections negligible. Objects #4, #5 and #6 were used as check stars to confirm that the comparison star is not variable. All data can be provided by the first author upon request.
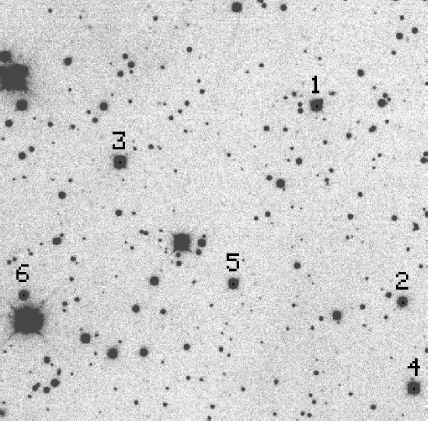
Fig. 1 Observed field. This finding chart was generated by aligning and adding all the images acquired during the second night of observation. The calibrated U BV (RI) C magnitudes of the marked stars can be found in Table 1.
Table 1 U BV (RI)C and 2mass magnitudes of the field stars. Ids as in Figure 1
| ID | Name | RA (2000) | DEC (2000) | U | B | V | R C | I C | J | H | K S |
| 1 | V1009 Per | 49.206375 | 33.504269 | 15.938 | 15.406 | 14.351 | 13.716 | 13.112 | 12.307 | 11.734 | 11.619 |
| 2 | CRTS J031642.2+332639 | 49.175527 | 33.444546 | 16.397 | 16.002 | 15.046 | 14.437 | 13.920 | 13.207 | 12.737 | 12.599 |
| 3 | LAM260516231 | 49.278550 | 33.487820 | 15.482 | 15.071 | 14.109 | 13.567 | 13.042 | 12.228 | 11.779 | 11.681 |
| 4 | LAM260516226 | 49.171755 | 33.418138 | 15.461 | 15.157 | 14.227 | 13.698 | 13.205 | 12.452 | 12.061 | 11.935 |
| 5 | 2MASSJ03165701+3327025 | 49.237512 | 33.450702 | 16.434 | 15.955 | 14.987 | 14.458 | 13.988 | 13.186 | 12.837 | 12.680 |
| 6 | 2MASSJ03171542+3326522 | 49.314234 | 33.447899 | 16.961 | 16.525 | 15.523 | 14.927 | 14.401 | 13.602 | 13.131 | 13.012 |
3. Light elements and orbital period variations of V1009 Per
The measured times of minimum (ToM) of J031642, determined by the polynomial fits, are presented in Table 2. These new data permit us to refine the orbital period as:
Table 2 CCD (BVRI) times of minima of J031642
| HJD | Epoch | O-C |
| 2458102.665 | -114 | 0 |
| 2458136.671 | -0.5 | -0.0005 |
| 2458136.822 | 0 | 0.0005 |
Based on a careful search for all available eclipsing times of V1009 Per, we collected a total of 16 ToM that, with the new four ToM observed by us (Table 3), permit the revision of the ephemeris and the construction of the O-C diagram depicted in Figure 2.
Table 3 CCD (BVRI) times of minima of V1009 Per
| Band | HJD | Epoch | O-C | Source |
| Rotse | 2451491.536 | 0 | -0.0143 | Kuruslov (2011) |
| Rotse | 2451491.653 | 0.5 | -0.014 | NSVS |
| SWASP | 2453250.281 | 7511.5 | 0.0111 | SWASP |
| SWASP | 2453250.397 | 7512 | 0.0109 | SWASP |
| SWASP | 2454045.87 | 10909.5 | 0.0031 | SWASP |
| SWASP | 2454045.988 | 10910 | 0.0045 | SWASP |
| SWASP | 2454320.981 | 12084.5 | 0.0039 | SWASP |
| SWASP | 2454321.098 | 12085 | 0.0037 | SWASP |
| CCD | 2455846.852 | 18601.5 | 0.0043 | Diethelm (2012) |
| CCD | 2455846.968 | 18602 | 0.0031 | Diethelm (2012) |
| CCD(V) | 2456227.909 | 20229 | 0.0034 | Diethelm (2013) |
| CCD | 2457387.23 | 25180.5 | -0.0037 | Nosal P. |
| BVRI | 2458102.635 | 28236 | -0.0038 | This paper |
| BVRI | 2458102.752 | 28236.5 | -0.0046 | This paper |
| BVRI | 2458136.702 | 28381.5 | -0.0039 | This paper |
| BVRI | 2458136.819 | 28382 | -0.0037 | This paper |
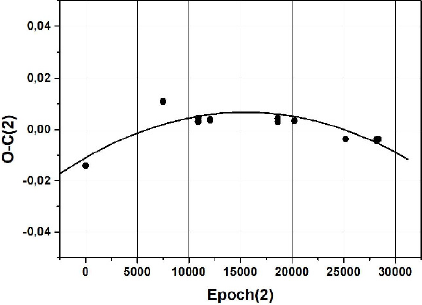
Fig. 2 O-C diagram of V1009 Per. The solid curve shows the second-order polynomial fit to the data points as given by equation 2.
Applying the ephemeris of equation 2 to those minima, we notice that the trend of the residual has a parabolic shape as shown in Figure 2. A second order polynomial ephemeris, fitting all the minima, gives:
whose residual behavior is shown in Figure 3.
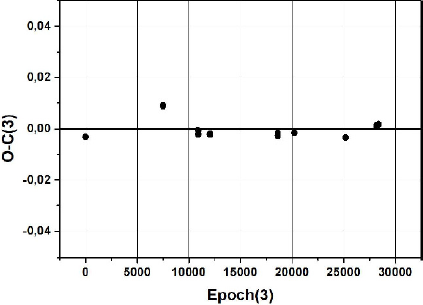
Fig. 3 O-C diagram of V1009 Per. The solid curve shows the second-order polynomial fit to the data points as given by equation 3.
Since the temporal distribution of the O-C values is rather small (covering only 18 years, spanning nearly 28,400 orbits), the downward parabolic change shown in Figure 2 may be only a part of a long-period cyclic oscillation that may be caused be the presence of a third body. To confirm this conclusion more times of light minimum are required.
From the quadratic term of equation (3), it follows that the orbital period may be decreasing at a rate of
According to the formula given by Bradstreet & Guinan (1994):
The timescale of the conservative mass transfer (i.e. the dynamical timescale) can be estimated to be approximately τ dy= 5.35×10⁶ yrs and 4.59×10⁶ yrs for the non-conservative mass transfer.
On the other hand, the thermal timescale of the massive component can be estimated as
4. Photometric analysis using the WD code
There are no reported spectroscopic mass ratios for these systems. In order to derive reliable geometric and astrophysical elements, the present observations were analyzed simultaneously using the 2003 (October 2005 revision) version of the Wilson- Devinney (WD) program (Wilson & Devinney 1971; Wilson 1990; Wilson 1994; Wilson & van Hamme 2004).
We applied the q-search method to find the best initial value to be used for q during the light curve analysis.
From Figure 4 left, it is clearly seen that the light curves of V1009 Per present a flatter bottom secondary eclipse covering approximately 0.07 in phase; this possibly indicates a total eclipse configuration of the system.
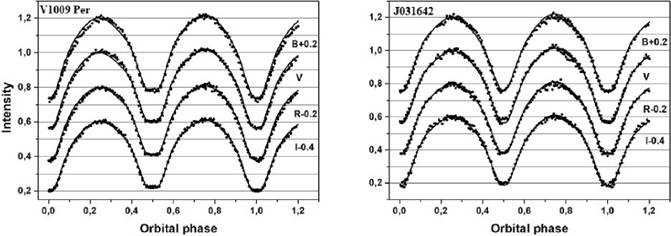
Fig. 4 CCD B, V, R and I light curves of V1009 Per (left) and J031642 (right). Points are the original observations and lines the theoretical light curves with the spot contribution.
We used the NASA IPAC database (NASA 2015), interstellar extinction and reddening calculator to compute the E(B − V) value for both the systems which, due to the low galactic latitude (−20◦), could be significant.
We have checked the consistency of our determined (B−V)0 values using the period-color relation discovered by Eggen and revised by Wang (1994) as (B − V)0 = 0.062 − 1.310 logP (days). The results are the following:
For V1009 Per; NASA’s calculator gives a value of (B − V)0 = 0.830, i.e. T1 = 5280K, while Wang’s equation gives (B − V)0 = 0.736, i.e. T1 = 5140K (a difference of 140K). For CRTS J031642; NASA’s calculator gives (B − V)0 = 0.736, i.e. T1 = 5544K, while Wang’s equation gives (B − V)0 = 0.747, i.e. T1 = 5505K (a difference of 39K). The differences between the two values are smaller than the error bars. The (B − V) color values obtained from our observations were corrected with the relative E(B − V ) and the resulting values of (B −V)0 were adopted for the determination of the temperature of Star 1.
Following Lucy (1967), the gravity-darkening co-efficients of the two components were taken to be 0.32 and the bolometric albedo coefficients were set at 0.50 for stars with a convective envelope, (Ruciński 1973). Limb-darkening coefficients of the components were interpolated with a square root law from the van Hamme (1993) tables.
The shapes of the light curves of these systems are similar to the usual light curve shapes of the W UMa-type binary stars. This prompted us to start the W-D analysis directly in Mode 3. Mode 3 in the W-D Code is used for over-contact binaries (W UMa stars) in which the adjustable parameters used in the differential correction calculation are the orbital inclination, i, the mean surface effective temperature of the secondary component, T2, the dimensionless surface potentials of the two components,
Due to the common occurrence of third bodies in WUMa systems (Pribulla & Ruciński 2006), third light was included as an adjustable parameter. The results showed that the values for third light were negligible (smaller than the uncertainties). To search for a reliable mass ratio q, we made test solutions at the outset using the four light curves in BV R C I C colors simultaneously.
The test solutions were computed for a series of assumed mass ratios q, with the values from 0.2 to 4 in steps of 0.1 for both systems; the behavior of the sum of squares of residuals, Σ(res)2, was used to estimate their values. The relation between the resulting sum of weighted square deviations and q is plotted in Figure 5. A minimum value was obtained at q = 0.40 for V1009 Per and q = 2.5 for J031642. Therefore, we chose the above initial values for the mass ratios q and made them adjustable parameters. Then, we performed a differential correction until it converged and final solutions were derived (Table 4). It should be noted that the errors of the parameters given in this paper are the formal errors from the WD code and are known to be unrealistically small (Maceroni & Ruciński 1997). For a discussion see Barani et al. (2017).
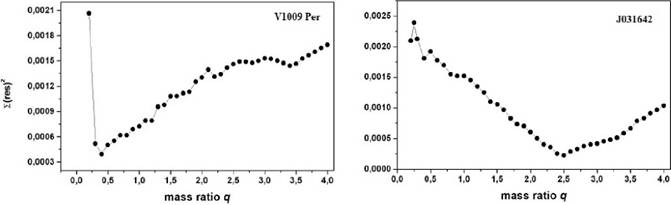
Fig. 5 The relation Σ(res)2 versus mass ratio Q in Mode 3 in the WD code for V1009 Per (left) and J031642 (right).
Table 4 Light curves solutions for V1009 Per and J032642.1
| V1009 Per | J032642 | |
| i | 85.971±0.145 | 83.245±0.148 |
| T1(K) | 5280* | 5544* |
| T2(K) | 5253±6 | 5416±6 |
| Ω1 = Ω2 | 2.534±0.004 | 5.872+0.009 |
| q = m2/m1 | 0.362±0.002 | 0.398±0.006 |
| A1 = A2 | 0.5* | 0.5* |
| g1 = g2 | 0.32* | 0.32* |
| L1B | 0.681±0.002 | 0.318±0.002 |
| L1V | 0.687±0.001 | 0.311±0.001 |
| L1R | 0.687±0.001 | 0.308±0.001 |
| L1I | 0.690±0.001 | 0.307±0.001 |
| L2B | 0.268±0.002 | 0.634±0.003 |
| L2V | 0.267±0.002 | 0.639±0.003 |
| L2R | 0.269±0.002 | 0.645±0.002 |
| L2I | 0.271±0.002 | 0.654±0.002 |
| f | 0.118±0.06 | 0.136±0.04 |
| X1B = X2B | 0.749* | 0.624* |
| X1V = X2V | 0.422* | 0.319* |
| X1R = X2R | 0.244* | 0.168* |
| X1I = X2I | 0.131* | 0.075* |
| L3 | 0 | 0 |
| r1(pole) | 0.453±0.001 | 0.289±0.001 |
| r1(side) | 0.488±0.001 | 0.302±0.001 |
| r1(back) | 0.591±0.001 | 0.339±0.002 |
| r2(pole) | 0.289±0.001 | 0.429±0.001 |
| r2(side) | 0.303±0.001 | 0.470±0.001 |
| r2(back) | 0.247±0.003 | 0.499±0.001 |
| lat spot (º) | 89±1.8 | 51±2 |
| long spot(º) | 310.1±3.1 | 270.4±2.7 |
| radius(º) | 24.8±0.92 | 25.4±0.88 |
| Temp fac.Spot | 1.055±0.017 | 1.03±0.02 |
| Star | 2 | 2 |
| Sum (res)2 | 0.00030 | 0.00022 |
1 Assumed parameters are marked with *.
The results of our analysis confirm that both the system are shallow contact binaries in good thermal contact. For systems exhibiting high inclination, the mass ratios can be inferred from purely geometric arguments even in the absence of complementary spectroscopic data (Terrell & Wilson 2005). As shown in Figure 4, the light curves of both systems display an inverse O’Connell effect (O’Connell 1951). The maximum at phase 0.25 (Max I) is slightly fainter than the one at phase 0.75 (Max II), see Table 5.
Table 5 Differences in the height of the maxima
| V1009 Per | J032642 | |
| Max II-Max I B | 0.008 | 0.011 |
| Max II-Max I V | 0.007 | 0.006 |
| Max II-Max I R | 0.016 | 0.008 |
| Max II-Max I I | 0.006 | 0.006 |
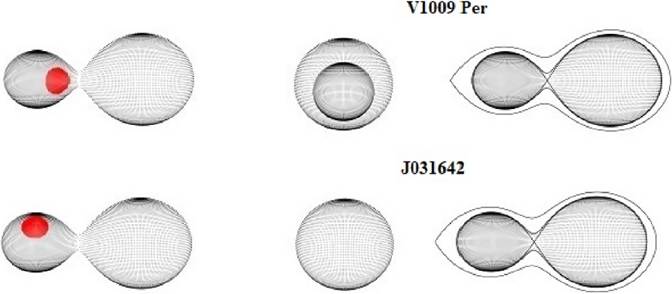
These features usually indicate wavelength-dependent hot spot activity (rather than a cool spots) on the surface of one component due to the probable impact from the mass transfer between the components. The final synthetic light curves calculated using the whole set of parameters of Table 4 are shown in Figure 4 as continuous lines. The observed and the theoretical light curves are in good agreement. A graphic representations and the Roche geometries of the systems is shown in Figure 6.
5. Evolutionary status of the systems and conclusions
Since at present there is no spectroscopic determination of the orbital elements available, the absolute parameters of the system cannot be determined directly. We use the 3D empirical laws of Gazeas (2009) where the physical parameters of contact binaries are closely correlated with the orbital period and mass ratio. Then with the mass ratio determined from the photometry, we can derive the individual masses and radii.
Luminosities were calculated using the Stefan-Boltzmann law. The physical parameters listed in Table 6 are used to investigate the current evolutionary status of both systems.
Table 6 Estimated absolute elements for V1009 Per and J031642
| V1009 Per | J032642 | |||
| Primary star | Secondary star | Primary star | Secondary star | |
| Mass ( |
0.874±0.001 | 0.317±0.007 | 1.037±0.010 | 0.414±0.030 |
| Radius ( |
0.865±0.003 | 0.474±0.003 | 1.002±0.009 | 0.661±0.014 |
| Luminosity ( |
0.521±0.004 | 0.153±0.002 | 0.770±0.010 | 0.370±0.020 |
| a ( |
1.694±0.006 | 2.133±0.029 | ||
Recently, Yildiz & Doğan (2013), developed a method for the computation of initial masses of contact binaries based on stellar modelling with mass loss. Their main assumption was that the mass transfer starts near or after the TAMS phase of the massive component (the progenitor of the secondary component). They found that binary systems with initial mass of the secondary, M
2i
, higher than
In Figure 7 we plot the components of V1009 Per and J031642 together with other W- and A-type W UMa systems collected by Yildiz & Doğan (2013) in the logarithmic mass-luminosity (M -L) relations along with the ZAMS and TAMS computed by Girardi et al. (2000). It is clear that both components of our systems follow the general pattern of the W-subtype systems and seem to be in good agreement with the well known W-type W UMa systems on the log M − log L plane.
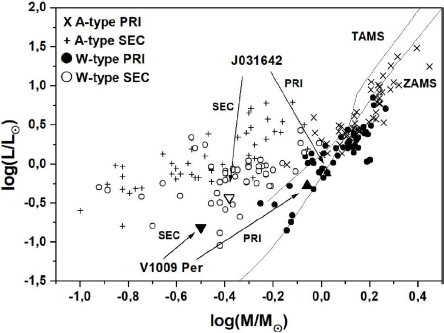
Fig. 7 Location of the components of V1009 Per and J031642 on the log M − log L diagram. The sample of W UMa type systems was obtained from a compilation of Yildiz & Doğan (2013) Zero Age Main Sequence (ZAMS) and Terminal Age Main Sequence (TAMS) are taken from Girardi et al. (2000) for the solar chemical composition.
The light curves of both systems exhibit the inverse O’Connell effect with the maximum at phase 0.25 (Max I) slightly fainter than that at phase 0.75 (Max II). For this reason a hot spot, indicating a probable impact from mass transfer between the components, was placed on the surface of the secondary component.
RM acknowledges financial support from UNAM under DGAPA grant PAPIIT IN 100918. This paper is based on observations acquired at the OAN-SPM, Baja California, Mexico. This research has made use of the International Variable Star Index (VSX) database, operated at AAVSO, Cambridge, Massachusetts, USA, of the VizieR catalogue access tool, CDS, Strasbourg, France. The original description of the VizieR service was published in A&AS 143, 23. We acknowledge our anonymous referee for comments that helped to improve this work.

