


 nueva página del texto (beta)
 Inglés (pdf)
 Artículo en XML
 Referencias del artículo
 Enviar artículo por email
 Citado por SciELO
  Similares en
SciELO
Similares en
SciELO 
 Permalink
1. Introduction
Dwarf novae are a sub-set of cataclysmic variables - binary systems hosting a white dwarf and a low-mass main sequence star. In these systems, the companion is transferring mass to the white dwarf via Roche-lobe overflow and an accretion disk is formed around it. Dwarf novae can undergo out-bursts, thought to occur due to thermal instabilities in the disk (see Lasota 2001, for details) resulting in a brightness increase of ≈6-100 times than its quiescence level (Osaki 1996). While these dwarf novae outbursts can be very homogeonous from a single source, occasionally they exhibit ‘superout-bursts’. These are different from normal outbursts as they are brighter and can last 5-10 times longer (≈15-40 days compared to ≈2-20 days in normal outbursts, the exact values depend on the type of system; Mauche et al. 2001).
MASTER OT 075353.88+174907.6 (hereafter OT 0753) was reported as a optical transient on 2017 October 31 (Balanutsa et al. 2017) by the MASTER-Net project (Kornilov et al. 2012). This transient had a B magnitude of 18.6 during the discovery observation. The Sloan Digital Sky Survey (SDSS) had previously observed the source position of OT 0753 and did not detect any source. The sensitivity limit of the SDSS in the g’ band (which is the closest one to the Johnson B band from the MASTER-Net project) is ≈23 mag. This indicates (see also Balanutsa et al. 2017) that during the MASTER-Net detection OT 0753 was
To investigate the nature of this source, we carried out a multiwavelength campaign across the near-infrared, optical, UV, and X-ray bands during its 2017 outburst. We discuss the results of our observing campaign and show that this blue optical transient is likely a superoutburst of a dwarf nova which hosts a hot white dwarf that dominates the emission in quiescence.
2. Observations and data analysis
We requested follow-up observations of OT 0753 using the Neil Gehrels Swift Observatory (Gehrels et al. 2004). We observed OT 0753 a total of 9 times using Swift (see Table 1 for a log of these observations). We obtained the first observation within a day of the initial report of the transient (see also Parikh & Wijnands 2017). This observation was carried out over all six optical and UV bands using the Ultraviolet and Optical Telescope (UVOT; Roming et al. 2005). Subsequent observations using the UVOT only observed the source in the three UV bands. Further UV and X-ray data of the source were obtained using Swift up to ≈1 month after the initial detection, until the source had approached its assumed quiescent level.
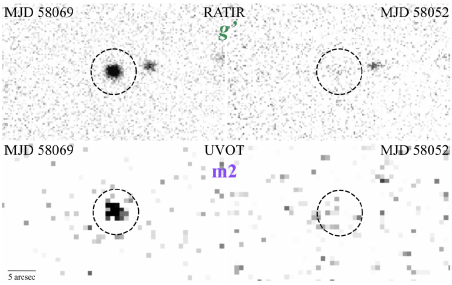
Fig. 1 The detection of OT 0753 (indicated by the dashed black circle) in outburst and its subsequent quiescence phase is shown. Top two panels: the RATIR images in the optical g’ band; bottom two panels: the Swift/UVOT images in the UV m2 band. The color figure can be viewed online.
Table 1 Log of observations of ot 0753 with swift/UVOT and RATIR.*
| Swift/UVOT | ||||||||||||||
| MJD | Observation ID |
Total exposure (s) |
Magnitude (AB) |
Flux (×10−17 erg s−1 cm−2 Å−1) |
||||||||||
| v | b | u | w1 | m2 | w2 | v | b | u | w1 | m2 | w2 | |||
| 58058.8 | 00010373001 | 988 | <18.36 | 19.1±0.2 | 19.2±0.1 | 19.3±0.1 | 19.3±0.1 | 19.5±0.1 | <16.8 | 13.4±2.7 | 19.5±2.4 | 43.0±2.1 | 43.0±2.1 | 42.1±3.0 |
| 58063.0 | 00010373002 | 1788 | - | - | - | - | 19.4±0.2 | 19.7±0.1 | - | - | - | - | 37.1±6.1 | 35.0±2.2 |
| 58068.7 | 00010373003 | 1982 | - | - | - | 20.1±0.2 | 19.9±0.2 | 20.2±0.2 | - | - | - | 14.6±2.1 | 23.5±3.3 | 21.4±2.9 |
| 58070.7 | 00010373004 | 951 | - | - | - | 20.5±0.2 | 21.1±0.3 | 20.7±0.2 | - | - | - | 10.4±1.9 | 8.4±2.3 | 13.7±2.5 |
| 58072.0 | 00010373005 | 1033 | - | - | - | 21.0±0.3 | <21.3 | <21.5 | - | - | - | 6.12±1.8 | <6.91 | <6.8 |
| 58075.0 | 00010373006 | 1627 | - | - | - | <21.3 | <21.3 | <21.6 | - | - | - | <4.93 | <6.71 | <6.1 |
| 58079.9 | 00010373008 | 946 | - | - | - | <21.6 | 21.7±0.4 | <22.0 | - | - | - | <3.81 | 4.5±1.5 | <4.3 |
| 58082.6 | 00010373009 | 1062 | - | - | - | <21.5 | <21.8 | <22.1 | - | - | - | <3.93 | <4.3 | <3.9 |
| 58090.5 | 00010373010 | 2948 | - | - | - | - | <22.5 | - | - | - | - | - | <2.2 | - |
| RATIR | ||||||||||||||
| MJD | Total exposure (s) |
Magnitude (AB) |
Flux (×10−18 erg s−1 cm−2 Å−1) |
|||||||||||
| g’ | i’ | z’ | g’ | i’ | z’ | |||||||||
| 58069.4 | 8580 | 20.1±0.1 | 20.2±0.02 | 20.2±0.1 | 42.2±1.8 | 15.8±0.49 | 10.8±0.8 | |||||||
| 58070.4 | 3480 | 20.4±0.1 | 20.3±0.1 | - | 33.7±2.2 | 14.9±1.1 | - | |||||||
| 58072.4 | 3900 | <22 | <21.62 | <21.2 | <7.6 | <4.2 | <4.3 | |||||||
| 58073.4 | 3000 | 22.4±0.1 | <22.6 | <21.9 | 5.2±0.5 | <1.7 | <2.3 | |||||||
| 58074.4 | 3000 | 23.0±0.2 | <22.5 | <21.7 | 3.0±0.5 | <1.9 | <2.7 | |||||||
| 58075.3 | 3000 | <22.5 | <22.4 | <21.6 | 4.8±0.0 | <2.1 | <3.0 | |||||||
| 58076.4 | 3000 | 22.5±0.2 | <22.6 | <21.8 | 4.8±0.6 | <1.7 | <2.5 | |||||||
| 58077.4 | 3000 | <22.6 | <22.5 | <22.2 | <4.4 | <1.9 | <1.7 | |||||||
| 58078.4 | 3000 | <22.4 | <21.9 | <21.5 | <5.3 | <3.3 | <3.3 | |||||||
| 58080.4 | 3000 | <22.7 | <22.5 | <21.6 | <4.0 | <1.9 | <3.0 | |||||||
| 58081.4 | 3000 | 23.0±0.2 | <22.7 | <22.2 | 2.9±0.5 | <1.6 | <1.7 | |||||||
| 58082.3 | 3000 | <23.0 | <22.6 | <22.7 | <3.0 | <1.7 | <1.1 | |||||||
| Summary of observations using other instruments | ||||||||||||||
| Instrument | MJD | Band | Magnitude | Flux (×10−18 erg s−1 cm−2 Å−1) |
||||||||||
| SDSS | - | g’ |
|
|
||||||||||
| GALEX | 53773.4 | NUV | 22.9±0.5 | 14.3±8.3 | ||||||||||
| GALEX | 53773.4 | FUV |
|
|
||||||||||
| Gaia | 58054.7 | G | ≈18.5 | ≈93.1 | ||||||||||
| Gaia | 58054.8 | G | ≈18.6 | ≈88.1 | ||||||||||
| MASTER-Net | 58057.2 | B | ≈18.6 | ≈14.8 | ||||||||||
* The log of the observations of OT 0753 of our Swift/UVOT and RATIR observing campaign is tabulated. The outburst observations obtained by Gaia and the MASTER-Net project and the archival quiescent observations using SDSS and GALEX are also shown. All the errors are presented for the 1σ confidence level and all magnitudes correspond to the AB system.
We analysed all the Swift/UVOT data using the Level 2 products. We added all the individual exposures (in the same band) of a given observation using uvotimsum. We selected a circular source extraction region having a radius of 5 arcsec. The background used was a circular region having a radius of 10 arcsec, placed on a source-free location on the CCD. The source magnitude and flux were extracted using the uvotsource tool. The results of this analysis is shown in Table 1.
The source was not detected in X-rays through-out our observing campaign. The upper limits on the source count rate (in the 0.5-10 keV energy range) during the individual observations taken with the X-ray Telescope (XRT; Burrows et al. 2005) observations were
The optical and near-infrared follow-up was carried out by a ground-based campaign using the 1.5 m RATIR (Reionization and Transients InfraRed) telescope located at the Mexican Observatorio Astronómico Nacional (OAN) on the Sierra San Pedro Mártir (SPM) in Baja California (Watson et al. 2012). This campaign lasted from 2017 November 12 to 2017 November 25 and included 12 nights of observations with exposure times ranging from ≈0.8-2.4 hours per night (see Table 1 for a log of the RATIR observations). On each night, the source was observed using the SDSS g’, i’, and z’ bands. We analysed the RATIR data using the PYTHON package PhotoPipe4. This pipeline automatically reduced all the data, carrying out the following processing steps: (1) calibrating the images using the bias, dark, and flat fields, (2) performing astrometry, and (3) co-adding the data and performing absolute photometry. For both the RATIR as well as the UVOT results, all errors are given for the 1σ confidence level and all magnitudes correspond to the AB system. The light curve constructed using these data is shown in Figure 2.
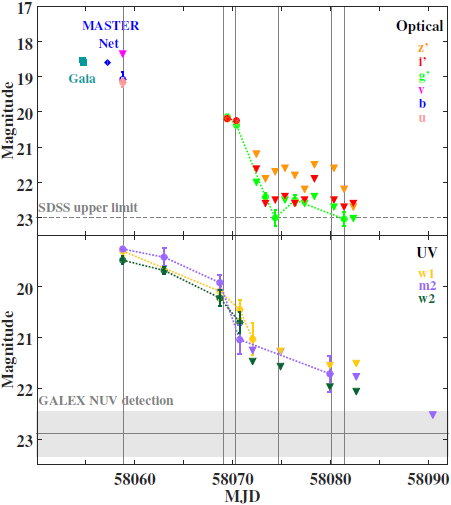
Fig. 2 The evolution of OT 0753 across the various optical/near-infrared (upper panel) and UV bands (lower panel) is shown. The upper panel also shows the detection of OT 0753 as reported by the Gaia Photometric Alert (blue-green squares) and the MASTER-Net project (blue diamond; Balanutsa et al. 2017). The SDSS detection limit is shown in the upper panel and the GALEX/NUV detection level (along with its error bar as indicated by the grey band) is shown in the lower panel. All magnitudes correspond to the AB system. The grey vertical dashed lines indicate the times for which we have constructed the SEDs shown in Figure 3. The color figure can be viewed online.
3. Results
The first notice of the outburst of OT 0753 was published by the MASTER-Net Project on 2017 October 31 (in the B band, indicated by the blue diamond in the upper panel of Figure 2; Balanutsa et al. 2017). The rise to outburst of OT 0753 was not detected and the exact day on which the out-burst began is not known. We examined the Gaia alerts5 and found that it was detected by Gaia on 2017 October 28 (≈3 days before the reported detection from the MASTER-Net project; the source was observed twice using the Gaia G broadband filter, indicated by the blue-green squares in the upper panel of Figure 2). However, this information was not immediately publicly available and could only be retrospectively obtained. We examined the pre-outburst GALEX and SDSS data for this source. We assumed that the archival GALEX data (detected in the NUV and not detected in the FUV) and the non-detection by the SDSS are representative of our system in (pre-outburst) quiescence (see also Balanutsa et al. 2017). These data are summarized in Table 1. We estimated the upper limit of the source magnitude in the GALEX/FUV band using the known sensitivity versus exposure time relation6.
The RATIR and Swift/UVOT light curves are shown in Figure 2. The outburst displayed a slowly decaying phase that lasted
We constructed several spectral energy distributions (SEDs; see Figure 3) of OT 0753 to understand the broadband evolution of the source during its outburst. The (quasi-)simultaneous SEDs were constructed at the times indicated by the vertical dotted grey lines in Figure 2. We calculated the spectral indices (Γ) corresponding to these SEDs using the relation
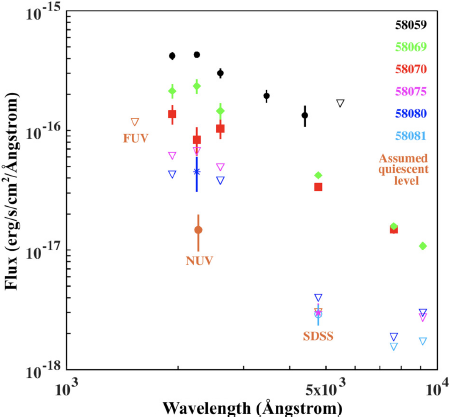
Fig. 3 The SED evolution of OT 0753 at various times is shown. The vertical dotted grey lines in Figure 2 indicate the times for which these SEDs were constructed. The assumed quiescent level using the pre-outburst GALEX and SDSS data is shown in orange. The color figure can be viewed online.
The SEDs corresponding to the broadband coverage of the initial slow outburst decay (over MJD 58059 to 58070) are shown in Figure 3 (as black •, green ◆, and red ■, respectively; upper limits are always shown using ∇ in the appropriate colour). These SEDs fit well a blackbody model. The spectral indices corresponding to these SEDs were Γ ≈1.5- 2.3 and such values are consistent with the expected emission from a disk-like spectrum (Frank et al. 2002).
Several observations during the subsequent rapid outburst decay stage (after MJD 58070) yielded only upper limits with very few detections across the various bands. The SED constructed for the observations around MJD 58075 is unconstrained with
Further, we examined the SED shape around MJD 58080 and 58081 (near the end of the rapid optical and corresponding slow UV decay phase, as shown by the dark blue ✴ and light blue ◦, respectively, in Figure 3). Unfortunately, detections were only obtained in either the UV or the optical bands for each of these days. However, the source magnitude level at this stage of the outburst is not expected to vary much across time scales of day.7 Thus, we have a quasi-simultaneous detection in the optical and UV bands which suggests a very steep SED, with Γ≈3.7±0.7.
The discussion in § 4 shows that this very steep SED a few days after the end of its outburst
might not be unrealistic for the quiescent state of OT 0753. Fitting a blackbody
model to this SED indicated a temperature of
If the pre-outburst flux is indeed representative of the quiescent flux level of the source, then the source flux must drop further after MJD 58080-58081. This is confirmed by the UV upper limit we obtained around MJD 58091 (see Table 1 and Figure 2) which indeed demonstrates that the source decreased further (at least in the UV).
We also constructed an SED at the assumed pre-outburst quiescent level, using the GALEX and SDSS data, as is shown in orange in Figure 3. The spectral index obtained for our assumed pre-outburst quiescent level is
4. Discussion
We report on the near-infrared, optical, and UV behavior of the transient source OT 0753 during its 2017 outburst and subsequent quiescence. The broadband spectral behavior of the source, the length of the outburst (
Otulakowska-Hypka et al. (2016) have presented the statistical properties of several dwarf nova by studying their outbursts. We use their study to learn more about OT 0753 based on its properties that we observe. We note that their study is based only on optical data and therefore we will only use properties determined from our optical observations to compare them to their results. The duration of the superout-burst of OT 0753 in the optical was
The 2017 superoutburst is the first reported out-burst from this system. Using the relationship between the amplitude of the superoutburst and the amplitude of the normal outburst presented by Otulakowska-Hypka et al. (2016, see their Figure 13), we find that the amplitude of the normal outburst is ≈1-1.5 magnitude fainter than the superoutburst. This indicates that normal outbursts of OT 0753 will only have a magnitude of ≈20 in the optical bands meaning that the peak amplitude of such normal out-bursts from this source may not be detectable by the various sky surveys. For example, the survey limit of the MASTER-Net project (based on its individual snapshots) is ≈20-21 mag and that of the Catalina Real Time Survey (Drake et al. 2009), which also observes this part of the sky, is only ≈19-19.5 mag. This could explain why the superoutburst of this source was the first activity to be detected and reported and why any previous normal outbursts were missed.
The relation between the amplitude of the super-outburst and the recurrence time between two consecutive superoutbursts presented by Otulakowska-Hypka et al. (2016, see their Figure 9) predicts that superoutbursts in this source should recur every ≈230 days. It is unknown why the source has not been observed before its 2017 superoutburst. During a superoutburst, similar to the 2017 one we study, the source is above the survey limit of several all sky surveys only for
4.1. Cooling of the White Dwarf ?
Observations of white dwarfs after the end of dwarf nova outbursts show that they may be heated during the outburst and cool once the outburst ceases. White dwarfs in both short and long orbital period systems were found to have cooled by ≈ 4,000-7,000 K, ≈40-70 days after the end of their outbursts (Gänsicke & Beuermann 1996; Long et al. 1994; Godon et al. 2017).
We examined OT 0753 during its 2017 outburst and subsequent quiescence. We found that the SED evolves from resembling emission from a hot accretion disk to one that has a very steep spectral index (of Γ≈3.7±0.7, indicating a blackbody temperature of
OT 0753 could be a promising source to study cooling in white dwarfs after being heated during its outburst (see discussion above). However, from its position in the sky and its peak outburst flux it seems to be located in the Galactic halo and it may not be close enough (see discussion in § 4.5 for a distance estimate) to allow a sensitive study of this possible cooling.
4.2. OT 0753 Hosts a Hot White Dwarf in Quiescence
Before its 2017 outburst, OT 0753 had only been detected in the NUV band on board the GALEX satellite. The source was not detected by the SDSS. The assumed quiescent level inferred using the GALEX and SDSS data also exhibits a steep spectral index in quiescence (with
4.3. Orbital Period of OT 0753
The length of a superoutburst is not enough to definitively infer the orbital period of a dwarf nova system, because there exists a degeneracy between the length of the superoutburst and the orbital period as both systems having a short and long (above the gap) orbital period can exhibit superoutbursts of similar duration. This can be seen from Figure 18 of Otulakowska-Hypka et al. (2016). The effective white dwarf temperature can help break this degeneracy since systems located above the period gap host hot white dwarfs (likely due to the high mass accretion rate on to the white dwarf; see Figure 21 of Pala et al. 2017). Studying the SED we find that OT 0753 likely hosts a hot white dwarf that has an effective temperature
Several dwarf nova sources exhibit ‘rebrightenings’ which are episodes of increase of flux after the end of the initial outburst (see for e.g., WZ Sge; Patterson et al. 2002; Kato et al. 2009). Their peak fluxes are observed to reach the flux level observed at the end of the slow decay stage of the out-burst. These rebrightenings are hypothesized to be caused by a 3:1 resonance, by the interaction between a precessing eccentric accretion disk and the secondary star in certain specific system configurations (O’Donoghue 2000). These systems have a mass ratio that is small enough (q = M2/M1 <0.25, where M1 is the mass of the white dwarf and M2 is the mass of the donor; Whitehurst 1988) to accommodate a large accretion disk where a 3:1 resonance can occur (O’Donoghue 2000). It is found that these are systems that have short orbital periods (
4.4. OT 0753 is a U Gem Like System
The source properties of OT 0753 (the inferred white dwarf temperature, the inferred orbital period, and the SED evolution) indicate that it is very similar to U Geminorum. U Gem was studied using the Hopkins Ultraviolet Telescope in the UV and was found to have a very blue quiescent spectrum very soon (≈10 days) after the end of one of its outbursts (Long et al. 1993). This hot blue spectrum was dominated by emission from the white dwarf and the inferred temperature of this white dwarf was very high at ≈38,000 K (assuming all the UV light came only from the white dwarf; Long et al. 1993). Similar sources (e.g., UZ Serpentis and SS Aurigae; Lake & Sion 2001) also show a blue white dwarf dominated spectra in quiescence and have orbital periods (≈4 hours) similar to that inferred for OT 0753. Thus, OT 0753 is probably also a U Gem type system which is dominated by the hot white dwarf in quiescence.
4.5. No X-ray Detection During the Dwarf Nova Outburst
OT 0753 was not detected in X-rays. Güver et al. (2006) studied U Gem during its outburst and hypothesize that its X-ray activity arises from optically thin plasma close to the white dwarf or from the optically thick boundary layer during the outburst. If all dwarf novae are expected to show X-ray emission, albeit faint, due to similar mechanisms when they are in outbursts, then the lack of any X-ray detection from the source may be evidence that the source is located relatively far away. The X-ray flux from U Gem around the peak of its normal 2002 optical outburst, observed using Chandra, was found to be FX = 3.3 × 10⁻¹¹ erg cm−2 s−1 (0.8-7.5 keV). U Gem is located at a distance of around 100 pc (Harrison et al. 2004) which corresponds to an out-burst luminosity ≈ 4.1×1031 erg s−1. Assuming that our X-ray upper limit determined at the time close to the outburst peak (see § 2) corresponds to the same luminosity as observed for U Gem the distance to OT 0753 would be
4.6. The Insight Obtained from the UV Coverage
OT 0753 was observed in the optical and UV bands during its outburst and subsequent decay. The UV probes hotter components of the system compared to the optical. For example, it can probe the inner hot accretion flow and, in this case, also the hot white dwarf. We wish to emphasize the importance of UV coverage of dwarf nova outbursts as this coverage can provide insights into the physics of the system which are unavailable when studying the source only in the optical. For example, if we only studied the optical light curve in Figure 2 we would had only been able to conclude that OT 0753 likely experienced a superoutburst which was not followed by any subsequent rebrightenings. The additional UV coverage after the end of the outburst showed that the source magnitude decayed relatively slowly in this band as compared to the optical. This allowed us to infer that the source likely hosts a cooling white dwarf which may have been heated during the preceding accretion outburst. Similarly, the spectrum covering the UV and optical wavelengths gave us more insight than would be inferred by only studying the optical spectral evolution. The optical spectral evolution alone indicated that a strong disk contribution present during the outburst gradually decreased as the outburst transitioned to quiescence. The additional UV coverage indicated that although the disk component faded away the spectrum remained very steep, suggesting the presence of a hot white dwarf. Furthermore, the assumed quiescent spectrum determined using the SDSS optical data and UV data from GALEX also exhibited a very steep spectral index which suggested that even after cooling the source hosts a hot white dwarf.
4.6.1. Further Studies of Cooling White Dwarfs
Without the accompanying UV coverage we would have missed the potential cooling of the hot white dwarf that OT 0753 hosts. This source is estimated to be at a large distance away (see § 4.5) and is not an excellent candidate to study the cooling in white dwarfs after the end of its accretion outburst. However, similar UV and optical coverage of nearby promising sources that may exhibit cooling will allow us to learn not only about the accretion physics but also to monitor the cooling white dwarf more accurately, thereby allowing us to infer the physics of the white dwarf. Photometry using the Swift/UVOT and similar instruments will allow us to sample a large population of cooling white dwarfs and infer thermal properties of the white dwarf.
AP and RW are supported by a NWO Top Grant, Module 1, awarded to RW. JVHS is supported by a Vidi grant awarded to Nathalie Degenaar by the Netherlands Organization for Scientific Research (NWO). DP is partially supported by the Consejo Nacional de Ciencia y Tecnología with a CB-2014-1 grant #240512. We thank the Swift team for scheduling our observations. We thank the RATIR project team, in particular C. Román-Zúñiga, and the staffof the Observatorio Astronómico Nacional on Sierra San Pédro Mártir. RATIR is a collaboration between the University of California, the Universidad Nacional Autonóma de México, NASA Goddard Space Flight Center, and Arizona State University, benefiting from the loan of an H2RG detector and hardware and software support from Teledyne Scientific and Imaging. RATIR, the automation of the Harold L. Johnson Telescope of the Observatorio Astronómico Nacional on Sierra San Pedro Mártir, and the operation of both are funded through NASA grants NNX09AH71G, NNX09AT02G, NNX10AI27G, and NNX12AE66G, CONACyT grants INFR-2009-01-122785 and CB-2008-101958, UNAM PAPIIT grant IN113810, and UC MEXUS-CONACyT grant CN 09-283.

