


 nova página do texto(beta)
 Inglês (pdf)
 Artigo em XML
 Referências do artigo
 Enviar este artigo por email
 Citado por SciELO
  Similares em
SciELO
Similares em
SciELO 
 Permalink
1. Introduction
Cataclysmic variables (CVs) are close binary systems in which a white dwarf (WD) accretes from a low-mass star via Rochelobe overflow, often creating an accretion disc (for a review see Warner 1995). A large fraction of CVs belong to the subclass of dwarf novae (DNe). They undergo recurrent outbursts with typical amplitudes of
Among the SU UMa-type systems, there is a large group that accumulates around the minimum of the orbital period distribution of CVs (Porb ≈ 78 min) (Paczynski & Sienkiewicz 1981; Gänsicke et al. 2009; Knigge et al. 2011). These are binaries with extremely low mass-transfer rates, named WZ Sge-type objects, which are characterised by rare (commonly detected every ≈ 10 years), and large amplitude superoutbursts of duration of ≈ 30 days, caused by an instability in low viscosity accretion discs with α ≈ 0.01 − 0.001 (Smak 1993; Osaki 1994). Some of them are systems currently evolving towards longer periods and are collectively known as period bouncers (e.g. Littlefair, Dhillon & Martin 2003). These binaries are expected to harbour a substellar secondary companion (Howell et al. 1997), i.e. brown dwarfs (e.g. Littlefair et al. 2006; Harrison 2016; Hernández Santisteban et al. 2016; Neustroev et al. 2017).
Worth noting is that WZ Sge-type objects are characterised not only by a long superoutburst recurrence time in comparison to typical SU UMa stars, but also by the presence of early superhumps (double-wave modulation) during the first few days of the eruption, with a periodicity (Pesh) essentially equal to the orbital period of the binary (details in O’Donoghue et al. 1991; Kato 2015). The advent of all-sky surveys (e.g. Breedt et al. 2014) and worldwide citizen-telescope networks has contributed to the discovery of a large population of faint DNe. Among these discoveries, the elusive population of short-period systems, in particular period bouncers, has been found and investigated (Patterson 2011; Coppejans et al. 2016; Otulakowska-Hypka et al. 2016).
The discovery of a new transient, initially proposed as possible nova, was reported by Itagaki on 2013 May 31. Henden16 pointed out that the colour indices of the object and the un-reddened field suggested a DN rather than a nova. As pointed out by Hurst17, Kojima reported a pre-discovery image on 2013 May 30.721 UT, when the magnitude was at about 9.8 mag (un-filtered). A CBET report of this new DNe in Aquila, can be found in Itagaki (2013).
Although a preliminary analysis of the behaviour of V1838 Aql (originally designated as PNV J19150199+0719471) was published by Kato et al. (2014), we present here a full analysis of the superhump behaviour based on our extensive data.
In § 2 we present the observations and their reduction methods. The photometric data and the period analysis are presented in § 3, while in § 4 we address the discussion of our results. We present our conclusions in § 5.
2. Observations and reduction
Photometric observations in the V band were obtained in 2013 during the nights of June 3, 4, 5, 6, 17, 18, 28 and September 2 and 25 at the 0.84 m telescope of the Observatorio Astronómico Nacional at San Pedro Mártir (SPM). We used the Blue-ESOPO CCD detector18 on a 2 × 2 binning configuration. The exposure time of the SPM observations varied between 10 and 30 s. In addition, time-series photometry of the superoutburst was obtained from 10 observatories of the Center for Backyard Astrophysics (CBA) -a network of small (0.2 − 0.4 m) telescopes that covers a wide range in terrestrial longitude. Skillman & Patterson (1993) and de Miguel et al. (2016) describe the methods and observing stations of the CBA network. These observations amounted to 162 separate time-series during 58 nights from June 1 to August 2, 2013, and the typical exposure time ranged from 20 to 120 seconds, depending on the brightness of V1838 Aql. Nearly half of these observations were obtained in V light, while the rest (mainly during the post-outburst regime) were unfiltered. We did not attempt any absolute calibration of the data during the eruption, but the magnitude scale is expected to resemble closely V magnitudes with a zero-point uncertainty of
3. Photometry and period analysis
3.1. Photometric Observations
Most of our photometric observations come from the CBA network, with additional V -band observations obtained with the 0.84 m telescope at SPM at some critical stages of the outburst and during the late decline.19 We observed the typical pattern seen in SU UMa stars during superoutburst: a plateau phase -lasting ≈ 25 days, from HJD 444 to 469- where the mean brightness varied smoothly from 10.5 to 13.0 mag, followed by a rapid decline (≈ 3 mag in 2 days) at the end of the main eruption. The subsequent fading towards quiescence occurred at a rather low rate (≈ 0.035 mag d-1), and even 3.5 years after the end of the eruption, the system was found to be ≈ 0.5 mag above the pre-eruption quiescent brightness. However, based on the observations obtained with the NTT telescope (La Palma, Spain), we confirmed that the object had reached the pre-outburst level by June 2017. These observations and the general spectral distribution at quiescence have no further relevance here and will be discussed in a future publication.
3.2. Full Analysis of the Different Stages of the Superhump
Our primary tool for studying periodic signals was the Period 04 package (Lenz & Breger 2005). First, we subtracted the mean and (linear) trend from each individual light curve and formed nightly-spliced light curves. Then, after combining light curves from adjacent nights, a search for periodic signals was done. This approach allows us to improve the frequency resolution, but it has to be implemented with caution, since variations in the amplitude and/or the period of the modulation -both effects known to affict erupting DNe- can distort the outcome of the frequency analysis.
A general view of the superhump transitions can be looked up by identifying the different stages of the superhumps: early superhumps, Stages A, B and C as well as the post-outburst stage (see Kato et al. 2009, 2014, for this terminology in our general discussion). Thus, we looked at the time variations of the superhump period and its amplitude by examining the variation in time with respect to a well-defined feature of the superhump signal.
After this general analysis, a detailed explanation of these stages was made. First, we derived the timings of superhump maxima. A total of 310 times of superhump maxima was identified in the light curves in the interval HJD 449.6-498.6 days. These maxima are shown in Table 1. The early stage of the eruption was not considered, since the signal there was of very low amplitude and individual maxima were not well defined. A linear regression to these timings provides the following test ephemeris:
Table 1 Times of superhump maxima of V1838 Aql during the 2013 superoutburst.a
| Eb | T_maxc | O-Cd | Eb | T_maxc | O-Cd | Eb | T_maxc | O-Cd | Eb | T_maxc | O-Cd |
| -51 | 449.7831 | -0.906 | 116 | 459.5372 | -0.283 | 189 | 463.8032 | 0.028 | 345 | 472.9088 | 0.506 |
| -50 | 449.8282 | -1.131 | 116 | 459.5365 | -0.295 | 190 | 463.8598 | -0.001 | 346 | 472.9681 | 0.524 |
| -50 | 449.8354 | -1.007 | 117 | 459.5944 | -0.301 | 190 | 463.8607 | 0.016 | 359 | 473.7247 | 0.527 |
| -49 | 449.8934 | -1.011 | 117 | 459.5939 | -0.309 | 195 | 464.1540 | 0.056 | 360 | 473.7820 | 0.511 |
| -49 | 449.8956 | -0.972 | 118 | 459.6513 | -0.322 | 196 | 464.2150 | 0.104 | 361 | 473.8381 | 0.474 |
| -34 | 450.7936 | -0.541 | 120 | 459.7703 | -0.278 | 197 | 464.2728 | 0.097 | 362 | 473.8938 | 0.431 |
| -33 | 450.8491 | -0.586 | 121 | 459.8289 | -0.271 | 198 | 464.3288 | 0.060 | 363 | 473.9561 | 0.502 |
| -22 | 451.4995 | -0.410 | 122 | 459.8842 | -0.320 | 199 | 464.3889 | 0.092 | 371 | 474.4228 | 0.523 |
| -21 | 451.5535 | -0.481 | 123 | 459.9432 | -0.307 | 200 | 464.4455 | 0.065 | 372 | 474.4782 | 0.475 |
| 0 | 452.7934 | -0.174 | 131 | 460.4149 | -0.200 | 205 | 464.7456 | 0.222 | 373 | 474.5387 | 0.514 |
| 1 | 452.8512 | -0.181 | 132 | 460.4708 | -0.239 | 206 | 464.7997 | 0.151 | 374 | 474.5940 | 0.464 |
| 16 | 453.7190 | -0.268 | 132 | 460.4718 | -0.223 | 207 | 464.8537 | 0.080 | 375 | 474.6515 | 0.453 |
| 17 | 453.7782 | -0.250 | 133 | 460.5281 | -0.254 | 212 | 465.1482 | 0.141 | 376 | 474.7119 | 0.490 |
| 18 | 453.8358 | -0.261 | 133 | 460.5286 | -0.247 | 213 | 465.2072 | 0.154 | 377 | 474.7702 | 0.492 |
| 19 | 453.8959 | -0.228 | 134 | 460.5883 | -0.220 | 214 | 465.2684 | 0.205 | 377 | 474.7705 | 0.497 |
| 47 | 455.5203 | -0.313 | 134 | 460.5883 | -0.220 | 215 | 465.3263 | 0.201 | 377 | 474.7706 | 0.500 |
| 48 | 455.5766 | -0.345 | 135 | 460.6459 | -0.231 | 234 | 466.4437 | 0.403 | 378 | 474.8263 | 0.456 |
| 49 | 455.6356 | -0.331 | 136 | 460.7049 | -0.218 | 235 | 466.5055 | 0.465 | 378 | 474.8280 | 0.486 |
| 50 | 455.6938 | -0.331 | 137 | 460.7625 | -0.227 | 236 | 466.5650 | 0.488 | 379 | 474.8868 | 0.497 |
| 51 | 455.7512 | -0.345 | 138 | 460.8201 | -0.237 | 237 | 466.6212 | 0.453 | 379 | 474.8862 | 0.486 |
| 52 | 455.8099 | -0.336 | 139 | 460.8780 | -0.243 | 239 | 466.7401 | 0.497 | 379 | 474.8909 | 0.566 |
| 53 | 455.8690 | -0.321 | 139 | 460.8787 | -0.230 | 252 | 467.4850 | 0.298 | 380 | 474.9493 | 0.570 |
| 54 | 455.9259 | -0.342 | 139 | 460.8792 | -0.221 | 253 | 467.5438 | 0.309 | 393 | 475.6979 | 0.435 |
| 64 | 456.5073 | -0.351 | 154 | 461.7554 | -0.164 | 254 | 467.6029 | 0.324 | 394 | 475.7561 | 0.435 |
| 65 | 456.5671 | -0.323 | 154 | 461.7576 | -0.126 | 255 | 467.6619 | 0.338 | 394 | 475.7527 | 0.376 |
| 66 | 456.6232 | -0.361 | 155 | 461.8140 | -0.158 | 269 | 468.4730 | 0.277 | 395 | 475.8151 | 0.449 |
| 69 | 456.7989 | -0.341 | 156 | 461.8764 | -0.085 | 271 | 468.5903 | 0.292 | 395 | 475.8118 | 0.392 |
| 70 | 456.8561 | -0.358 | 156 | 461.8756 | -0.098 | 272 | 468.6448 | 0.229 | 395 | 475.8140 | 0.430 |
| 81 | 457.4979 | -0.328 | 157 | 461.9311 | -0.144 | 285 | 469.4134 | 0.436 | 396 | 475.8725 | 0.436 |
| 82 | 457.5560 | -0.330 | 167 | 462.5166 | -0.083 | 286 | 469.4648 | 0.320 | 396 | 475.8737 | 0.456 |
| 83 | 457.6146 | -0.323 | 168 | 462.5755 | -0.070 | 287 | 469.5288 | 0.420 | 397 | 475.9309 | 0.439 |
| 84 | 457.6733 | -0.314 | 169 | 462.6334 | -0.076 | 288 | 469.5973 | 0.598 | 406 | 476.4504 | 0.366 |
| 85 | 457.7303 | -0.335 | 170 | 462.6916 | -0.075 | 289 | 469.6537 | 0.567 | 407 | 476.5093 | 0.380 |
| 86 | 457.7893 | -0.320 | 171 | 462.7489 | -0.090 | 290 | 469.7051 | 0.451 | 411 | 476.7418 | 0.374 |
| 87 | 457.8469 | -0.332 | 171 | 462.7500 | -0.072 | 291 | 469.7620 | 0.428 | 412 | 476.7950 | 0.288 |
| 88 | 457.9044 | -0.343 | 171 | 462.7514 | -0.047 | 292 | 469.8186 | 0.400 | 413 | 476.8565 | 0.345 |
| 92 | 458.1365 | -0.354 | 172 | 462.8101 | -0.039 | 292 | 469.8215 | 0.450 | 414 | 476.9143 | 0.338 |
| 93 | 458.1941 | -0.365 | 172 | 462.8074 | -0.086 | 293 | 469.8789 | 0.437 | 415 | 476.9763 | 0.404 |
| 97 | 458.4284 | -0.338 | 172 | 462.8078 | -0.078 | 303 | 470.4617 | 0.452 | 423 | 477.4346 | 0.280 |
| 99 | 458.5459 | -0.318 | 173 | 462.8644 | -0.106 | 305 | 470.5709 | 0.329 | 425 | 477.5504 | 0.270 |
| 102 | 458.7208 | -0.313 | 173 | 462.8635 | -0.122 | 306 | 470.6391 | 0.501 | 426 | 477.6130 | 0.346 |
| 103 | 458.7807 | -0.283 | 178 | 463.1596 | -0.033 | 308 | 470.7548 | 0.489 | 427 | 477.6698 | 0.321 |
| 104 | 458.8372 | -0.313 | 179 | 463.2169 | -0.049 | 309 | 470.8143 | 0.510 | 429 | 477.7832 | 0.270 |
| 105 | 458.8942 | -0.333 | 180 | 463.2767 | -0.021 | 310 | 470.8750 | 0.554 | 429 | 477.7877 | 0.348 |
| 106 | 458.9522 | -0.336 | 181 | 463.3344 | -0.030 | 325 | 471.7415 | 0.446 | 430 | 477.8417 | 0.275 |
| 110 | 459.1872 | -0.298 | 182 | 463.3946 | 0.005 | 326 | 471.7985 | 0.424 | 430 | 477.8434 | 0.305 |
| 111 | 459.2441 | -0.321 | 184 | 463.5105 | -0.003 | 334 | 472.2435 | 0.072 | 431 | 477.9022 | 0.315 |
| 112 | 459.3025 | -0.316 | 185 | 463.5680 | -0.015 | 335 | 472.3005 | 0.051 | 432 | 477.9570 | 0.257 |
| 113 | 459.3617 | -0.300 | 186 | 463.6273 | 0.003 | 342 | 472.7271 | 0.381 | 435 | 478.1406 | 0.412 |
| 115 | 459.4778 | -0.305 | 187 | 463.6863 | 0.019 | 343 | 472.7931 | 0.516 | 436 | 478.1927 | 0.308 |
| 115 | 459.4767 | -0.323 | 188 | 463.7462 | 0.047 | 344 | 472.8467 | 0.437 | 437 | 478.2500 | 0.293 |
| 438 | 478.3092 | 0.310 | 482 | 480.8586 | 0.120 | 535 | 483.9315 | -0.073 | 631 | 489.4996 | -0.386 |
| 440 | 478.4235 | 0.273 | 483 | 480.9154 | 0.097 | 549 | 484.7405 | -0.170 | 632 | 489.5580 | -0.382 |
| 441 | 478.4880 | 0.381 | 492 | 481.4423 | 0.151 | 550 | 484.8051 | -0.060 | 633 | 489.6199 | -0.318 |
| 442 | 478.5401 | 0.277 | 493 | 481.5009 | 0.159 | 551 | 484.8538 | -0.222 | 647 | 490.4349 | -0.313 |
| 443 | 478.6004 | 0.313 | 494 | 481.5564 | 0.112 | 552 | 484.9199 | -0.087 | 648 | 490.4859 | -0.437 |
| 444 | 478.6549 | 0.251 | 495 | 481.6122 | 0.071 | 566 | 485.7333 | -0.109 | 649 | 490.5440 | -0.438 |
| 445 | 478.7189 | 0.351 | 499 | 481.8423 | 0.026 | 567 | 485.7904 | -0.128 | 650 | 490.6030 | -0.424 |
| 446 | 478.7747 | 0.309 | 500 | 481.9082 | 0.158 | 567 | 485.7921 | -0.098 | 664 | 491.4146 | -0.476 |
| 447 | 478.8253 | 0.179 | 501 | 481.9544 | -0.048 | 569 | 485.9045 | -0.166 | 665 | 491.4719 | -0.493 |
| 447 | 478.8274 | 0.215 | 504 | 482.1375 | 0.098 | 584 | 486.7694 | -0.303 | 666 | 491.5400 | -0.322 |
| 457 | 479.4087 | 0.204 | 505 | 482.1974 | 0.127 | 585 | 486.8333 | -0.206 | 668 | 491.6425 | -0.560 |
| 458 | 479.4702 | 0.262 | 509 | 482.4295 | 0.116 | 586 | 486.8901 | -0.229 | 681 | 492.3960 | -0.611 |
| 460 | 479.5823 | 0.188 | 510 | 482.4819 | 0.017 | 587 | 486.9451 | -0.285 | 682 | 492.4595 | -0.520 |
| 461 | 479.6400 | 0.180 | 511 | 482.5406 | 0.025 | 600 | 487.6953 | -0.392 | 699 | 493.4440 | -0.602 |
| 464 | 479.8154 | 0.194 | 512 | 482.6006 | 0.056 | 601 | 487.7651 | -0.193 | 705 | 493.7895 | -0.665 |
| 465 | 479.8748 | 0.214 | 515 | 482.7719 | -0.000 | 601 | 487.7622 | -0.243 | 706 | 493.8516 | -0.597 |
| 466 | 479.9279 | 0.127 | 516 | 482.8296 | -0.008 | 603 | 487.8830 | -0.167 | 707 | 493.9032 | -0.711 |
| 470 | 480.1643 | 0.188 | 516 | 482.8326 | 0.042 | 604 | 487.9327 | -0.312 | 722 | 494.7758 | -0.715 |
| 471 | 480.2222 | 0.185 | 517 | 482.8892 | 0.015 | 612 | 488.3968 | -0.337 | 723 | 494.8371 | -0.662 |
| 472 | 480.2755 | 0.100 | 518 | 482.9433 | -0.054 | 613 | 488.4523 | -0.383 | 724 | 494.8931 | -0.700 |
| 474 | 480.3975 | 0.197 | 526 | 483.4092 | -0.047 | 614 | 488.5193 | -0.231 | 733 | 495.4140 | -0.747 |
| 475 | 480.4534 | 0.157 | 527 | 483.4678 | -0.040 | 615 | 488.5730 | -0.308 | 739 | 495.7585 | -0.828 |
| 476 | 480.5116 | 0.157 | 528 | 483.5244 | -0.068 | 618 | 488.7454 | -0.347 | 740 | 495.8167 | -0.828 |
| 477 | 480.5736 | 0.224 | 529 | 483.5860 | -0.010 | 619 | 488.7985 | -0.434 | 785 | 498.4271 | -0.968 |
| 478 | 480.6261 | 0.125 | 532 | 483.7593 | -0.032 | 620 | 488.8621 | -0.341 | 786 | 498.4876 | -0.929 |
| 480 | 480.7420 | 0.117 | 533 | 483.8188 | -0.010 | 621 | 488.9207 | -0.333 | |||
| 481 | 480.7976 | 0.072 | 534 | 483.8748 | -0.047 | 630 | 489.4422 | -0.372 |
a Individual errors in these timings are not explicitly included here.
b E (cycle number).
c Superhump maxima expressed as HJD - 2,456,000.
d O - C value (in cycles) according to the ephemeris.
T_max (HJD) = 2,456,452.8035 + 0.058191 E.
The top panel of Figure 1 displays the general photometric behaviour of the system during our campaign. Next, on the middle panel of Figure 1 is presented the variation of the amplitude of the superhump modulation, defined as the semi-amplitude of the sine wave that best fits the nightly photometric data.
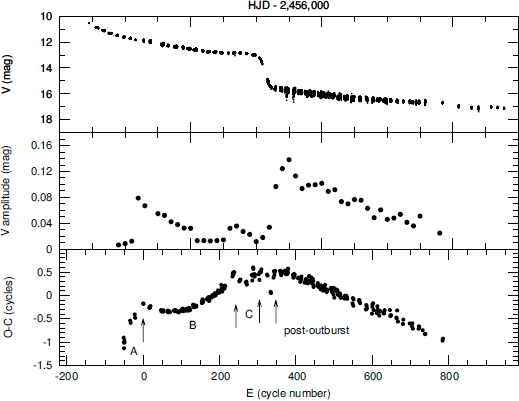
Fig. 1 Photometric behaviour of V1838 Aql during its superoutburst in 2013. Top frame: global light curve of the observational campaign. Middle frame: amplitude variations of the superhumps along the superoutburst (see text). Bottom frame: O-C diagram for the superhump maxima in the HJD 449.6-498.6 day interval with respect to the ephemeris given in equation (1). The arrows indicate the (approximate) location of transitions between different regimes of superhump period variations (see text).
The O-C residuals of the times of maximum light relative to the ephemeris given by equation 1 are shown in the lower panel of Figure 1. The resulting O-C diagram is complex, but it displays a number of features that are usually observed in other SU UMa-type systems (Kato 2015). Among the most relevant features visible in this diagram we point out the following:
During the first four days of the outburst a weak modulation (early superhumps) with a period Pesh ≈ 0.057 d was visible in the light curve.
The onset of fully-grown (Stage A superhumps) took place in a short time-scale (≈ 2 d) and involved an increase in the amplitude of the modulations. Their (mean) period, Psh(A) ≈ 0.059 d, was longer than Pesh.
Once the superhump modulation reached full amplitude, the system entered Stage B where the amplitude of the superhump decreased slowly, and the mean period became shorter (Psh(B) ≈ 0.058 d). The upward curvature of the residuals during this stage (days HJD 449-466) signifies that the period of the superhumps was not constant, but increased over time. From a quadratic fit of the residuals in this interval, we find an increase rate of
Before the end of the main eruption, the amplitude of the superhumps was found to grow larger (≈ 0.10 mag). The system entered Stage C, extending from day HJD 466 to the end of the main plateau (around day HJD 470), where the period of the superhump remained essentially constant (Psh(C) ≈ 0.0582 d).
Worth noting is the increase of the amplitude variations as the system dropped by about 3 mag between Stage C and the post-outburst stage.
After the end of the main eruption (day ≥ HJD 473) the superhumps were still visible with a significantly larger amplitude ≈ 0.2 mag), and with a period which remained constant for at least the subsequent ≈ 25 days. The period of the post-outburst modulation was shorter than Psh.
A summary of the main periodicities along the eruption is given in Table 2, as found in the next subsections.
Table 2 Mean photometric periods and frequencies of the superhump modulation.*
| Time interval (HJD-2456000) |
Period (d) |
Frequency (cycles d−1) |
Comments |
| 445-448 | 0.05698(9) | 17.55(3) | early superhumps |
| 449-451 | 0.0594(3) | 16.83(8) | Stage A |
| 452-466 | 0.058384(10) | 17.128(3) | Stage B |
| 466-470 | 0.05817(3) | 17.191(10) | Stage C |
| 473-498 | 0.05799(1) | 17.244(1) | post outburst |
| 449-498 | 0.0581910(1) | 17.1847(3) | mean superhump period |
* Values correspond to the 2013 superoutburst of V1838 Aql. The errors in parentheses correspond to the last significant figures.
3.2.1. Early Superhumps
From the beginning of our campaign, a weak modulation of about 0.010 mag full amplitude was observed in the light curves. This signal persisted over days HJD 445-448. The power spectrum of the spliced light curve covering this 4-day segment is shown in the upper frame of Figure 2. It is dominated by two broad peaks centred at frequencies 35.10(3) and 17.55(3) cycles d-1. These signals were weak, with amplitudes of 0.0036 and 0.0030 mag, respectively. Although they were barely detected above the noise, we interpret them as a likely manifestation of early superhumps (Kato et al. 2014).

Fig. 2 Upper frame: Power spectrum during days HJD 445-448 (early superhumps), showing broad peaks centred at 17.55 cycles d−1 and its first harmonic. Lower frame: Waveform of the early superhumps obtained after folding the data with Pesh = 0.05698 d. The zero phase is arbitrary.
This photometric feature is known to be typical of WZ Sge-type stars, and is not shown by any other type of dwarf nova. Although its physical origin is still under debate, there is increasing observational evidence that its period (Pesh) is essentially equal to Porb (Patterson et al. 1996; Kato 2015). A folded curve of the spliced light curve with Pesh = 0.05698(9) d is also shown in the lower frame of Figure 2, which shows the double-humped pattern characteristic of early superhumps. The value of Pesh obtained in this paper is slightly different from, but consistent with, the value of 0.05706(2) d reported in Kato et al. (2014).
3.2.2. Common Superhumps
The double-humped pattern of the early superhumps turned into single-peaked humps on day HJD 449. Over days HJD 449-451, the mean amplitude was around ≈ 0.007 mag and the period was ≈ 4% longer than the period found for early superhumps. The dominant signal occurred at 16.83(8) cycles d−1 corresponding to a period of 0.0594(3) d. Since the modulation was better defined in this 2-day interval, we were able to determine the times of maximum in the signal. We identified a total of 9 maxima in the HJD 449.6-451.6 day interval, and obtained a period of 0.05934(11) d (corresponding to a frequency of 16.85(3) cycles d−1) from a linear regression. This value is fully consistent with the one found from the Fourier analysis. The modulation over this 2-day segment is interpreted as Stage-A superhumps. The period we find is close to, but slightly different from, the value of 0.05883(6) d reported in Kato et al. (2014).
Fully-grown, large-amplitude superhumps were finally observed on day HJD 452 (amplitude of 0.10 mag). As a representative example, we show in the upper frame of Figure 3 the light curve from day HJD 455. As the eruption proceeded, the mean amplitude of the superhumps decreased (as shown in the middle panel of Figure 3). The variation in amplitude was smooth in the HJD 452-466 day interval. We formed a spliced light curve in this interval, and obtained the power spectrum shown in the middle frame of Figure 3. The strongest signals occurred at f 1 = 17.128(3) and f 2 = 34.265(3) cycles d−1.

Fig. 3 Upper frame: A 12-hour spliced light curve obtained on day HJD 455, dominated by large-amplitude common superhumps. The zero level in the figure corresponds to V ≈ 12.1 mag. Middle frame: Power spectrum during the common superhump era (days HJD 442- 466), with main peaks centred at frequencies 17.128 and 34.265 cycles d−1. Lower frame: Mean waveform of the common superhump obtained after folding the data on P = 0.058384 d. The zero phase is arbitrary.
They were interpreted as the frequency of Stage-B superhumps (period of Psh = 0.058384(10) d) and its first harmonic, respectively. Other (weaker) peaks, not shown in Figure 3, were found at f 3 = 51.381(6) and f 4 = 68.403(6) cycles d−1. The mean waveform of the superhump modulation during this interval is shown in the lower panel of Figure 3.
We note that after subtracting the superhump signal and its harmonics, the power spectrum of the residual light curve showed peaks at 17.20 and 17.28 cycles d−1. But we do not give any physical significance to these detections, and interpret them as the result of period and amplitude variations of the superhump wave during the eruption.
The amplitude of the superhumps increased around day HJD 466, and decreased thereafter until the end of the main eruption (Stage C). The strongest signal in the power spectrum in the HJD 466-470 day interval occurred at 17.191(10) cycles d−1, corresponding to a period of 0.05817(3) d, with additional peaks at higher harmonics.
3.2.3. Post-Outburst Stage
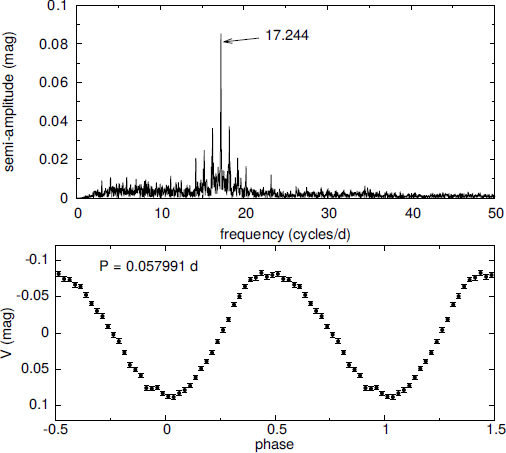
Once the main eruption was over, the light curve was still dominated by superhumps, but now with significantly larger amplitude (≈ 0.15 mag) which decreased slowly (≈ 0.013 mag d−1). This behaviour remained essentially unchanged for nearly 20 days of our observations after the main fading.
We formed a spliced light curve including all the observations from day HJD ≥ 473, and found a power spectrum (shown in the upper frame of Figure 4), with a peak at 17.244(1) cycles d−1. This was interpreted as the frequency of the post-outburst superhump, and dominated the spectrum. Higher-order harmonics were also found, but their amplitude was very low (< 0.0065 mag). This signifies that the waveform of the post-outburst superhump was nearly sinusoidal. The lower frame of Figure 4 shows that this was indeed the case.
3.3. Photometry Near and at Minimum Light
As detailed in § 2, we took two runs near minimum light covering around one orbital period each. The light curves are shown in the upper panel of Figure 5. When folded with the orbital period (0.05698 d), the light curves seem to be out of phase. But this is not surprising: over the 23 days (nearly 400 orbital cycles) elapsed between both runs, an uncertainty of 0.0001 days in P orb involves an uncertainty of 0.7 in phase. We carried out a period analysis of both nights using the Phase Dispersion Minimization (PDM) technique (Stellingwerf 1978) in the Peranso package (Paunzen & Vanmunster 2016). This technique is frequently used to detect variations of superhumps in SU UMa systems (e.g. Kato et al. 2014). The lower frame in Figure 5 shows the results of combining the two nights with the best period estimate (0.0576 d) determined from the PDM technique. Assuming that the observed light comes from the accretion disc, the zero point obtained in this case is HJD 2456537.6946 (time of inferior conjunction of the secondary). The period found using the PDM method yielded a value which is still close to the post-outburst state, but the sinusoidal shape is gone. There was only a small peak around phase 0.25. No double modulation with orbital period was found as would be expected in a bounce-back object. Further observations in the R band were obtained on 2018, July 18 covering three orbital cycles. Since the night was not photometric, we were unable to make absolute calibrations and only differential photometry is shown in Figure 6. No obvious orbital modulation was detected within the individual errors, which are rather large (≈ 0.03 mag).

Fig. 5 Upper panel: V light curves obtained near minimum light in 2013. Open dots are from September 2 and filled dots from September 25. The size of the points corresponds to the mean individual errors. The orbital phases have been taken from the ephemeris obtained in this paper. Lower panel: The two nights folded with the ephemeris obtained by using the PDM technique (see more details in text).

4. Discussion
The values derived for the superhump period in Stages A and B allowed us to estimate the mass ratio of the system through the known “superhump excess”
It has been noted by many authors, both theoretically and observationally, that the CV orbital period distribution should present a sharp cut-off at about ≈ 80 min, usually termed as the minimum period (e.g. Rappaport et al. 1982; Ritter & Kolb 1998; Gänsicke et al. 2009). V1838 Aql has an orbital period of about 82 min, very close to the minimum period, which makes it diffcult to discern whether it is approaching to, or receding from, this minimum orbital period. Before asserting its true nature, we could look at some observational features in those CVs systems around the minimum orbital period. Most of these systems possess WZ Sge-like features. Their optical spectra are mostly dominated by the white dwarf and accretion disc itself, with no visible features from the donor. Since the rate of accretion is an order of magnitude smaller than that for systems before reaching the minimum period (
The donor of V1838 Aql is therefore an ideal candidate for NIR time-resolved spectroscopy (e.g. SDSS J143317.78+101123.3, Hernández Santisteban et al. 2016), which would render a fully independent measurement of the orbital period and the mass ratio, to confirm or reject its substellar nature. This is particularly important since few low-q systems have been observed in outburst and for which a dynamical measurement of their components is feasible. (Figure 3 in Kato & Osaki 2013). Thus, V1838 Aql could be a system to calibrate the empirical superhump relations in this poorly-explored region of parameter space.
5. Conclusions
We have presented a long-term study of the 2013 superoutburst of V1838 Aql from its peak to quiescence. Our main results are as follows:
The observed early superhumps suggest an orbital period of P orb = 0.05698(9) d, which locates V1838 Aql close to the minimum of the orbital period distribution in CVs.
From Stages A and B and early superhump periods, we found the mass ratio to be q A = 0.12(2) and q B = 0.10(1), respectively.
Based on the obtained values of the mass ratio, we claim that the donor in V1838 Aql is a low-mass star rather than a substellar object, and that the system is approaching the period minimum.
Given the long interval between outbursts in low q systems, it is of paramount importance to confirm by dynamical methods the orbital parameters of such systems. This would indicate which systems may be used in order to calibrate the empirical superhump excess relations.
The authors are indebted to DGAPA (Universidad Nacional Autónoma de México) support, PAPIIT projects IN111713, IN122409, IN100617, IN102517, IN102617, IN108316 and IN114917. GT acknowledges CONACyT grant 166376. JE acknowledges support from a LKBF travel grant to visit the API at UvA. JVHS is supported by a Vidi grant awarded to N. Degenaar by the Netherlands Organization for Scientific Research (NWO) and acknowledges travel support from DGAPA/UNAM. E. de la F. wishes to thank CGCI-UdeG staff for mobility support. We thank the day and night-time support staff at the OAN-SPM for facilitating and helping obtain our observations.

