


 nueva página del texto (beta)
 Inglés (pdf)
 Artículo en XML
 Referencias del artículo
 Enviar artículo por email
 Citado por SciELO
  Similares en
SciELO
Similares en
SciELO 
 Permalink
1. INTRODUCTION
The AGB phase is the final stage of evolution before the star becomes a white dwarf after a brief planetary nebula stage. Given their high infrared luminosity, AGB stars can be detected at large distances even on the galactic plane, where interstellar extinction is high, and serve as tracers of the stellar population. Moreover, if they are in the Mira phase, their intrinsic magnitude can be inferred from the observed period so that they can be used as distance estimators.
Substantial improvements on the accuracy of absolute luminosities of a large number of stars is provided by the DR2 catalog from the Gaia mission, and future releases can possibly reach stars up to a distance of about 4 kpc. Expanding the sample of Mira stars with well defined periods within such a distance is therefore very useful to improve their period-luminosity relation.
In this paper we report a variability study of very red stars selected in a 25 square degrees area centered on the bright star γ Cas, at galactic coordinates b=−2°, l=123°: this area covers a part of the Perseus spiral arm of the Milky Way, at a distance of about 2.4 kpc from our solar system (Reid et al. 2014). It was monitored on 87 plates of the Asiago Observatory taken with the 67/92/215 cm Schmidt telescope and an emulsion+filter combination (Kodak I-N + RG5) which gave a passband similar to the Cousins IC filter. These plates were taken between 1967 and 1984 (most of them before 1975) with a rather uniform time sampling; only a few were obtained in the last years.
The field of γ Cas was the fourth of a series of 4 fields observed by P. Maffei to search for Mira variables, the others being IC 1805 (Gasperoni et al. 1991), γ Cyg (Maffei 1977), and M16 (Maffei & Tosti 1999) . The aim of the work was a systematic study of the distribution and the relative fractions of the different types of late type variables in fields lying at low galactic latitude but at different longitudes. However, this field was not studied, so that no discoveries of variable stars based on these plates were published.
A study of these old plates has several advantages: first, they provide a continuous time coverage of about 7 years, corresponding to 7-8 cycles for a typical Mira star, large enough for a robust period determination; second, they allow a comparison with modern observations over a couple of decades, long enough to see if substantial variations in the light curves have occurred; third, the used wavelength (800 nm) is less absorbed by interstellar matter and allows us to explore a large volume in the plane of the Milky Way. This dataset is therefore well suited for the study of Mira variables; a similar time span was covered in a recent study of Mira stars based on the ASAS project (Vogt et al. 2016), with objects south of δ +28°.
A trial test to explore the quality of these plates was made by Nesci (2016) on a single known variable (V890 Cas) and was quite successful, motivating a larger effort with an automatic technique.
2. CANDIDATE SELECTION
The search for candidate AGB stars is most easily made by a color selection: For this purpose we used the IPHAS DR2 catalog (Barentsen et al. 2014), which provides r, i (Sloan filters) and H α magnitudes down to i ≈ 20 mag for a large part of the Milky Way: the zero point of these magnitudes is on the Vega scale.
To determine the proper r − i color for candidate AGB stars a first guess is given by Sale et al. (2009) who indicate r − i ≥ 2 mag for unreddened M giants in the IPHAS survey. From the VSX catalog (Watson et al. 2016) we obtained 24 stars classified as late type variables (L, LB, M, SR, S), only 7 of them with a reported period. All these 24 stars are present in the IPHAS catalog: 6 have color index 1.7< r - i < 2.0mag and 18 have r - i >2.0 mag; the bluest Mira has r − i = 2.22 mag.
As our aim is to look for AGB stars with large amplitude variations, the reddest ones, we feel confident that a color limit r − i > 1.7 mag includes all the potential Mira stars in the field.
The expected variation amplitude of Miras in the IC band can be derived from the sample of 154 Mira variables studied by Maffei & Tosti (1999) with the same telescope and plates in the field of M16: 95% of these stars have peak to peak amplitudes larger than 2 mag. As the Asiago plates limit is typically around IC = 16.5 mag (Nesci 2016), we adopted a magnitude cutoff i = 15.0 mag in the IPHAS catalog to have a high probability to detect even the faintest candidate stars. Overall, 530 IPHAS stars were selected in this way, obviously including the 24 known VSX variables.
Stars brighter than r = 13, i = 12 and Hα =12.5 were found to be partially saturated in this catalog, so their color indexes may be less reliable. We feel, however, that our candidate selection is not much affected by this problem. Actually, none of our stars has r < 13, or Hα < 12.5, while 8 have an average i <12.
3. PHOTOMETRY
The Asiago plates were digitized with an EPSON 1680 Pro scanner at 1600 dpi in transparency mode at the Perugia University (Nesci et al. 2014), giving a scale of 1.587 arcsec/pixel, while the astrometric solution and automatic photometric reduction were carried out using the PyPlate software2, a pipeline developed by the APPLAUSE project (Tuvikene et al. 2014).
The pipeline processes digitized plate images in multiple steps. Instrumental magnitudes of all detected sources are extracted with the SExtractor program (Bertin & Arnouts 1996) (MAG AUTO magnitudes). Initial astrometric solutions are derived with the Astrometry.net software (Lang et al. 2010) and refined astrometric calibration in sub-fields is obtained with SCAMP (Bertin 2006). The source list is then cross-matched with the UCAC4 catalog. For photometric calibration we used the r′ and i′ (Sloan) passband data from UCAC4. Each photographic plate has a unique color response that is characterized by the color term C. Magnitudes in the plate natural system, inat, are related to the standard magnitudes by:
The pipeline calculates reference magnitudes for a series of C values using equation 1 and fits a calibration curve that transforms instrumental magnitudes to the natural system. The accepted C value corresponds to the smallest scatter of residuals around the calibration curve. The color term C for our plates was generally close to zero, of the order of ≈ 0.1. All extracted instrumental magnitudes were then transformed to the plate natural system. Overall, of the 530 candidate stars selected only 14 were not actually detected on the Asiago plates.
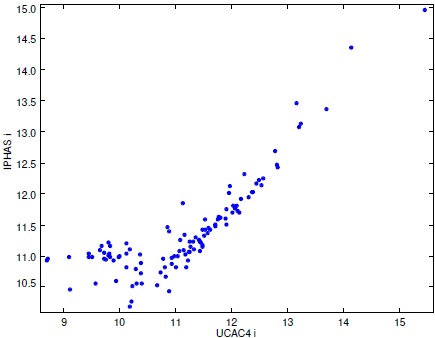
We report in Figure 1 the comparison between the natural magnitudes and the IPHAS i magnitudes for our selected stars. For stars fainter than 11 there is a good correlation between natural and IPHAS magnitudes (iphas=0.96 * natural + 0.48, rms=0.12). The fitting line is also shown in the figure. The photometric accuracy of our individual magnitudes is typically 0.15 mag, with small variations depending on the plate quality and on the star magnitude. The accuracy level of the natural magnitudes is good enough to derive meaningful light curves of Miras, but low amplitude variables are more difficult to discover. Also, the time sampling, about one plate each month, is mainly suited to search for Mira stars; in this paper therefore we do not attempt to detect small-amplitude variable stars.

Fig. 1 Comparison of our “natural magnitudes” and IPHAS2 i magnitudes for our non-variable red stars (open circles) in the field of γ Cas. Black stars are used to compute the linear correlation described in the text. The color figure can be viewed online.
A few scattered stars have magnitudes quite far from the bulk along the line. This is mostly due to coordinate mismatch and to crowding: given the short focal length of the Asiago Schmidt telescope, in some cases one star on a plate actually is a blend of separate IPHAS objects. On the other hand, the horizontal strip at the lower left of the plot is due to saturation of the IPHAS magnitudes starting at i mag about 12, as also reported in Table 1 of Barentsen et al. (2014). These problems were further confirmed when we directly compared the IPHAS with the UCAC4 magnitudes for stars present in both catalogs (see Figure 2).
Table 1 Positions and spectral types of our variable stars.
| Num | Other ID | IPHAS2 | Date-obs | Sp. Type ours | Sp. Type SIMBAD |
|---|---|---|---|---|---|
| 091 | NSVS-1638444 | J004531.42+595953.0 | 29 Nov 2016 | S7e | M7 |
| 098 | NSVS-1668925 | J004554.55+622953.4 | 30 Nov 2016 | N+dust | C |
| 132 | NSVS-1669789 | J004753.07+620245.6 | 29 Nov 2016 | N+Dust e | C |
| 198 | Dauban-V265 | J005224.44+630342.4 | 29 Nov 2016 | S7e | M8 |
| 210 | OT-Cas | J005302.81+603547.6 | 28 Nov 2016 | M4/5e | M6.5 |
| 219 | NSVS-1641101 | J005317.94+623611.4 | 29 Nov 2019 | M7 | M6.5 |
| 234 | J005351.97+625509.6 | 29 Nov 2016 | N+dust | - | |
| 297 | V867-Cas | J005628.30+604709.5 | 30 Nov 2016 | M6e | M7 |
| 303 | J005644.82+602246.3 | 30 Nov 2016 | M4Ve | - | |
| 306 | MIS-V1364 | J005701.37+611016.3 | 29 Nov 2016 | N+dust | - |
| 345 | AV-Cas | J005933.99+604318.4 | 30 Nov 2016 | M5/6e | M8 |
| 382 | J010215.28+585404.8 | 30 Nov 2016 | S3/1 | - | |
| 407 | MIS-V0818 | J010441.97+625255.6 | 30 Nov 2016 | S7e | - |
| 431 | J010558.90+614348.9 | 30 Nov 2016 | N/dust | - | |
| 442 | MIS-V1305 | J010642.86+595819.2 | 29 Nov 2016 | M7 | - |
| 462 | V890-Cas | J010744.58+590301.9 | 01 Dic 2016 | S4/4 | SX/6e |
| 500 | NSVS-1684644 | J011140.54+601138.0 | 30 Nov 2016 | N+dust | C |
| 505 | J011225.71+614146.3 | 25 Jan 2017 | M5/6 | - | |
| 506 | V418-Cas | J011259.79+621046.8 | 29 Nov 2016 | S7/2e | S |
| 509 | MIS-V1376 | J011354.32+603727.2 | 29 nov 2016 | N | - |
| 511 | J011408.65+620418.1 | 14 Feb 2017 | M0?+IS-cloud | - |
4. VARIABILITY CHECK
As a first guess for variability, for each star we examined the rms deviation σ from the mean value of the individual magnitudes; most of our stars had σ values between 0.10 mag and 0.30 mag, with a median value of 0.18 mag, which is comparable to the typical photometric error of the individual measurements (0.15 mag). We checked if the observed scatter in measured magnitudes was a function of the mean magnitude; stars fainter than ≈ 11 mag had a well behaved trend, fainter stars showed a larger σ.
Only 22 stars had σ ≥ 0.3, with 16 of them larger than 0.5, indicating large photometric variations and were therefore possible Mira candidates. One star was excluded because it is very close to the strongly saturated γ Cas star, so that its photometry proved to be unreliable, leaving us with 21 candidates. We checked in the VSX, NSVS (Wozniak et al. 2004a, b) and GCVS (Samus et al. 2017) databases to see if any of our variables was already known. Ten stars had a nice match, six stars had no match, five stars had a possible counterpart in the NSVS database but were not present in GCVS or VSX. Often the NSVS database has two or three entries with very similar coordinates, corresponding to a single real star observed in different runs. The low-amplitude variables listed in VSX were not recovered by our procedure due to the applied cutoff in the scatter of the individual measurements.
5. SPECTROSCOPIC FOLLOW-UP
Spectroscopic follow-up for the 21 candidate variable stars was done with the Loiano 1.5-m and the Asiago 1.82-m and 1.22-m telescopes: Loiano spectra were obtained with BFOSC using a 2-arcsec slit, at a step of 3.9 Å; Asiago 1.82-m spectra were obtained with AFOSC using a 2.5-arcsec slit and a step of 4.7 Å; Asiago 1.22-m spectra where taken with a Boller & Chivens spectrograph at a step of 2.3 Å. The data were reduced by means of standard IRAF procedures3.
Information from literature regarding the spectral classification of our targets was quite poor; ten stars had no previous classification, the others were classified on the basis of objective prism surveys (Ichikawa 1981; Maehara & Soyano 1987) or infrared spectra (Wright et al. 2009).
The aims of the spectral analysis were to discriminate between different late type stars and the detection of emission lines. For our purposes we considered the presence of features characteristic of the different spectral types and compared the spectra with those of templates obtained with the same instrumental setup, as in Gaudenzi et al. (2017a). The TiO molecule was present in several spectra4. VO bands of the red system were also marginally visible in the later types, with the band heads in the range 7334-7472, and 7851-7973 Å. Six stars showed evidence of ZrO molecular absorptions with band heads at 6345, 6474, 6495, 6933 Å. For these stars several templates for S type have been used at Loiano Observatory.
Seven targets are N type AGB carbon stars embedded in a circumstellar envelope. Their spectra show the C2 Swan system and the red system of the CN molecule, with different depths5.
Spectral variability is expected for all our stars; the spectral types reported in the tables correspond to the epoch of our observation. Representative spectra are presented in Figure 3.
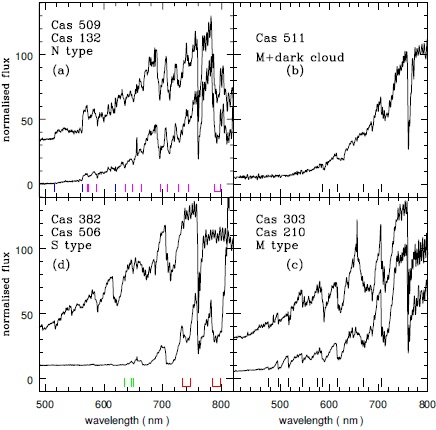
Fig. 3 Optical spectra selected among representative stars of different types. Vertical dashes indicate the band heads cited in the text: (a) blue = C2, magenta= CN; (b) and (c) black = TiO; (d) green = ZrO, red = VO. The color figure can be viewed online.
Remarkably, only 3 of our 7 carbon stars were already present in the Catalog of Galactic Carbon Stars (CGCS, Alksnis et al. 2001). All the M stars, save one (#303) are of luminosity class III.
Some of the spectra show hydrogen lines in emission at the epoch of our observation. Further, 15 non-variable stars out of our sample of 530 were also spectroscopically observed and found to be all of late M-types (M5-M8), none of them being of C or S-type.
Direct images in rGunn and iGunn (Loiano) or r Sloan and iSloan (Asiago) band were also obtained for most of the stars to check the magnitude at the epoch of the spectral observation. Comparison stars were taken from the UCAC4 catalog, as for the Asiago plates, and photometry was performed with IRAF/apphot.
We collect in Table 1 positional and spectroscopic data for our 21 stars: Column 1 lists our internal label, Column 2 other identifications from VSX or NSVS (if any), Column 3 the IPHAS catalog name (i.e. RA+DEC J2000), Column 4 the date of observation, Column 5 our spectral type, Column 6 the literature spectral type in SIMBAD, if available.
6. LIGHT CURVES
A search for periodic variations was made for all our variables using Period04 (Lenz & Breger 2004), which is basically a Discrete Fourier Technique (DFT) method. In many cases amplitude variations or long term trends were present, which made an automatic period determination difficult. In a few cases the presence of two periods could be identified.
We broadly classified the light curves according to the scheme of the GCVS (Samus et al. 2017) in four groups:
Mira, stars with nearly constant large amplitude and period;
SemiRegular (SR), stars with large but not constant amplitude and period;
Trend, stars with a long term trend of the yearly-averaged magnitude;
Irregular (Irr), stars with irregular amplitude and no clear period.
The difference between Mira and SR in our light curves is not always obvious and is somehow subjective.
Overall 10 stars showed a Mira-like light curve, 3 look semiregular, 3 are irregulars, 5 stars showed a long-term trend. Phased light curves for the most regular Miras are reported in Figure 4, light curves for Miras with double period are reported in Figure 5, SR stars and stars with clear long-term trend are reported in Figure 6, irregular variables are not shown.

Fig. 4 Phased light curves for Mira stars; black squares are data of 1981-84. The color figure can be viewed online.

Fig. 5 Miras with double periods. Upper panel, light curve for star 219 with computed double sinusoidal fit; lower panel, the same for star 442. For both stars the data of years 1981-84 have been used to compute the fit. The color figure can be viewed online.
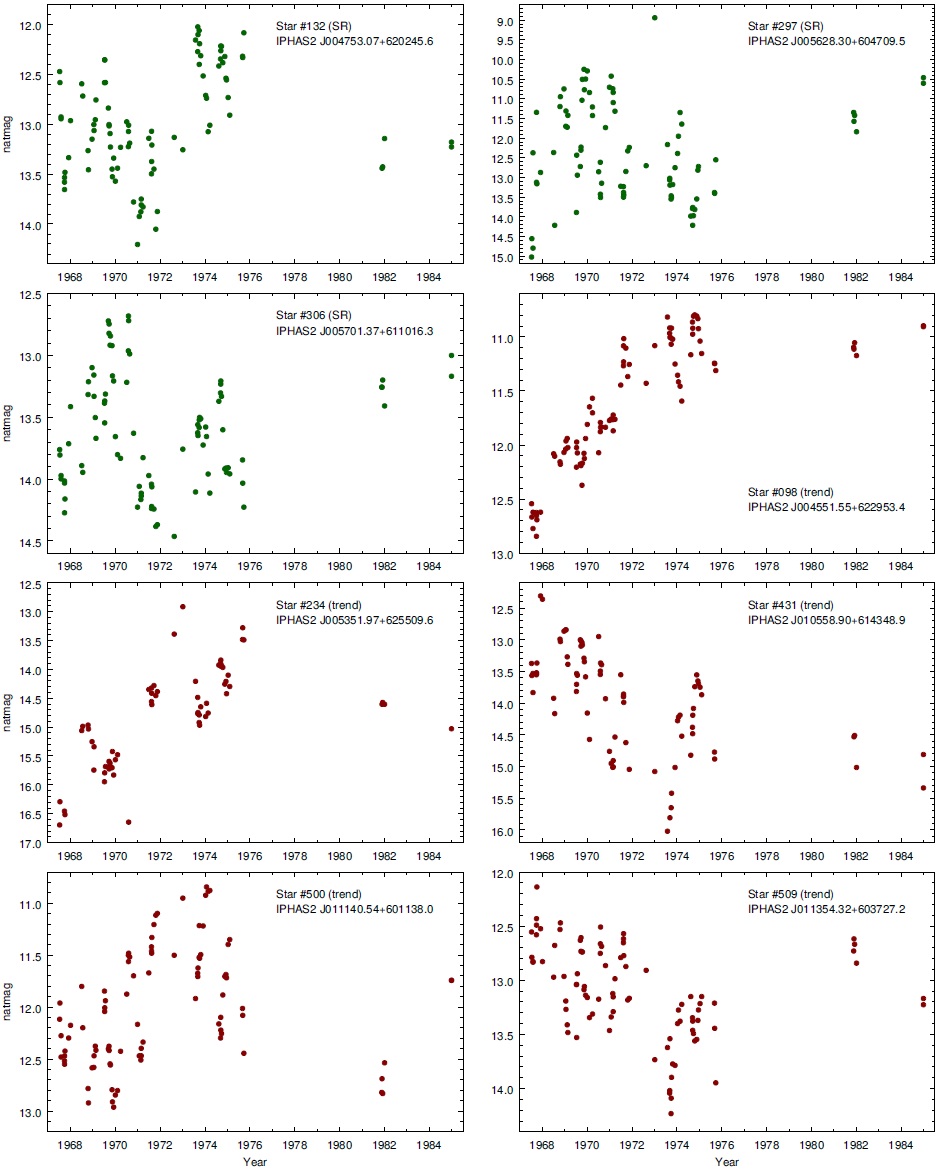
Fig. 6 Light curves of semi-regular variables (denoted with green points) and variables with long-term trend (red points). The color figure can be viewed online.
The main photometric data are compiled in Table 2: Column 1 contains our star label, Column 2 our derived period, Column 3 the average i magnitude, Columns 4 and 5 the maximum and minimum recorded magnitudes, Column 6 the shape of the light curve, Column 7 the spectral type (from Table 1), Column 8 the i magnitude at the time of our spectral observation, Column 9 the K magnitude from 2MASS (Cutri et al. 2003; Skrutskie et al. 2006), and Column 10 our estimated distance in kpc, as discussed in § 8.
Table 2 Periods, variation amplitudes and distances of our variable stars.
| Num | Period days |
i-mean mag |
i-max mag |
i-min mag |
Var. type | Sp. type ours |
i ours | K 2MASS |
D kpc |
|---|---|---|---|---|---|---|---|---|---|
| 091 | 377 | 11.52 | 9.5 | 12.8 | Mira | S7e | 12.1 | 5.40 | 4.5 |
| 098 | 0 | 11.60 | 10.8 | 12.8 | trend | N+dust | 11.2 | 4.82 | - |
| 132 | 391 | 12.99 | 12.0 | 14.2 | SR | N+dust e | 12.4 | 5.59 | - |
| 198 | 364 | 11.74 | 10.4 | 13.3 | Mira | S7e | 12.9 | 5.53 | 4.4 |
| 210 | 292 | 11.07 | 9.8 | 12.4 | Mira | M4/5e | 10.4 | 6.24 | 5.6 |
| 219 | 311 | 13.94 | 11.6 | 16.4 | Mira | M7 | 12.1 | 6.72 | 6.6 |
| 234 | - | 14.69 | 12.9 | 16.7 | trend | N+dust | 13.3 | 7.66 | -- |
| 297 | 380 | 12.34 | 9.0 | 15.0 | SR | M6e | 8.9 | 4.87 | - |
| 303 | - | 14.33 | 13.4 | 15.0 | irr | M4Ve | - | 11.56 | - |
| 306 | 294 | 13.62 | 12.7 | 14.4 | SR | N+dust | 14.1 | 7.58 | - |
| 345 | 330 | 10.43 | 9.3 | 11.8 | Mira | M5/6e | 9.8 | 5.67 | 4.9 |
| 382 | - | 11.84 | 10.8 | 12.5 | irr | S3/1 | 12.1 | 8.24 | - |
| 407 | 315 | 11.92 | 10.1 | 13.4 | Mira | S7e | 12.5 | 5.41 | 3.8 |
| 431 | - | 13.97 | 12.4 | 16.0 | trend | N+dust | - | 6.93 | - |
| 442 | 287 | 10.94 | 9.9 | 11.9 | Mira | M7 | 10.1 | 5.47 | 3.8 |
| 462 | 485 | 13.15 | 10.5 | 16.1 | Mira | S4/4 | 12.3 | 5.46 | 5.8 |
| 500 | 400 | 11.99 | 10.9 | 13.9 | trend | N+dust | 12.1 | 5.29 | - |
| 505 | 181 | 12.61 | 12.1 | 13.5 | Mira | M5/6 | 12.0 | 7.99 | 8.1 |
| 506 | 482 | 10.63 | 8.0 | 13.6 | Mira | S7/2e | 11.7 | 3.66 | 2.5 |
| 509 | 343 | 13.10 | 12.2 | 14.2 | trend | N | 13.0 | 8.13 | - |
| 511 | - | 15.01 | 14.5 | 15.5 | irr | M0?+IS | 15.3 | 8.01 | - |
Most of the Mira and semiregular variables have periods between 290 and 400 days; two S-type stars have periods of about 480 days (V418 and V490 Cas) while one star (#505) has a short period of only 181 days. All stars that show long-term trends in their light curves are carbon stars.
Below, we briefly give some details on the individual stars. The time coverage of the light curves is rather uniform for the first 7 years, although undersampled in 1972/73, and it is well suited to derive an average period, if present; the few data points obtained in the 1980’s are most useful to check the constancy in period (and/or) phase of the light curve.
6.1. Mira Stars
Star #091 (Figure 4): the star has a period of 377d with ~2 mag peak to peak amplitude. The points of the years 1982-84 are out of phase, suggesting a phase shift or a small period change in the years after 1975. The NSVS catalog has three sources very near to our position, #1638444, #1587497, #1665936.
Star #198 (Dauban V265, Figure 4): a period of 365 d fits quite well the light curve between 1967 and 1975: the later data of 1982-84 are out of phase by 0.5, indicating a probable phase shift or period change. No period is given in VSX. Possible counterparts in NSVS are #1639949 and #1673661.
Star #210 (OT Cas, Figure 4): the period of 292d fits quite well the whole dataset. The star is classified as a Mira with P = 288d in VSX, in very good agreement with our result and with the light curves of the NSVS sources #1643267 and #11671838.
Star #219 (NSVS #1641101, Figure 5): a period of 312 d is apparent, modulated by a longer period of 465 d in a 3/2 ratio, with amplitudes 1.45 and 0.36 mag respectively. NSVS #1673811 is the same star.
Star #345 (AV Cas, Figure 4): the period of 330d is overall good over the whole time interval. It is classified as a Mira with P = 322d in VSX, in good agreement with our findings. Possible NSVS counterparts are #1647501 and #1676514.
Star #407 (MIS V0818, Figure 4): a good fit is given by a period of 315d over the whole time interval 1967-84. No period is given in VSX. NSVS counterpart is #1647990.
Star #442 (MIS V1305, Figure 5): the light curve of this Mira star is well fitted by a double sinusoid, with periods 287d (amplitude 0.76 mag) and 515d (amplitude 0.11 mag). No period is reported in VSX. NSVS counterparts are #1729761 and #1681126.
Star #462 (V890 Cas, Figure 4): this star was studied as a test case for the Asiago plates by Nesci (2016), who discussed in detail its light curve. The phased light curve shows a good fit, with an average period of 485 d but appreciable amplitude variations are present in different cycles. Nesci (2016) explored the trick to double the formal period to see if the phased light curve improves but without convincing results. No counterpart is reported in NSVS.
Star #505 (Figure 4): the period of 181 d seems quite stable but the amplitude is not constant. It is by far the shortest period variable in our sample. Whitelock et al. (2000) divide the Miras with period below 225 d in two groups, “Short Period−Blue” and “Short Period−Red” depending on their infrared colors and average spectral types. The spectroscopic (M6) and photometric (NIR colors) characteristics lead us to place this star in the group of the “Short Period−Red” Miras. No counterparts are found in NSVS.
Star #506 (V418 Cas, Figure 4): a period of 482 d gives a good fit to the data, but the amplitude seems not constant. We tried to double the adopted period, as in the case of V890 Cas, but the phase plot gives an equally good fit. A period of 480 d is reported in VSX in full agreement with our findings. The NSVS counterpart is #1686590.
6.2. Semiregular Stars
Star #132 (Figure 6): a period of 391d gives a fair overall match to the data, but marked amplitude variations are present. The sum of two periods, 388 d and 5.7 years, with similar amplitudes gives a better, but not fully satisfactory, fit. The star is present as #117 in CGCS but with a 13-arcsec offset, and without a spectral classification. A possible match candidate is NSVS #1669789. Another star is at 4 arcsec distance but is 2 mag fainter in i, so the Asiago light curve is not much affected.
Star #297 (V867 Cas, Figure 6): a period of 380d reproduces a few variability cycles, but both period and amplitude changes are apparent in the light curve. Faint (I = 16) minima were recorded in 1967 and 1974 and a very bright maximum (I = 9) in 1973. A longer period of 410 d, with a large uncertainty, was reported by Nakashima et al. (2000) but is not reported in VSX. No counterparts are present in NSVS.
Star #306 (MIS V1364, Figure 6): This star is an optical double with a separation of 2” and therefore it is not resolved in the Asiago plates. Both components are present in the IPHAS catalog, the redder one being our N-type variable. A period of 294d describes the overall behavior but the amplitude is clearly not constant in different cycles, ranging from 1 to 2 mag, peak to peak. The presence of the stable star (i = 14.44) within the PSF of the Asiago plates limits the actual variability range detected. No period is given in VSX. No counterparts are listed in NSVS, and it is not listed in CGCS.
6.3. Trend Stars
Star #098 (Figure 6): the star is listed in the CGCS (#110), but without a spectral classification. Counterparts in NSVS are #1669789 and #1636119.
Star #234 (Figure 6): the star has small amplitude variations and a long term trend of its average level. This star has no counterparts in NSVS and is not listed in CGCS.
Star #431 (Figure 6): a time scale of about 330 d is apparent, superimposed on a long term trend of the mean flux. An inversion of this trend after 1974 is also present. It has counterparts in NSVS, and it is not listed in CGCS.
Star #500 (Figure 6): a long term oscillation is superimposed on the main period of ≈ 400d. This star is present in the KISO catalog (KISO C1-137) of carbon stars and it is listed in the CGCS (#183), but again without a spectral classification. NSVS counterparts are #1684644 and #1733537.
Star #509 (MIS V1376, Figure 6): the star shows a long term monotonic decreasing trend from 1967 to 1975, with wide oscillations of about 1 magnitude, but without a clear period. In the years 1982-85 the magnitude of the star was again at the level of 1967, indicating an inversion of the long term trend. It is classified as SR in VSX. A possible counterpart in NSVS is #1686429 but with only 180 days of coverage and scattered points with small amplitude variability. It is not listed in CGCS.
6.4. Irregular Stars
Star #303: the light curve shows a 1 mag peak to peak amplitude. The spectrum is the only one of luminosity Class V in our sample. It shows (see the bottom right plot of Figure 3) very strong Balmer lines in emission from Hα to Hγ. To understand the origin of these features and of the luminosity variability a denser photometric and spectroscopic monitoring with higher resolution would be necessary. Its proper motion is 20 mas/yr in the URAT1 catalog, or 45 mas/yr in UCAC5, parallel to the galactic plane; it is of the expected order of magnitude for a relatively nearby dwarf. The Gaia DR2 catalog, published while this paper was under revision, gives a distance of 185 pc (parallax 5.41 mas) and a proper motion of 26 mas/yr, confirming its dwarf nature.
Star #382: this is the only irregular variable among our S-type stars and it is by far the hottest of them.
Star #511: this star shows a few widely scattered points in the plates of 1967 and one in 1970; these points produce the observed large rms deviation from the mean; excluding these points, the star shows small variations, comparable with the photometric uncertainty. It is behind the dark cloud LDN 1312, which affects the color indices and hampers a reliable classification of spectral type and luminosity class. The few, strongly veiled, absorptions and the absence of molecular bands in the reddest part of the spectrum suggest a spectral type between late K and early M.
7. COLOR-COLOR PLOTS
The plot of the original IPHAS2 r−h vs r−i colors for our variables is shown in Figure 7. Hα emission line stars are expected to have a large r − h color, and cooler stars a larger r − i. Our M-type giant stars, ranging from M5 to M7, are distributed all along the diagonal of this plot. Our rather late (S7) S-type stars are in the upper-right area, while the hot S3 star #382 lies in the lower left corner, in the zone occupied by the dusty, strongly variable C-type stars. Two stars are worth of a short mention:
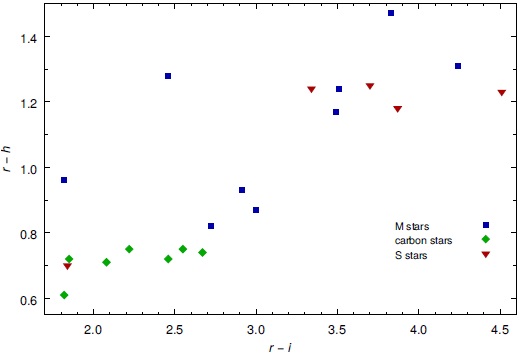
Fig. 7 The r − h vs. r − i color plot for our variables. Spectral types are coded with different symbols: squares = M stars; diamonds = carbon stars; triangles = S stars. Most of the stars are distributed along a diagonal path from lower left to upper right. The S-type star at the lower left corner is the upper left part of the plot are #210 and #303. The color figure can be viewed online.
(1) Star #303: the IPHAS2 colors (r − i = 1.85, r − h = 0.97) put this star in the locus of the unreddened ones (see figures 15-17 of Barentsen et al. 2014); together with its spectral classification as a main sequence star, this implies a short distance and a low interstellar absorption.
(2) Star #210: its colors (r − i = 2.5, r − h = 1.3) put the star in the region of strong Hα emitters. Our spectrum shows a faint Hα emission, but Hβ, Hγ and Hδ are present. The IPHAS r and Hα magnitudes are not saturated (see Table 1 in Barentsen et al. 2014 for threshold values), while i may be partially affected. Our measure of r − i, taken when the star was in a bright state (see Table 2), is 2.1 mag, significantly bluer than the IPHAS2 value.
Overall, the spectral types of our stars are rather scattered in this plot, so it is of little use for a reliable spectral classification. Only obscured carbon stars are segregated in a well defined area: therefore the IPHAS colors, in connection with infrared (J H K) plots, are very useful to select this type of stars with sufficient confidence.
We cross-correlated the positions of our detected IPHAS stars with the 2MASS and WISE (Cutri et al. 2013) catalogs, in order to build color-color plots and look for useful correlations. Nearly all of our 530 stars have a counterpart in these catalogs. We plot in Figure 8 the J −H, H −K diagram of our variables, together with our non-variable stars with determined spectral type; the separation of Mira, SR and Irr is not well defined in this plot. Most carbon stars are easily discriminated by their very red colors. M-type Mira variables appear on average below the non-variable stars, a result already found e.g. in Menzies & Whitelock (1985), Whitelock et al. (1994) and recently in Gaudenzi et al. (2017b) for high galactic latitude stars. The irregular variable in the lower left corner is the main sequence star #303: its position is consistent with the expectation from the Bessell & Brett (1988) color-color diagram.
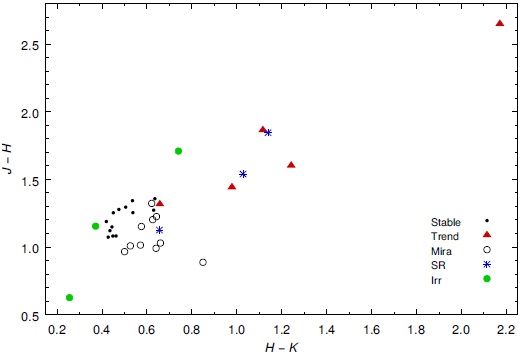
Fig. 8 The J −H, H −K diagram of our variables. The carbon star #234 is located at the upper-right corner; the main sequence star #303 is at the lower left corner. Variability type is coded as follows: open circles = Mira; blue stars = semiregular variables; filled red triangles = stars with a long term trend; filled green circles = irregular variables; dots = non-variable (stable) stars. The color figure can be viewed online.
Our stars are quite bright (w1<8 mag) in the WISE catalog and therefore possibly saturated (see Nikutta et al. 2014). We explored several color-color plots, but they did not add significant informations for our stars.
We found no clear trend between any color index and the period length for any kind of variables.
8. DISTANCE ESTIMATES
The sky area around γ Cas is near the galactic plane, so that strong and inhomogeneous absorptions in the optical and NIR bands are expected. An indication of the existence of such absorptions is given by the IRAS 12μ emission map, shown in Figure 9 overplotted on our 530 stars. A prevalence of stars in the upper part of the figure, richer in cold emission features, is evident, but this is not true for our variable stars which are distributed more evenly in declination.

Fig. 9 The IRAS emission map (negative) at 12 microns of IRAS centered on γ Cas. The stars with r − i > 1.7 mag are shown as (yellow) triangles, our variables are (red) squares. The color figure can be viewed online.
We have tried to estimate the distances to the Mira stars. For this purpose we computed their absolute K magnitudes using the relation given by Whitelock (2012), based on a sample of Miras with parallaxes measured by Hipparcos:
Then the distance D was computed from
AK being the absorption in front of the star.
Given the variability of a Mira star, its 2MASS K magnitude is somewhat different from its average value, which should actually be used to derive the distance. The peak-to-peak amplitude in this band is about 0.6 mag (Whitelock et al. 2000), with only a few stars reaching 1 full magnitude amplitude, so a reasonable estimate of the uncertainty on MK is 0.3 mag.
An estimate of the absorption along the line of sight can be attempted in different ways. A recent evaluation of a 3D absorption map in our region was made by Sale et al. (2014) on the basis of the IPHAS survey with a nominal resolution of 10 arcmin2. We used this to estimate the absorptions of our 21 variables assuming a distance of 2.3 kpc (the Perseus Arm), finding AV values ranging from 1.0 to 3.1 (mean value 1.86); this corresponds to a range in AK from 0.1 to 0.3 (Schelgel et al. 1998).
An independent way to estimate the absorption uses the observed J − H, H − K colors of our stars, assuming as intrinsic values the average of the Miras at high galactic latitude in the GCVS. Mira stars occupy a well defined region in the J −H, H −K diagram (see e.g. Whitelock et al. 1994) centered at J − H = 0.91, H − K = 0.53; the mean colors of our Miras are J −H = 1.07, H −K = 0.62, giving a color excess E(B − V) = 0.62 and a K-band absorption of 0.23 mag, in good agreement with the Sale et al. (2014) estimate.
A further estimate of the absorption for each Mira star can be made using the relation between the period and the intrinsic (J −K)0 color according to Whitelock et al. (2000):
In any case the expected absorption in K band is at most a few tenths of a magnitude, comparable to, or smaller than, the uncertainty of the actual mean value of the K apparent magnitude for each star.
To search for evidence of dust near our stars, we made a careful inspection of the WISE w3 (11.6μ) images for all the variables reported in Table 2. Only 6 stars showed nearby nebulae and are reported in Table 3. In four cases the stars seem to be outside the apparently nearby nebulae, while only one of them (#505) looks embedded in substantial emission. Its position on the sky in Figure 9 is at galactic coordinates l = 125.42 b = −1.07.
Table 3 Variable red stars with surrounding/nearby emission at 11.8μ.
| Num | Sp. type | Var | Nebula |
|---|---|---|---|
| 132 | N+dust | SR | nebula at NE |
| 219 | M7 | Mira | faint diffuse emission |
| 290 | M5 | Irr | difusse light from γ Cas |
| 306 | N+dust | SR | strong emission to E and S |
| 505 | M5/6 | Mira | subst bkg emission |
| 509 | N | Trend | subst emission around |
From equation 3, a variation of 0.4 mag gives a variation of about 20% in the computed distance; the combined uncertainty of the actual mean K value and interstellar absorption on average should not be larger than 0.4 mag, so we guess that our estimated distances have an uncertainty of ≈ 20%.
Adopting the absorption estimate from the J − K excess (equation 4), we derived the distance for each Mira reported in the last column of Table 2: these distances range from 2.5 to 8.1 kpc, with a median value of 4.9 kpc. We found no clear correlation of the star distances with their position in the sky.
The Gaia DR2 astrometric catalog (Gaia coll. 2018; Lindegren et al. 2018) was published after the paper was submitted for publication. All our Miras are present in the Gaia database, with errors on the parallax ranging of 0.08 to 0.27 mas and a median value 0.13 mas. This implies an accuracy of 13% if the distance is 1 kpc but only ≈ 50% at 4.5 kpc, which is the median distance of our stars (estimated from the period-luminosity relation). In particular, for 4 stars (#091, #219, (#407, #462) the Gaia parallax has an error comparable to the formal value, for 2 stars (#210, #505) it has an uncertainty of about 40%, and for 4 stars (#198, #345, #442, #506) between 20% and 30%. Furthermore, many parameters describing the overall quality of the Gaia astrometric solution of our stars (most notably astrometric gof al, astrometric excess noise, astrometric weight al) are quite bad, so the actual uncertainties of the parallaxes are surely significantly larger than the formal values.
Under these conditions, the statistical meaning of the distance derived as inverse of the parallax is very ill-defined (see Bailer-Jones 2018, and Lauri et al. 2018), even for our 4 best cases so that a comparison of the photometric and trigonometric parallax for a given star is not very meaningful.
9. CONCLUSIONS
We found 21 large amplitude variables in the sky region studied: 10 Miras, 3 semiregular, 3 irregulars and 5 with long term trends. The two stars with the longest periods, about 480 days, have an S-type spectrum. Only one short period (180 days) Mira was found.
Only 13 of these stars were already listed in the VSX or GCVS catalogs of variable stars, but only 4 of them had a published period: our search has therefore substantially improved the number of large amplitude red variables known in this sky area, and has provided a robust period determinations for all of them, completing the sample up to our magnitude level.
For comparison, we refer to the result of a similar search made on plates taken with the same telescope and emulsion (Gasperoni et al. 1991) in a nearby 5 × 5 degrees field centered on IC 1805 (l = 134.5, b = +1.0). These authors found 28 red variables, 12 of them being Miras: given the similarity of the galactic region explored, the number of Miras found in the two fields is consistent, assuming a Poisson statistics uncertainty.
We remark that all (and only) the N-type stars with strong infrared excess show long term trends in their light curves. Our time base is too short to establish if any periodicity exists in these long term trends. A similar result was found, for instance, by Whitelock et al. (2003 and references therein) in the LMC. If these trends are erratic, the most reasonable interpretation is a mass loss variation and the presence of circumstellar envelopes of variable density, producing variable dimming and brightening without a definite periodicity. A dynamical model approach to this problem may be found in Hofner et al. (2016) and references therein; recent applications to carbon star atmospheres may be found in Rau et al. (2017) and references therein.
Finally, we note that, rather surprisingly, most of our Mira variables have a photometric distance beyond the Perseus Arm. Overall, we feel that a measure of the actual distances of our Mira stars must wait for future improved releases of the Gaia catalog after the end of the scheduled 5 years of observations, and for possible improvements of the periodluminosity relation based on more nearby Miras with high-quality Gaia parallaxes.

