


 nueva página del texto (beta)
 Inglés (pdf)
 Artículo en XML
 Referencias del artículo
 Enviar artículo por email
 Citado por SciELO
  Similares en
SciELO
Similares en
SciELO 
 Permalink
1. INTRODUCTION
The globular cluster NGC 4147 is a faint and distant cluster some 19 kpc from the Sun and 21 kpc from the Galactic Center (α = 12h 10m 06s, δ = +18º32’31.8’’, J2000; l = 252.84º, b = +77.18º). It is one of the globular clusters immersed in the Sagitarius Stream and it has been suggested that originally it may have been a cluster member of the Sagittarius dSph galaxy (Bellazzini et al. 2003a, 2003b). Its classification as an Oosterhoff type I (Oo I) (Castellani & Quarta 1987) was controversial given its low metal abundance, blue horizontal branch (HB) and the large fraction of RRc type stars among the RR Lyrae population. This classification was confirmed by Arellano Ferro et al. 2004 (hereinafter AF04) from the revised periods of the RR Lyrae stars, and by Stetson, Catelan & Smith (2005) (hereinafter SCS05) from the RR Lyrae distribution in the amplitude-period plane. It is probably the most metal poor globular cluster among the Oosterhoff type I clusters. However, considerations such as the HB structure and amplitude-period distribution of the RRc stars, trigger the possibility that the clusters is of Oosterhoff intermediate type (Oo-Int) and of extragalactic origin, as shall be discussed later in this paper.
The cluster variable stars were studied by AF04 in the V and R band passes and the light curves of the RR Lyrae were Fourier decomposed to estimate the mean metallicity and distance to the cluster. However, since then, we have improved upon several procedures related to the data reductions (Bramich et al. 2013) and transformations to the standard system, on the usage of the semi-empirical calibrations and their zero-points to estimate physical properties of RRab and RRc stars in a very homogeneous way (Arellano Ferro et al. 2013; 2017), and have expanded the critical analysis of the RR Lyrae distribution on the colour magnitude diagram (CMD) to a family of clusters of both Oosterhoff types I and II (Oo I and Oo II) (e.g. Yepez et al. 2018). A Fourier decomposition of both RRab and RRc stars was also performed by SCS05. In both the above studies, it became clear that the light curves morphology in all the five known RRab is peculiar, due to the observed amplitude modulations of their light curves (AF04) and consequently the display of a large parameter morphology Dm (SCS05), which reveals the light curve as unsuitable for metallicity calibration. This is probably the reason why both AF04 and SCS05 found a much higher metallicity for the cluster. Among the RRc stars, numerous anomalies in the rather long period variables (V11, V13, V16, V17) were encountered in the above papers, such as erratic phasing and amplitude modulations that may be connected with the presence of secondary frequencies and/or the Blazhko effect. Thus, a reconsideration of the stellar physical quantities as obtained from the Fourier light curve decomposition is in order. For all the above reasons, the cluster was observed in 2012 with the aim of enriching the data collection and time-base for a proper comparison with previous discussions and to set the metallicity and distance to the cluster in the homogeneous scales of a family of some 24 clusters presented by Arellano Ferro et al. (2017) from the Fourier decomposition approach and their inference on the MV −[Fe/H] relation.
The paper is organised as follows; we describe our observations and data reductions as well as the transformation to the Johnson-Kron-Cousins photometric system in § 2; we perform the identification of the known variables and estimate the cluster reddening in § 3; we calculate the physical parameters via the Fourier decomposition for RR Lyrae stars in § 4; we discuss the peculiarities of some individual stars in § 5; we comment on the distance to the cluster via several methods in § 6; we discuss the CMD and the isochrone and zero age horizontal branch (ZAHB) fitting in § 7; the Oosterhoff type of NGC 4147, the cluster position in the Oosterhoff gap and hence its possible extragalactic origin are the topics treated in § 8; we present NGC 4147 in the perspective of the MV -[Fe/H] relation determined from RRc stars in a family of globular clusters in § 9; and finally we summarise our results in § 10.
2. OBSERVATIONS AND REDUCTIONS
2.1. Observations
The CCD observations in the Johnson-KronCousins VI-bands used in the present work, were obtained between 5 February and 29 April 2012 with the 2.0m-telescope at the Indian Astronomical Observatory (IAO), Hanle, India, located at 4500 m above sea level in the Himalaya. The detector was a SITe002 CCD of 2048×2048 pixels with a scale of 0.296 arcsec/ pix, translating into a field of view (FoV) of approximately 10.1×10.1 arcmin2. Our data consisted of 153 V and 121 I images. Table 1 gives an overall summary of our observations and the seeing conditions.
Table 1 Distribution of observations of NGC 4147.*
| Date | NV | tV (s) | NI | tI (s) | Avg seeing (“) |
|---|---|---|---|---|---|
| 2012-02-05 | 35 | 140-350 | 18 | 30-150 | 2.5 |
| 2012-02-28 | 20 | 170-250 | 19 | 50-120 | 1.7 |
| 2012-02-29 | 12 | 300-450 | 11 | 90-250 | 3.0 |
| 2012-03-01 | 35 | 240-350 | 35 | 85-120 | 2.4 |
| 2012-04-02 | 18 | 150-300 | 19 | 60-150 | 2.2 |
| 2012-04-11 | 7 | 250-300 | 7 | 110-150 | 2.5 |
| 2012-04-28 | 11 | 300-350 | 2 | 100-150 | 2.7 |
| 2012-04-29 | 15 | 220-300 | 10 | 100-200 | 2.2 |
| Total: | 153 | 121 |
*Columns NV and NI give the number of images taken with the V and I filters respectively. Columns tV and tI provide the range of exposure times. In the last column the average seeing is listed.
2.2. DIFFERENCE IMAGE ANALYSIS
Image data were calibrated using bias and flatfield correction procedures. We used the difference image analysis (DIA) to extract high-precision timeseries photometry of all point sources in the field of the cluster. We used the DanDIA1 pipeline for the data reduction process (Bramich et al. 2013), which includes an algorithm that models the convolution kernel matching the PSF of a pair of images of the same field as a discrete pixel array (Bramich 2008). A detailed description of the procedure is available in the paper by Bramich et al. (2011), to which the interested reader is referred for the relevant details.
We used the methodology of Bramich & Freudling (2012) to solve for the magnitude offset that may be introduced into the photometry by the error in the fitted value of the photometric scale factor corresponding to each image. The magnitude offset due to this error was of the order of ≈ 5 mmag.
2.3. Transformation to the VI Standard System
From the standard stars of Stetson (2000) 2 in the field of NGC 4147, we identified 337 stars in the FoV of our images, with V in the range 14.6-21.5 mag and V-I within 0.0-2.37 mag. These stars were used to transform our instrumental system to the JohnsonKron-Cousins photometric system (Landolt 1992). The standard minus the instrumental magnitude differences show a mild dependence on the colour, as displayed in Figure 1. The transformation equations are given in the corresponding panel of Figure 1. The resulting VI photometry for all variables in our FoV is published in Table 2 which is an extract from the full table, available in electronic format. The corresponding data from 2003 (AF04) can be found in the CDS web site.3
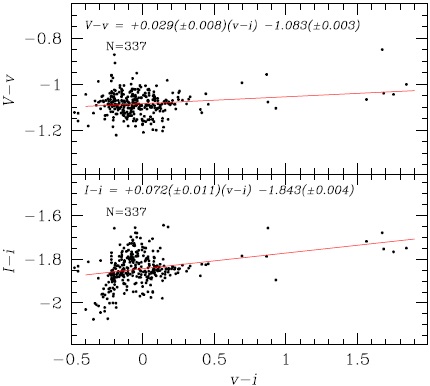
Fig. 1 The transformation relationship between the instrumental and standard photometric systems using a set of standards of Stetson (2000) in the FoV of our images of NGC 4147. The color figure can be viewed online.
Table 2 2012 Time-series VI photometry for confirmed NGC 4147 variables.
| Variable Star ID | Filter | HJD (d) | Mstd (mag) |
|---|---|---|---|
| V1 | V | 2455963.23776 | 17.325 |
| V1 | V | 2455963.24476 | 17.339 |
| ⋮ | ⋮ | ⋮ | ⋮ |
| V1 | I | 2455963.22529 | 16.512 |
| V1 | I | 2455963.22752 | 16.542 |
| ⋮ | ⋮ | ⋮ | ⋮ |
| V2 | V | 2455963.23072 | 16.708 |
| V2 | V | 2455963.23776 | 16.616 |
| ⋮ | ⋮ | ⋮ | ⋮ |
| V2 | I | 2455963.22529 | 16.187 |
| V2 | I | 2455963.22752 | 16.197 |
| ⋮ | ⋮ | ⋮ | ⋮ |
3. VARIABLE STARS IN NGC 4147
All confirmed variable stars in our FoV are listed in Table 3 along with their mean magnitudes, amplitudes, and periods. The coordinates listed in Columns 10 and 11 were taken from the Catalogue of Variable Stars in Globular Clusters (CVSGC) (Clement et al. 2001). For comparison, we include in Column 7 the periods as listed by SCS05, and it should be noted that in some cases the periods are significantly different from the ones found from our data, listed in Column 9. For stars with light curves poorly covered by our photometry we have adopted the period of SCS05. The light curves of the RR Lyrae stars are shown in Figure 2.
Table 3 General data for all confirmed variables in NGC 4147 in the FoV of our images.*
| Variable Star ID | Variable Type |
|
|
AV (mag) | AI (mag) | P (SCS05) (d) | HJDmax (+2 450 000) | P (this work) (d) | RA (J2000.0) | DEc (J2000.0) |
|---|---|---|---|---|---|---|---|---|---|---|
| V1 | RRab Bl | 17.066 | 16.535 | 1.05 | 0.70 | 0.500403 | 5988.49483 | 0.500393 | 12:09:59.38 | +18:31:48.4 |
| V2 | RRab Bl | 17.089 | 16.600 | 1.161 | 0.65 | 0.493180 | 5988.3470 | 0.493297 | 12:10:04.96 | +18:32:04.5 |
| V3 | RRc | 17.031 | 16.710 | 0.485 | 0.333 | 0.2805427 | 5986.5186 | 0.280543 | 12:10:04.38 | +18:31:58.5 |
| V4 | RRc | 17.047 | 16.750 | 0.482 | 0.389 | 0.300031 | 5963.2723 | 0.300066 | 12:20:06.39 | +18:32:50.2 |
| V6 | RRab Bl | 16.941 | 16.455 | 1.208 | 0.810 | 0.609730 | 5963.3748 | 0.609737 | 12:10:08.51 | +18:33:00.0 |
| V7 | RRab | 17.066 | 16.567 | 1.301 | 0.823 | 0.514245 | 5986.4396 | 0.514321 | 12:10:06.66 | +18:32:39.7 |
| V8 | RRc | 16.828 | 16.558 | 0.431 | 0.309 | 0.278652 | 5963.4587 | 0.278599 | 12:10:06.95 | +18:32:34.8 |
| V10 | RRc | 17.020 | 16.585 | 0.421 | 0.302 | 0.352301 | 5963.2378 | 0.352339 | 12:10:03.74 | +18:31:48.4 |
| V11 | RRc | 16.867 | 16.471 | 0.380 | 0.269 | 0.387419 | 5963.3836 | 0.387423 | 12:10:05:53 | +18:31:51.8 |
| V12 | RRab | 17.199 | 16.858 | 1.164 | 0.882 | 0.504700 | 5986.5132 | 0.504700 | 12:10:06.70 | +18:32:28.4 |
| V13 | RRc | 16.701 | 16.322 | 0.385 | 0.282 | 0.408320 | 5963.3660 | 0.408319 | 12:10:06.37 | +18:32:14.1 |
| V14 | RRc | 16.914 | 16.483 | 0.432 | 0.233 | 0.356376 | 5963.4586 | 0.356375 | 12:10:06.94 | +18:32:32.4 |
| V16 | RRc | 16.707 | 16.211 | 0.388 | 0.257 | 0.372259 | 5963.4587 | 0.372134 | 12:10:07.35 | +18:32:40.1 |
| V17 | RRc | 16.968 | 16.512 | 0.453 | 0.285 | 0.371229 | 5988.3095 | 0.374843 | 12:10:10.67 | +18:34:51.2 |
| V18 | SR | 13.929a | 12.391a | 0.2 | - | - | - | 24.8 | 12:10:05.63 | +18:32:11.6 |
| V19 | RRc | 17.03a | 16.72a | 0.28a | 0.14a | 0.273933 | - | - | 12:10:21.98 | +18:35:02.1 |
| V20 | SR | 14.98 | 13.87 | >0.06 | >0.1 | - | - | - | 12:07:33.22 | +18:49:14.2 |
aValue taken from SCS05.
*Period estimates from SCS05 are listed in Column 7 for comparison with our periods listed in Column 9.
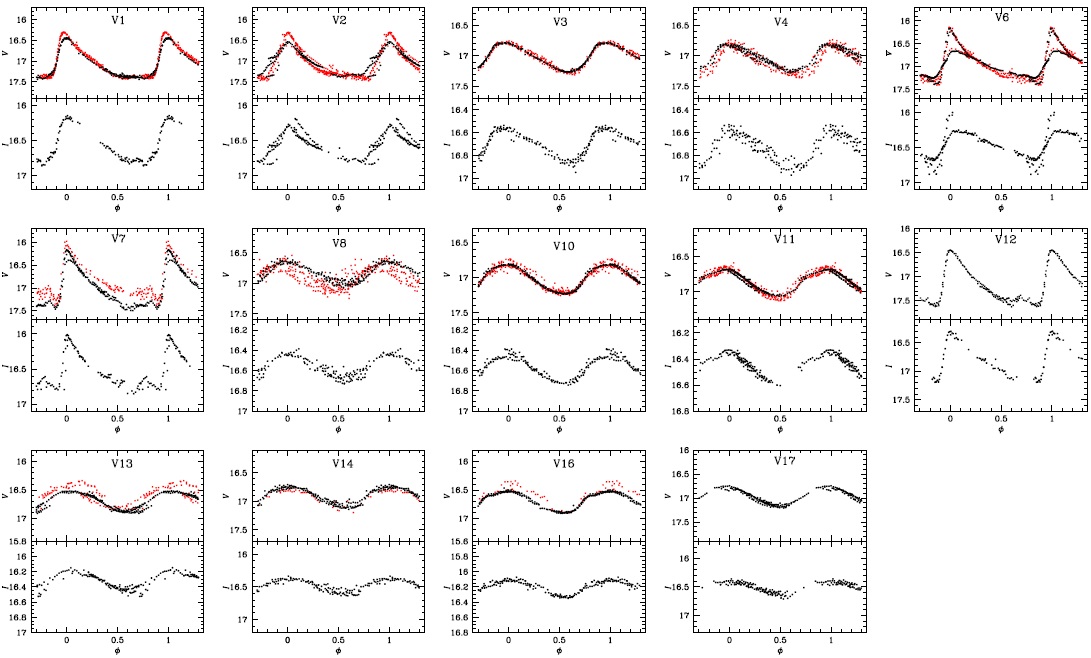
Fig. 2 Light curves of the RR Lyrae stars in NGC 4147 phased with the periods listed in Table 3. In the upper panels, red symbols correspond to data from 2003 and black to data from 2012. The color figure can be viewed online.
All known variables in NGC 4147 are identified in the charts of Figure 3 for the cluster peripheral and core regions.
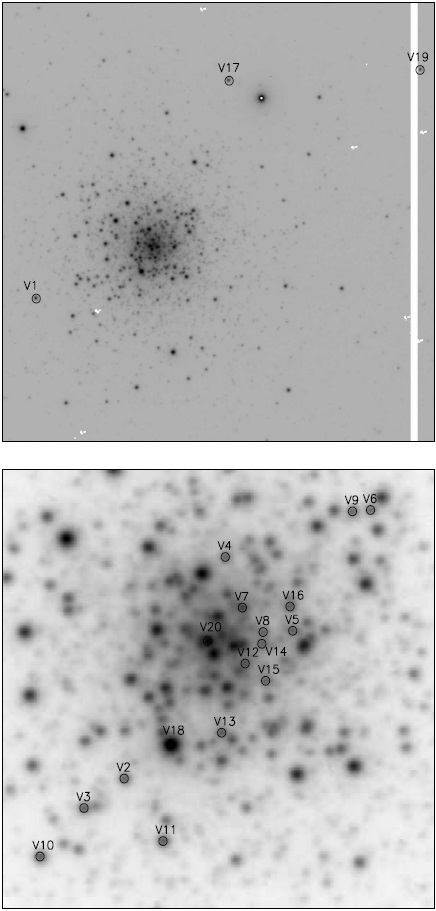
Fig. 3 Identification charts of all known variables in the field of NGC 4147. The field size in the upper and lower frames is 6 × 6 and 1.5 × 1.5 arcmin2 respectively. In both frames North is up and East is to the right.
3.1. Reddening
It is well known from the work of Sturch (1966) that RRab stars have nearly the same intrinsic colour (B − V)0 at minimum light. The value (V − I) 0;min = 0.58 ± 0.02 was calibrated by Guldenschuh et al. (2005). We have used these results to calculate the reddening of four RRab stars in NGC 4147 from their minimum value in V-I and found an average E(V − I) = 0.010 ± 0.003. Taking E(V-I)/E(B-V)= 1.259 (Schlegel et al. 1998) we get an average E(B-V)= 0.008 ± 0.002. This value is a little smaller than the value 0.02, listed by Harris (1996) or the value given by the reddening maps of Schlafly & Finkbeiner (2011) 0.022. We shall adopt E(B-V)= 0.01 in the remainder of the paper.
4. PHYSICAL PARAMETERS OF RR LYRAE STARS
Physical quantities of individual RR Lyrae stars can be estimated via the Fourier decomposition of the light curve and the employment of ad-hoc welltested calibrations. A full description of the method and the specific calibrations and their zero points used in a homogeneous way in several of our previous papers for a family of globular clusters, can be found in the paper by Arellano Ferro, Bramich & Giridhar (2017). For briefness we do not reproduce the details here; however, for the sake of clearness in the nomenclature we remind the reader that the light curve can be represented by the equation,
where m(t) is the magnitude at time t, P is the period, and E is the epoch. A linear minimization routine is used to derive the best fit values of the amplitudes Ak and phases ϕk of the sinusoidal components. From the amplitudes and phases of the harmonics in Eq. 1, the Fourier parameters, defined as ϕij = jϕi − iϕj, and Rij = Ai /Aj, are computed.
We have argued in previous papers in favour of the calibrations developed by Jurcsik & Kovács (1996) and Kovács & Walker (2001) for the iron abundance and absolute magnitude of RRab stars, and those of Morgan, Wahl & Wieckhorts (2007) and Kovács (1998) for RRc stars. The effective temperature Teff is estimated using the calibration of Jurcsik (1998). These calibrations and their zero points have been discussed in detail in Arellano Ferro et al. (2013).
The calculation of the physical quantities is very sensitive to the morphology of the light curve and spurious results can be obtained if light curves with peculiarities are considered, for example those with amplitude and/or phase modulations, or cases of incomplete light curves. In particular, for the calculation of [Fe/H] in RRab stars, Jurcsik & Kovács (1996) and Kovács & Kanbur (1998) have defined a “compatibility parameter” Dm which should be smaller than 3.0 if the light curve under analysis is consistent with the calibrators used to establish the Jurcsik & Kovács (1996) iron abundance calibration. In the present case we note that all five known RRab stars show amplitude variations, and their Dm values are all very large (Column 10 in Table 4), hence they are neither fit for [Fe/H] calculation nor for a distance estimation, since the absolute magnitude depends on the amplitudes of the first and third harmonics (Kovács & Walker 2001). Thus, they were ignored. Likewise, some peculiar RRc stars with erratic phasing (V8, V13 and V16) were also not included in the physical parameter calculations.
Table 4 Fourier coefficients of RRab AND RRc stars in NGC 4147.*
| Variable ID | A0 (V mag) | A1 (V mag) | A2 (V mag) | A3 (V mag) | A4 (V mag) | ϕ21 | ϕ31 | ϕ41 | Dm |
|---|---|---|---|---|---|---|---|---|---|
| RRab | |||||||||
| V1 | 17.066(2) | 0.440(3) | 0.164(3) | 0.131(3) | 0.084(3) | 3.855(21) | 7.981(31) | 5.864(45) | 16.7 |
| V2 | 17.089(4) | 0.413(5) | 0.229(6) | 0.108(6) | 0.054(6) | 3.674(40) | 7.581(73) | 5.435(126) | 8.4 |
| V6 | 16.941(2) | 0.343(4) | 0.211(4) | 0.152(4) | 0.105(4) | 4.092(30) | 8.314(45) | 6.241(62) | 22.7 |
| V7 | 17.066(5) | 0.454(7) | 0.177(7) | 0.145(7) | 0.108(7) | 3.850(51) | 7.722(69) | 5.686(92) | 12.4 |
| V12 | 17.197(3) | 0.431(4) | 0.195(4) | 0.146(4) | 0.088(4) | 3.781(29) | 7.933(41) | 6.071(61) | 20.5 |
| RRc | |||||||||
| V3 | 17.031(1) | 0.229(2) | 0.051(2) | 0.012(2) | 0.009(1) | 4.567(49) | 2.470(188) | 0.942(262) | |
| V4 | 17.047(2) | 0.202(3) | 0.053(3) | 0.016(3) | 0.019(3) | 4.478(78) | 1.978(242) | 0.413(209) | |
| V8 | 16.828(3) | 0.178(4) | 0.032(4) | 0.008(4) | 0.007(4) | 4.561(157) | 2.599(606) | 1.342(670) | |
| V10 | 17.020(1) | 0.211(1) | 0.025(1) | 0.014(1) | 0.009(1) | 4.672(63) | 3.616(118) | 2.124(181) | |
| V11 | 16.867(1) | 0.186 (1) | 0.007(1) | 0.015(1) | 0.007(1) | 5.252(193) | 4.243(95) | 2.242(185) | |
| V13 | 16.701(1) | 0.181(2) | 0.004(2) | 0.013(2) | 0.004(2) | 5.833(701) | 2.053(204) | 5.861(605) | |
| V14 | 16.914(2) | 0.176(3) | 0.021(3) | 0.016(3) | 0.005(3) | 4.718(173) | 3.879(230) | 1.988(732) | |
| V16 | 16.707(1) | 0.192(1) | 0.014(1) | 0.018(1) | 0.011(1) | 5.134(120) | 3.902(99) | 2.713(159) | |
| V17 | 16.968 | 0.198(3) | 0.013(3) | 0.006(3) | 0.006(3) | 4.728(311) | 3.490(712) | 5.884(589) | |
*The numbers in parentheses indicate the uncertainty in the last decimal place. Also listed is the deviation parameter Dm for the RRab stars.
Nevertheless, the value of A0 and the Fourier
light-curve fitting parameters for the 5 RRab and 9 RRc stars are given in Table 4. When amplitude variations are
present, we have taken care in fitting the maximum amplitude curve. The
corresponding physical parameters for the most stable RRc stars are listed in
Table 5. The absolute magnitude
MV was converted into
luminosity with
log(L/L⊙) =
−0.4 (MV −
Table 5 Physical parameters of the RRc stars.*
| Star | [Fe/H]ZW | [Fe/H]UVES | MV | log Teff | log(L/L⊙) | D (kpc) | M/M⊙ | R/R⊙ |
|---|---|---|---|---|---|---|---|---|
| V3 | -1.57(31) | -1.49(35) | 0.620(5) | 3.869(1) | 1.652(2) | 18.88(4) | 0.59(1) | 4.12(2) |
| V4 | -1.91(41) | -1.96(56) | 0.560(14) | 3.862(1) | 1.676(6) | 19.55(13) | 0.62(1) | 4.37(3) |
| V10 | -1.74(24) | -1.72(30) | 0.546(5) | 3.861(1) | 1.682(2) | 19.44(5) | 0.51(1) | 4.42(1) |
| V11 | -1.72(21) | -1.70(26) | 0.496(10) | 3.858(1) | 1.702(4) | 18.54(8) | 0.48(1) | 4.58(2) |
| V14 | -1.65(47) | -1.60(56) | 0.558(15) | 3.861(1) | 1.677(6) | 18.47(13) | 0.49(1) | 4.38(3) |
| V17 | -1.95(33) | -2.01(36) | 0.535(19) | 3.856(4) | 1.686(8) | 19.07(17) | 0.49(3) | 4.54(4) |
| Weighted mean | -1.72(13) | -1.68(16) | 0.571(3) | 3.861(1) | 1.671(1) | 19.05(3) | 0.52(1) | 4.30(1) |
| σ | ±0.15 | ±0.15 | ±0.040 | ±0.004 | ±0.016 | ±0.46 | ±0.06 | ±0.16 |
*The numbers in parentheses indicate the uncertainty in the last decimal places.
The resulting physical parameters of the RRc stars are summarized in Table 5. The mean values given in the bottom of the table are weighted by the statistical uncertainties. The iron abundance is given in the scale of Zinn & West (1984) and in the scale of Carretta et al. (2009). The transformation between these two scales is of the form:
Also listed are the corresponding distances. Given the period, luminosity, and temperature for each RR Lyrae star, its mass and radius can be estimated from the equations: log M/M⊙ = 16.907 − 1.47 log PF + 1.24 log (L/L⊙) − 5.12 log Teff (van Albada & Baker 1971), and L=4πR 2 σT4 respectively. The masses and radii given in Table 5 are expressed in solar units.
5. NOTES ON INDIVIDUAL STARS
In the following paragraphs we comment on certain peculiarities of specific anomalous stars.
V6. This RRab star has pronounced Blazhko amplitude modulations. Analysing the magnitude at maximum light Vm variations, AF04 estimated a likely Blazhko period of about 67.9d. In the present data we have identified three more times of maximum. In Table 6 we list the times of maximum and their corresponding magnitudes Vm. The Vm modulations are shown in first panel of Figure 4. We calculate a periodicity of 67.46d which agrees very well with the original estimation of AF04. In the central and right panels one can see that the sinusoidal model with P = 67.46d does fit the Vm modulations very well.
Table 6 Magnitude variation at maximum VM in V6 due to Blazhko effect.*
| HJDmax | V |
|---|---|
| 2452654.935 | 16.140 |
| 2452770.192 | 16.400 |
| 2452791.514 | 16.148 |
| 2452813.481 | 16.607 |
| 2452818.382 | 16.618 |
| 2455963.366 | 16.175 |
| 2455988.398 | 16.666 |
| 2456029.223 | 16.246 |
*(See Figure 3)
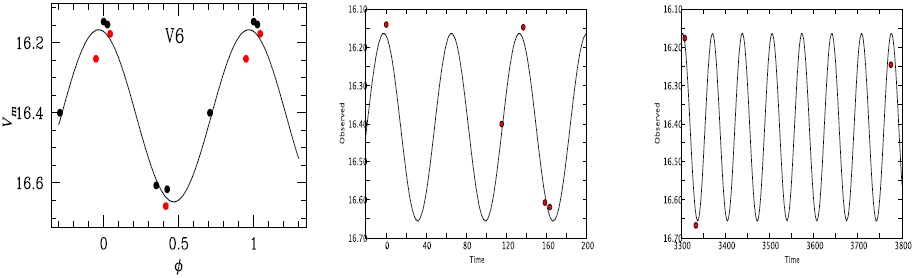
Fig. 4 The left panel shows the amplitude modulation of the Vm magnitude in V6 phased with a period of 67.46d; red symbols are observations from 2003 (AF04) and black symbols are 2012 observations from the present work. In the central and right panels the time scale in the horizontal axis is HAD-2452654.935 and the sinusoidal curve has a period of 67.46d. The color figure can be viewed online.
V12. In the paper of AF04 the V light curve is rather incomplete but shows a very large amplitude, likely due to the presence of four spurious data near minimum light. The light curve of SCS05 is of smaller amplitude with a flat bottom, attributed by SCS05 to the possible presence of an unseen companion. In the present paper the V light curve (Figure 2) is clean and complete, with an amplitude similar to that of SCS05. A comparison of all available data suggest some small amplitude modulations. The intensity weighted colour
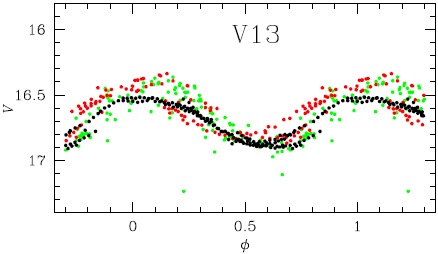
Fig. 5 V light curve of V13. Green symbols are data from SCS05, red are from AF04 and black are data from the present paper. The color figure can be viewed online.
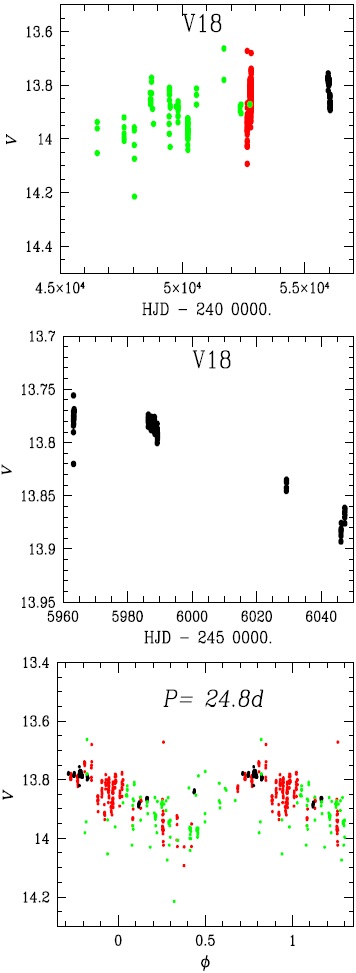
Fig. 6 Historical light variations in the V -band of the star V18. Top panel shows a long term brightening over the last nearly 27 years. Green circles are data from SCS05, red from AF04 and black from the present paper. The middle panel is an enlargement of the 2012 data that clearly show a slow light dimming. This demonstrates the variable nature of the star. The bottom panel shows the light curve phased with a period of 24.8d. We classify the star as a semi-regular red variable of the SR type. The color figure can be viewed online.
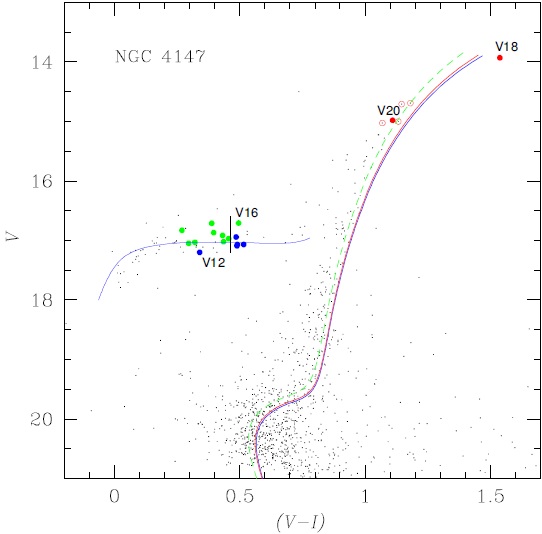
Fig. 7 CMD of NGC 4147. The plotted magnitudes and colors for all non-variable stars are magnitude-weighted means of their light curves. Variables are plotted using their intensity-weighted means
V13. This RRc star was noted by AF04 to show amplitude modulations. SCS05 in their investigation calculated a period of 0.408319d but commented that the resulting light curve is somewhat noisy. Combining AF04, SCS05 and the present paper data we found a period of 0.408318d, in excellent agreement with that of SCS05. The resulting phased V and I light curves are shown in Figures 2 and 5. In the latter we include the V data from SCS05. The V light curve displays amplitude and phase displacements. It has been suggested by SCS05 that these erratic phasing may be the consequence of interference of fundamental and first overtone pulsation modes but they failed to identify the two modes. An alternative explanation might be the interference of two modes of very similar frequencies, and at least one of them being non-radial, similar to the case of V37 in NGC 6362 (Smolec et al. 2017; Arellano Ferro et al. 2018). Detecting the two frequencies requires dense high quality observations that are not presently available for V13. Possible light contamination by an unseen companion also cannot be ruled out.
V16. Similarly to V13, this star shows erratic phasing, which was also noted by SCS05. It falls about 0.02 mag to the red of the red edge of the first overtone instability strip (Figure 7), but its position may be spurious given the amplitude and phase variations.
V18. This is the brightest star in the field of the cluster near the central region. The star was classified by AF04 as a possible RRc and later discarded as variable by SCS05, who considered the star to be a bright red giant but failed to find a convincing variability. We have reconsidered the case employing the historical data of SCS05 taken between 1983 and 2003 by an assortment of instruments, the data from AF04 taken during 24 nights between January and July, 2003, and the data of the present paper taken in 2012 as detailed in Table 1. In Figure 6, the top panel shows the long-term brightening of the star, while the panel in the middle shows the clear dimming in 2012. This demonstrates beyond doubt the variable nature of the star. The question now arises is whether the star is periodic and if so then what the period might be. We have performed a series of tests for several data blocks and found that the AF04 and 2012 data are well phased by a period of about 46.1d; the combination of all available V data suggests about half that period, 24.8d. The bottom panel shows the light curve phased with this period.
The star is saturated in our I-band images, hence we cannot calculate V-I. Adopting the
V19. This RRc star discovered by SCS04 is near the edge of our images and very near to a bad pixel column of our CCD chip, thus we were unable to secure any reliable photometry.
6. DISTANCE TO NGC 4147 FORM ITS VARIABLE STARS
The distance to NGC 4147 obtained from the Fourier decomposition of RRc stars is 19.05±0.46 kpc.
Also for the RR Lyrae stars one can make use of the P-L relation for the I magnitude derived by Catelan et al. (2004):
with log Z=[M/H]−1.765 and [M/H]=[Fe/H]− log(0.638 f + 0.362) and log f = [α/Fe] (Salaris et al. 1993). For the sake of direct comparison with the results of Fourier decomposition we applied the above equations to the I measurements of the 6 RRc stars in Table 5 and found a mean distance of 18.89±0.57 kpc, in good agreement with the Fourier results.
In principle, another approach to estimate the cluster distance is using the variables near the tip of the RGB (TRGB). We can take advantage of the fact that V18 is a semi-regular red variable of SR type, and sits near the TRGB. The method, originally developed to estimate distances to nearby galaxies (Lee et al. 1993) has already been applied by our group for the distance estimates of other clusters e.g. Arellano Ferro et al. (2015) for NGC 6229 and Arellano Ferro et al. (2016) for M5, and it is described in detail in these papers. In brief, the idea is to use the bolometric magnitude of the tip of the RGB as an indicator, which can be estimated using the calibration of Salaris & Cassisi (1997):
where [M/H] = [Fe/H] − log(0.638 f + 0.362) and log f = [α/Fe] (Salaris et al. 1993). However, as argued by Viaux et al. (2013) in their analysis of M5, the brightest stars on the RGB might not be exactly at the TRGB but somewhat dimmer, leading to an overestimation of the distance. According to these authors the TRGB may be between 0.05 and 0.16 mag brighter than the brightest stars on the RGB. For V18 in NGC 4147, if we assume that it is exactly at the TRGB, which is unlikely, we find a distance of 20.3 kpc. To bring this distance into agreement with the results from the RRc star we must assume that V18 is 0.14 mag below the true TRGB, in this case we find a distance of 19.08 kpc.
The distances found above are in excellent agreement with the values listed by Harris (1996) of 19.3 kpc and by SCS05 of 19.05 kpc.
7. THE CMD OF NGC 4147
The CMD of the cluster is shown in Figure 7, where the location of all known variables is marked. All variable stars are plotted using their intensity-weighted means
The age of NGC 4147 has been estimated via a differential approach by De Angeli et al. (2005) as 12.23 Gyr. On the other hand, SCS05 have argued that the ages of M3 and NGC 4147 are virtually identical. For M3 De Angeli et al. (2005) estimated 12.0 Gyr. We have adopted 12.0 Gyr with the aim of overplotting an isochrone on our CMD.
We have plotted the isochrone and ZAHB models from VandenBerg et al. (2014) for [Fe/H]= −1.75, Y=0.25 and [α/Fe]=0.4. The models were shifted according to the distance and reddening calculated in previous sections from the RRc and RRab stars respectively, i.e. the model parameters closely correspond to our determinations [Fe/H]=−1.72, 19.05 kpc (apparent distance modulus of 16.43) and E(B − V) = 0.01. Immediate peculiarities stand out from this exercise: the isochrone does not fit the RGB but falls to the red by about 0.05 mag (blue isochrone in Figure 7). Note that assuming E(B − V)=0.02 would make things worse. Adopting [Fe/H]=-1.80 from the listing of Harris (1996, 2010 edition) the situation improves only a little (red isochrone). It would be necessary, with this distance and reddening, to claim a much lower [Fe/H] to better fit the RGB. For the sake of comparison we plotted the isochrone for [Fe/H]=-2.0 and E(B−V)=0.0 (green dashed isochrone). While it gives better fit at RGB, it is at odds with our determined parameters.
If we look at the ZAHB, the peculiarities continue, the blue tail of the HB bends down at a redder colour than the theoretical model by about 0.1 mag. We stress that the RR Lyrae positions are correct since the red edge of the first overtone mode, i.e. the vertical black line in the CMD, falls exactly where it has been observed in other clusters. If we adopt an E(B−V) of 0.02 the problem is lessened (not fully solved) at the expense of a larger redwards shift of the isochrone.
We have not found a (V −I) CMD for NGC 4147 in the literature for a direct comparison. A comparison with the (B−V) and (B−I) CMD’s from SCS05 is not illustrative since their isochrone and ZAHB are fiducial hand-drawn lines and are not suitable for comparison with theoretical models.
8. OOSTERHOOF TYPE AND THE HB OF NGC 4147
8.1. The Oosterhoff Type
NGC 4147 has been considered as an Oo I type cluster in spite of its low metallicity and of
the rather large fraction of RRc stars,
Nc
/(Nc +
Nab) = 0.67, typical of Oo
II clusters. The reason for this is the low average period of its RRab stars,
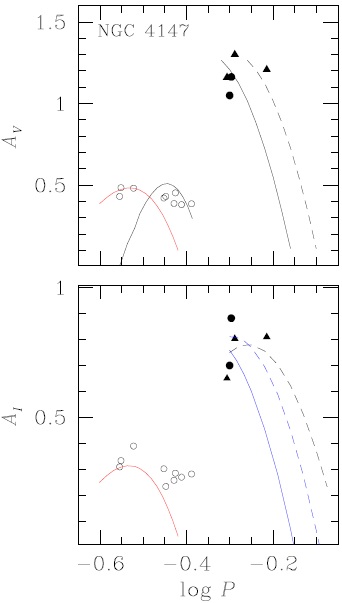
Fig. 8 The period-amplitude plane in the VI -bands for NGC 4147. Filled and open symbols represent RRab and RRc stars, respectively. Triangles represent stars with Blazhko modulations. In the top panel the continuous and segmented lines are the loci for evolved and unevolved stars in M3 according to Cacciari et al. (2005). The black parabola was found by Kunder et al. (2013a) from 14 OoII clusters. The red parabolas were calculated by Arellano Ferro et al. (2015) from a sample of RRc stars in five OoI clusters, avoiding Blazhko variables. In the bottom panel the black segmented locus was found by Arellano Ferro et al. (2011; 2013) for the OoII clusters NGC 5024 and NGC 6333. The blue loci are from Kunder et al. (2013b). The color figure can be viewed online.
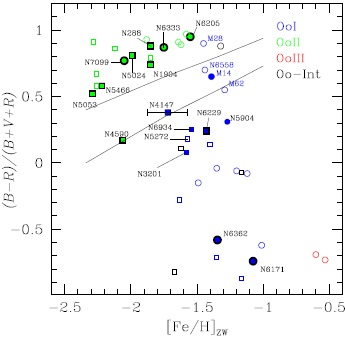
Fig. 9 Galactic globular clusters in the HB structure parameter ℒ vs. [Fe/H] plane. Circles and squares are used for inner and outer halo clusters respectively. The black-rimmed symbols represent globular clusters where the fundamental and first overtone modes are well segregated around the first overtone red edge of the instability strip, as opposed to filled non-rimmed symbols. Empty symbols are clusters not yet studied by our group. The case of M14 is adapted from Contreras Peñaa et al. (2018). The upper and lower solid lines are the limits of the Oosterhoff gap according to Bono et al. (1994). NGC 4147 stands out as the most metal poor Oo I cluster but it is obviously not the one with the bluest HB in this class (see cluster labels in blue). Its position inside the Oosterhoff gap supports the possibility of an extragalactic origin. See § 8.1 for a discussion. The color figure can be viewed online.
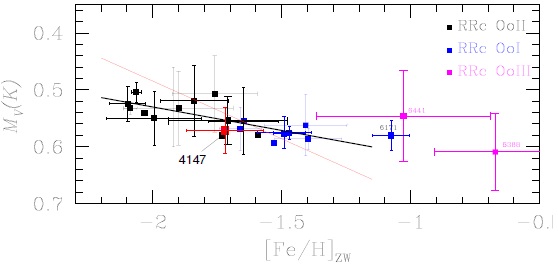
Fig. 10 The MV -[Fe/H] relation calculated via the Fourier decomposition of RRc star light curves. NGC 4147 does follow the general trend (thick black line) and it stands out as the most metal deficient of all Oo I globular clusters. Note the different slope obtained by a similar analysis for RRab stars (red line) found by Arellano Ferro, Bramich & Giridhar 2017. The color figure can be viewed online.
Another interesting feature of NGC 4147 is its HB structure parametrised by the quantity ℒ=(B−R)/(B+V +R)with B, V, R, representing the number of stars on the HB to the blue, inside and to the red of the instability strip. Figure 9 displays the positions of Galactic globular clusters on the ℒ-[Fe/H] plane. The different Oosterhoff types are indicated. Similar versions of this figure have been used to illustrate the Oosterhoff dichotomy in Galactic globular clusters, which is not present in extragalactic clusters and spheroidal galaxies (e.g. Bono et al. 1994, Catelan 2009, Contreras Peña 2018). The upper and lower limits of the Oostherhoff gap are shown by the solid lines in the figure calculated by Bono et al. (1994). This region is mostly populated by extragalactic systems, for instance those listed in Table 3 of Catelan (2009). For the sake of clearness we only display Galactic globulars in Figure 9.
The position of NGC 4147 inside the Oosterhoff gap, although marginal, is remarkable and consistent with the classification of the cluster as an OoInt type from the RRc stars amplitude distributions. This, together with association of the cluster to the Sagittarius dSph galaxy stream discussed by Bellazzini et al. (2003a, 2003b), supports the scenario that NGC 4147 was accreted by our Galaxy during the merging of the satellite Sagittarius dSph galaxy.
From Figure 9, three more clusters in the Oosterhoff gap merit our attention: M14, which has been recently argued to be an Oo-Int cluster and whose extragalactic origin also cannot be ruled out (Contreras Peña et al. 2018); NGC 6558 which is an Oo I of the old halo pupulation; and NGC 4590 an Oo II type cluster with a red HB for its [Fe/H] and which has been considered to be a relatively young cluster (Chaboyer et al. 1996). The period-amplitude diagram for NGC 4590 is an interesting one (Kains et al. 2015) since the distribution of RRab stars hints at the possibility of an Oo-Int classification.
8.2. Distribution of Pulsating Modes in the HB
NGC 4147 a cluster of low metallicity with a rather blue HB and an intermediate Oosterhoff type, has a distribution of RRab and RRc stars in the HB of particular interest, since a clean mode splitting has been found in all studied Oo II type clusters (nine so far), but only in some Oo I (four out of seven so far) (Yepez et al. 2018).
Except for the RRc V16 and the RRab V12, the distribution of RR Lyrae stars on the HB suggests a clean segregation of the RRab and RRc stars at the red edge of the first overtone instability strip at (V-I)0 = 0.45 (Arellano Ferro et al. 2016) duly reddened in Figure 7. Given the peculiarities of V12 and V16 (§ 5), we believe they can be omitted and hence we can conclude that in the case of NGC 4147 the fundamental and first overtone stars are clearly segregated in the HB.
Figure 9 illustrates the occurrence of modesplitting or mode-mixing observed in a family of clusters of both Oosterhoff types on the plane HB type-[Fe/H], as observed in recent papers of our group.
As has been discussed by Caputo et al. (1978), the mode segregation versus the mingled mode distribution in the inter-mode or “either-or” region is a direct result of the mass distribution of ZAHB stars in the instability strip, which in turn depends on the mass loss rates in the RGB (e.g. Silva-Aguirre et al. 2008). The connection of these concepts with the so called second-parameter problem is addressed in detail by Catelan (2009). Thus, it is significant that of the clusters we have revised, in all Oo II the modes are well segregated around the red edge of the first overtone instability strip (black vertical line in Figure 7), while this is observed only in some Oo I. It would be of interest to revise the RR Lyrae distributions of those clusters in the Oosterhoff gap that have been associated to dwarf galaxy satellites of the Milky Way (see Table 3 of Catelan 2009).
For the case of M14, we refer to the B−V CMD of Figure 4. in the paper by Contreras Peña et al. (2018), where it is clear that the inter-mode region is populated by both RRab and RRc stars. In passing let us point out that NGC 4590 is the Oo II type cluster with the reddest HB; still, its RRab and RRc stars are well separated.
9. NGC 4147 AND THE MV -[Fe/H] RELATION
The dependence of the HB luminosity on the metallicity of a globular cluster is now a well known fact from theoretical and empirical investigations made during the 1990’s, (e.g. Lee, Demarque & Zinn 1990, Walker 1992, Carney et al. 1992, Sandage 1993, Chaboyer 1999). In a recent paper (Arellano Ferro, Bramich & Giridhar 2017) we have studied the MV -[Fe/H] relation for families of Oo I and Oo II groups in a homogeneous way, from the results of the Fourier decomposition of the RR Lyrae light curves. We found that the slope of the relationship obtained from RRab stars is significantly different from that of the RRc stars. In Figure 10 we reproduce the MV -[Fe/H] relation for the RRc stars and place NGC 4147 using our present results for the average MV and [Fe/H]. These values are consistent with the family of Oo I clusters and do follow the general trend defined by the results from the RRc stars. Note the greater slope of the relationship when calculated from RRab stars (red line in Figure 10) determined by Arellano Ferro, Bramich & Giridhar (2017).
10. SUMMARY OF RESULTS
New differential CCD photometry of NGC 4147 in the VI -bands allowed us to revise the light curves of the RR Lyrae stars in the cluster, to discuss certain peculiarities of individual stars and calculate the mean distance and metallicity of the cluster. The Blazhko nature of V6 and its period of about 67.46d are confirmed. Erratic phasing in the RRc type stars V13 and V16, previously noticed by AF04 and SCS05, is also seen in the present data. It is suggested that it may be due to the presence of a secondary not-yet-identified frequency similar to the case of V37 in NGC 6362 (Smolec et al. 2017; Arellano Ferro et al. 2018). The controversy surrounding the variable status of V18 has been resolved now with the star clearly classified as SR variable with a period about 24.8d. The star, near the TRGB, can be used to estimate the distance to the cluster.
From the Fourier decomposition of RRc stars we calculated the averages of the metallicity and distance of the parent cluster as [Fe/H]ZW = −1.72 ± 0.15 and 19.05±0.46 kpc. It was argued that none of the RRab stars in the cluster is suitable for the calculation of physical quantities via the Fourier decomposition because their light curves present strong amplitude modulations. With the estimated metallicity, and its HB structure parameter ℒ = +0.38. NGC 4147 marginally falls in the Oosterhoff gap which may support its classification as Oo-Int and its possible extragalactic origin.
The CMD displays some peculiarities. The isochrone for ≈[Fe/H]ZW = −1.72, the distance and the reddening estimated in this work fall to the red of the RGB by as much as 0.05 mag, suggesting perhaps a lower metallicity. The blue tail of the HB was found to be too red by about 0.1 mag relative to theoretical predictions. While we do not really have an explanation for these empirical results, we stress that the red edge of the first-overtone instability strip falls where it is expected according to the results from similar analysis of other clusters. We found that the RRab and RRc stars are separated by this locus as it seems to be the case for all Oo II but only for some Oo I clusters.
Note added in proof
While this paper was in press, a further inspection of the light curves of five bright RGB stars revealed the variable nature of one of them, which we have now identified as V20 and classified it as SR. The V and I light curves are shown in Figure 11. The position on the CMD of V20 and the other four bright giants investigated but found to be non-variables are also shown in Figure 7.


