


 text new page (beta)
 English (pdf)
 Article in xml format
 Article references
 Send this article by e-mail
 Cited by SciELO
  Similars in
SciELO
Similars in
SciELO 
 Permalink
1. INTRODUCTION
NGC 5662 (l = 316º.9, b = 3º.5) is an open cluster, a concentration of late B and A-type stars, located in the Centaurus Region of the Milky Way. Few researches have been carried out on this cluster until the work of Clariá, Lapasset & Bosio (1991, hereafter CLB). Previously, it was studied by Moffat & Vogt (1973), who reported UBV photometry for 30 bright stars in the field. Haug (1978) observed 28 stars photoelectrically in the UBV and obtained a reddening and distance both in good agreement with the values found by Moffat & Vogt (1973), EB−V = 0.31 mag and d = 580 pc respectively. King (1980) determined the relative proper motions of 188 stars in the cluster area and also the probability of cluster membership for individual stars. Only half of them have more than 50% probability of being members. Until that moment only the photoelectric UBV magnitudes of 21 probable member stars were known. This lack of photometry UBV was covered in the paper of CLB. They obtained photoelectric photometry data of 237 stars brighter than V = 14 mag. in the region of the cluster with the idea of finding more members and improving the parameters, They found that the interstellar reddening varies through the cluster with a mean value of EB−V = 0.31 ± 0.04 mag. CLB obtained a linear diameter of approximately 6.9 pc, an age of 7.9 × 10⁷ years and a cluster distance of 790±55 pc. These data, together with the spectroscopic observations made by Fitzgerald et al. (1979), showed that there are chemically peculiar stars in the cluster. Finally, Sagar & Cannon (1997) with a multicolor deep CCD photometry determined that the law of interstellar extinction in the direction of the cluster is normal.
Linear polarization of starlight is a powerful technique to investigate the nature of the interstellar medium in the region of an open cluster. The dust particles that make up this medium are aligned to the galactic magnetic field and produce interstellar polarization; they are one of the main sources of stellar linear polarization. These studies provide information on the dust distribution and the magnetic field structure (Heiles 1996), and on the nature and size of the dust particles (Kim, Martin & Hendry 1994). NGC 5662 is an interesting object to be studied with this technique given the behavior of its extinction (CLB). Galactic open clusters are excellent candidates to be studied by polarimetric techniques, because in most of the cases there is previous photometric and spectroscopic information, as it is the case of NGC 5662. Thus, we have physical parameters of the cluster and by means of the addition of polarimetric observations can be determined the interstellar dust distribution, and the efficiency of the dust grains which polarize the starlight; as a byproduct of these studies, we can confirm or determine the membership of some of the stars of the region.
We present multicolor (BV RI) measurements of linear polarization for a sample of 73 stars observed in the direction to NGC 5662, as a part of an ongoing project to understand the dust characteristics in the regions where galactic open clusters are located. We discuss the observations in the § 2. Results are presented in § 3. In § 4 the results are analyzed and discussed, including the characteristics of the dust in the region where the cluster is located (Pλmax, λmax, polarization efficiency, QU-plane), evidences of intrinsic polarization and the evolution of absorption and polarization along the line of the visual towards NGC 5662. Finally, we conclude with a summary in the last section.
2. OBSERVATIONS AND DATA REDUCTION
We acquired our polarization data during three observation shifts (2011, 2012, 2013) at the 2.15 m telescope of the Complejo Astronómico El Leoncito (CASLEO), San Juan, Argentina, using the CASPROF polarimeter. CASPROF is a two-hole aperture polarimeter with rapid modulation provided by a rotating achromatic half-wave retarder and a Wollaston prism polarizing beamsplitter. In this instrument the complementary polarized beams are detected with photomultipliers operating in pulse-counting mode, and the acquisition and guiding are accomplished with a CCD camera viewing the sky surrounding the entrance aperture. More technical information about CASPROF is in the CASLEO site (http://www.casleo.gov.ar/instrumental/js-casprof-en.php).
Data of a sample of 73 stars in the region of NGC 5662 were obtained in the BV(RI)KC bands (KC: Kron-Cousins, λBeff = 0.44μm, FWHM = 0.06 μm; λVeff = 0.53μm, FWHM = 0.06 μm; λReff = 0.69μm, FWHM = 0.18 μm; λIeff = 0.83μm, FWHM = 0.15 μm).
Several standard stars for null polarization and for the zero point of the polarization position angle were measured in all the filters (BV RI) for calibration purposes. HD115617 (null polarization standard) and HD111613 (an angle standard) were measured at the beginning of every night of the run. At the end of each night a second check-up was carried out, observing HD209100 (null polarization) and HD203532 (angle standard). This process was repeated every night of the observing run in all filters used. The null standards show that no correction for instrumental polarization has to be done, because errors in polarization were greater than the polarization measured. Errors are dominated by the photon shot noise and were handled as described by Maronna et al. (1992). For the program stars, the sky’s polarization was measured in a region close to object in each filter and subtracted. The polarization angle was corrected to the equatorial system using the observations of angle standards. Time exposure was done in cycles of 240 sec and several cycles were used for the faint stars.
CLB divided the field of NGC 5662 in four circular regions with external radii of 9.4, 18 and 26 arcmin for regions I, II and III respectively, and stars observed beyond 26 arcmin correspond to region IV. In our sample 45 stars belong to the region I, 23 to region II and 5 to region III. We did not observe stars in region IV.
During each observing run, a set of standard stars to determine null polarization and the zero point of the polarization position angle was observed in order to determine both the instrumental polarization and the coordinate transformation into the equatorial system, respectively.
Polarimetric observations of the sample are listed in Table 1, in a self-explanatory format. Column 1 shows the stellar identification along with the membership and the spectral type according to Fitzgerald et al (1979). The first digit in the identification shows the region of the cluster to which the star belongs. The corresponding filter is listed in Column 2. The percentage polarization Pλ and the corresponding error ϵP in each filter are given in Column 3. The position angle of the electric vector θλ in the equatorial coordinate system (measured from the north and increasing eastward) and their respective mean errors ϵθ in each filter are given in Column 4, considering in the computation of them that the photon shot noise is the dominant source of errors.
Table 1 Polarimetric observations
| Stara | Mem | Spec. Typeb | Filter | Pλ ± ϵP % | θλ±ϵθ° | Stara | Mem | Spec. Typeb | Filter | Pλ ± ϵP % | θλ±ϵθ° |
|---|---|---|---|---|---|---|---|---|---|---|---|
| 104 | nm | B | 2.89 ± 0.38 | 67.1 ± 2.98 | 119 | m | B | 3.16 ± 0.54 | 97.8 ± 3.85 | ||
| V | 2.89 ± 0.16 | 66.7 ± 1.25 | V | 2.48 ± 0.22 | 84.4 ± 1.96 | ||||||
| R | 2.73 ± 0.10 | 68.6 ± 0.86 | R | 1.98 ± 0.25 | 88.2 ± 2.83 | ||||||
| I | 2.26 ± 0.16 | 70.8 ± 1.56 | I | 1.37 ± 0.35 | 88.0 5.72 | ||||||
| 105 | m | B | 2.49 ± 0.11 | 89.6 ± 1.03 | 120 | nm | A2IIIp | B | 1.99 ± 0.10 | 86.0 ± 1.10 | |
| V | 2.81 ± 0.08 | 92.6 ± 0.63 | V | 2.33 ± 0.08 | 87.1 ± 0.79 | ||||||
| R | 2.75 ± 0.08 | 89.2 ± 0.63 | R | 2.33 ± 0.08 | 87.7 ± 0.73 | ||||||
| I | 2.45 ± 0.10 | 89.2 ± 0.94 | I | 2.04 ± 0.08 | 84.2 ± 0.86 | ||||||
| 106 | m | B | 2.62 ± 0.40 | 64.9 ± 3.40 | 122 | pm | B | 2.12 ± 0.18 | 91.9 ± 1.95 | ||
| V | 2.62 ± 0.22 | 73.6 ± 1.93 | V | 2.63 ± 0.11 | 93.0 ± 0.92 | ||||||
| R | 2.55 ± 0.22 | 74.1 ± 1.94 | R | 2.55 ± 0.09 | 91.3 ± 0.83 | ||||||
| I | 2.06 ± 0.28 | 70.2 ± 3.05 | I | 1.92 ± 0.15 | 91.9 ± 1.70 | ||||||
| 107 | nm | B | 2.38 ± 0.20 | 91.6 ± 1.91 | 123 | nm | B | 1.98 ± 0.21 | 86.7 ± 2.34 | ||
| V | 2.53 ± 0.07 | 92.9 ± 064 | V | 2.16 ± 0.07 | 83.0 ± 0.75 | ||||||
| R | 2.36 ± 0.06 | 95.2 ± 0.60 | R | 2.18 ± 0.07 | 86.2 ± 0.71 | ||||||
| I | 2.19 ± 0.06 | 98.5 ± 0.66 | I | 1.71 ± 0.07 | 83.4 ± 0.93 | ||||||
| 110 | m | B | 2.58 ± 0.20 | 93.0 ± 1.75 | 124 | nm | B | 2.45 ± 0.26 | 80.4 ± 2.35 | ||
| V | 2.90 ± 0.16 | 92.2 ± 1.21 | V | 2.28 ± 0.13 | 84.9 ± 1.30 | ||||||
| R | 2.50 ± 0.10 | 93.2 ± 0.91 | R | 2.23 ± 0.09 | 85.1 ± 0.87 | ||||||
| I | 2.53 ± 0.13 | 89.6 ± 1.16 | I | 1.85 0.11 | 82.2 ± 1.34 | ||||||
| 111 | m | B | 2.85 ± 1.05 | 90.7 ± 8.29 | 125 | m | B | 2.78 ± 0.38 | 92.0 ± 3.03 | ||
| V | 4.20 ± 0.59 | 97.7 ± 3.16 | V | 2.85 ± 0.26 | 89.2 ±2.03 | ||||||
| R | 3.54 ± 0.42 | 99.8 ±2.69 | R | 3.01 ± 0.23 | 90.9 ± 1.75 | ||||||
| I | 3.06 ± 0.57 | 100.1 ±4.20 | I | 2.89 ± 0.25 | 81.5 ± 1.96 | ||||||
| 112 | nm | B | 2.46 ± 0.13 | 90.5 ±1.17 | 126 | m | B8V | B | 2.84 ± 0.09 | 80.1 ±0.71 | |
| V | 2.48 ± 0.08 | 94.5 ± 0.75 | V | 3.25 ±0.06 | 78.9 ±0.40 | ||||||
| R | 2.59 ± 0.06 | 95.1 ± 0.55 | R | 3.12 ± 0.05 | 79.3 ±0.39 | ||||||
| I | 2.46 ±0.10 | 93.0 ±0.95 | I | 2.71 ±0.08 | 77.7 ±0.67 | ||||||
| 113 | nm | B | 2.26 ± 0.55 | 97.6 ±5.43 | 127 | m | K3III | V | 2.77 ± 0.07 | 91.1 ± 0.56 | |
| V | 2.54 ± 0.36 | 95.2 ± 3.16 | R | 2.79 ±0.03 | 85.5 ± 0.22 | ||||||
| R | 2.91 ±0.24 | 89.9 ± 1.85 | I | 2.55 ± 0.02 | 84.7 ± 0.14 | ||||||
| I | 1.82 ± 0.31 | 90.8 ± 3.78 | 129 | m | B9V | B | 2.24 ± 0.17 | 91.5 ± 1.69 | |||
| 114 | m | B7III(B8III) | B | 2.17 ± 0.04 | 89.6 ±0.40 | V | 2.22 ± 0.09 | 90.1 ±0.96 | |||
| V | 2.25 ± 0.03 | 89.4 ±0.28 | R | 2.08 ± 0.08 | 87.8 ±0.88 | ||||||
| R | 2.26 ± 0.03 | 87.0 ± 0.27 | I | 1.86 ± 0.13 | 91.3 ± 1.57 | ||||||
| I | 1.87 ± 0.04 | 86.3 ± 0.43 | 130 | nm | B | 1.83 ± 0.37 | 85.3 ±4.55 | ||||
| 115 | m | A1V | B | 2.09 ± 0.14 | 91.4 ± 1.50 | V | 2.46 ± 0.19 | 82.9 ± 1.76 | |||
| V | 2.18 ± 0.08 | 89.3 ± 0.80 | R | 2.74 ± 0.13 | 82.7 ± 1.06 | ||||||
| R | 2.26 ± 0.09 | 88.1 ± 0.93 | I | 2.39 ± 0.17 | 80.9 ± 1.62 | ||||||
| I | 1.92 ± 0.12 | 84.7 ± 1.36 | 132 | m | A1V | B | 2.75 ± 0.20 | 86.5 ± 1.61 | |||
| 116 | m | B | 2.27 ± 0.17 | 95.3 ± 1.72 | V | 2.84 ± 0.10 | 83.3 ± 0.79 | ||||
| V | 2.42 ± 0.11 | 95.4 ±1.06 | R | 2.67 ± 0.10 | 83.8 ± 0.84 | ||||||
| R | 2.42 ± 0.09 | 96.2 ±0.84 | I | 2.23 ± 0.21 | 81.4 ± 2.17 | ||||||
| I | 2.00 ± 0.17 | 97.2 ± 1.86 | 133 | m | B | 2.10 ±0.31 | 84.4 ± 3.29 | ||||
| 117 | m | B7IV | B | 2.15 ± 0.15 | 94.7 ± 1.61 | V | 2.64 ± 0.20 | 92.3 ± 1.68 | |||
| V | 2.43 ± 0.10 | 90.4 ± 0.90 | R | 2.76 ± 0.20 | 91.5 ± 1.62 | ||||||
| R | 2.59 ± 0.09 | 90.4 ± 0.77 | I | 2.78 ± 0.25 | 93.6 ± 2.05 | ||||||
| I | 2.28 ± 0.12 | 89.4 ± 1.14 | 134 | m | B | 2.58 ± 0.30 | 89.1 ± 2.66 | ||||
| 118 | m | B7IV | B | 2.25 ± 0.08 | 91.8 ± 0.79 | V | 2.43 ± 0.21 | 90.0 ± 1.97 | |||
| V | 2.45 ± 0.05 | 89.5 ± 0.50 | R | 2.43 ± 0.16 | 88.2 ± 1.51 | ||||||
| R | 2.46 ± 0.06 | 89.1 ± 0.55 | I | 2.27 ± 0.22 | 82.7 ± 2.20 | ||||||
| I | 2.21 ± 0.07 | 87.2 ± 0.69 | |||||||||
| 135 | m | B | 2.44 ± 0.18 | 87.7 ± 1.62 | 149 | nm | B | 2.48 ± 0.61 | 95.0 ± 4.84 | ||
| V | 2.62 ± 0.11 | 91.1 ± 0.94 | V | 2.87 ± 0.11 | 90.0 ± 0.84 | ||||||
| R | 2.60 ± 0.10 | 89.7 ± 0.82 | R | 2.40 ± 0.10 | 90.5 ± 0.90 | ||||||
| I | 2.33 ± 0.10 | 87.7 ± 1.00 | I | 2.36 ± 0.05 | 89.1 ± 0.51 | ||||||
| 136 | m | B9V | B | 2.27 ± 0.44 | 78.0 ± 4.39 | 150 | m | B | 2.19 ± 0.07 | 90.3 ± 0.68 | |
| V | 2.53 ± 0.11 | 70.6 ± 0.94 | V | 2.43 ± 0.05 | 79.7 ± 0.42 | ||||||
| R | 2.32 ± 0.22 | 67.1 ± 2.12 | R | 2.38 ± 0.04 | 79.3 ± 0.36 | ||||||
| I | 1.95 ± 0.21 | 68.7 ± 2.45 | I | 2.14 ± 0.07 | 78.6 ± 0.77 | ||||||
| 137 | m | B | 3.19 ± 1.00 | 95.7 ± 7.07 | 151 | m | B | 2.37 ± 0.29 | 87.4 ± 2.73 | ||
| V | 3.69 ± 0.35 | 99.7 ± 2.14 | V | 2.23 ± 0.18 | 85.4 ± 1.78 | ||||||
| R | 3.21 ± 0.23 | 99.5 ± 1.59 | I | 1.73 ± 0.21 | 86.6 ± 2.73 | ||||||
| I | 2.51 ± 0.24 | 103.1 ± 2.11 | 152 | pm | B | 2.11 ± 0.23 | 86.5 ± 2.45 | ||||
| 138 | m | B | 2.17 ± 0.32 | 89.1 ± 3.30 | V | 2.20 ± 0.14 | 89.9 ± 1.42 | ||||
| V | 2.64 ± 0.21 | 97.7 ± 1.80 | R | 2.49 ± 0.11 | 91.4 ± 1.01 | ||||||
| R | 2.19 ± 0.15 | 90.0 ± 1.52 | I | 2.27 ± 0.17 | 92.0 ± 1.65 | ||||||
| I | 2.09 ± 0.18 | 99.0 ± 1.98 | 158 | nm | B | 2.52 ± 0.22 | 106.4 ± 1.92 | ||||
| 139 | m | B8IV | B | 2.32 ± 0.06 | 64.6 ± 0.58 | V | 2.52 ± 0.22 | 106.4 ± 1.92 | |||
| V | 2.25 ± 0.04 | 84.2 ± 0.30 | R | 2.73 ± 0.07 | 100.9 ± 0.61 | ||||||
| R | 2.35 ± 0.04 | 83.6 ± 0.41 | I | 2.56 ± 0.16 | 102.6 ± 1.42 | ||||||
| I | 2.19 ± 0.06 | 82.1 ± 0.59 | 201 | m | B | 2.45 ± 0.12 | 82.2 ± 1.11 | ||||
| 140 | nm | B7V | B | 3.00 ± 0.14 | 79.3 ± 1.02 | V | 2.69 ± 0.07 | 82.8 ± 0.57 | |||
| V | 3.31 ± 0.08 | 81.2 ± 0.55 | R | 2.63 ± 0.11 | 84.6 ± 0.96 | ||||||
| R | 3.07 ± 0.09 | 80.2 ± 0.55 | I | 2.34 ± 0.15 | 84.2 ± 1.48 | ||||||
| 141 | nm | B | 2.12 ± 0.28 | 98.2 ± 3.01 | 207 | m | B | 1.90 ± 0.30 | 115.8 ± 3.56 | ||
| V | 2.43 ± 0.14 | 98.1 ± 1.29 | V | 2.11 ± 0.14 | 112.5 ± 1.53 | ||||||
| R | 2.40 ± 0.10 | 102.8 ± 0.95 | R | 1.94 ± 0.11 | 111.1 ± 1.29 | ||||||
| I | 2.12 ± 0.15 | 98.9 ± 1.54 | I | 1.60 ± 0.14 | 110.0 ± 1.94 | ||||||
| 142 | m | B9V | B | 2.58 ± 0.12 | 96.1 ± 1.04 | 208 | nm | B | 1.93 ± 0.20 | 84.4 ± 2.37 | |
| V | 2.68 ± 0.08 | 92.6 ± 0.69 | V | 2.07 ± 0.11 | 85.5 ± 1.23 | ||||||
| R | 2.53 ± 0.09 | 95.8 ± 0.77 | R | 1.93 ± 0.10 | 85.0 ± 1.22 | ||||||
| I | 2.38 ± 0.12 | 94.8 ± 1.14 | I | 1.88 ± 0.11 | 84.6 ± 1.31 | ||||||
| 143 | m | A0V | B | 1.99 ± 0.19 | 72.2 ±v2.13 | 214 | nm | B | 2.86 ± 0.12 | 97.7 ± 0.90 | |
| V | 2.22 ± 0.11 | 68.6 ± 1.16 | V | 3.15 ± 0.11 | 101.8 ± 0.75 | ||||||
| R | 2.13 ± 0.10 | 72.5 ± 1.67 | R | 3.05 ± 0.08 | 97.0 ± 0.61 | ||||||
| 144 | nm | B | 2.08 ± 0.15 | 86.5 ± 1.58 | I | 2.69 ± 0.08 | 99.0 ± 0.68 | ||||
| V | 2.35 ± 0.08 | 87.2 ± 0.73 | 215 | nm | B | 2.34 ± 0.43 | 104.4 ± 4.14 | ||||
| R | 2.21 ± 0.06 | 89.2 ± 0.65 | V | 2.47 ± 0.14 | 104.3 ± 1.27 | ||||||
| I | 2.02 ± 0.01 | 86.6 ± 1.12 | R | 2.42 ± 0.09 | 104.0 ± 0.88 | ||||||
| 145 | nm | B | 2.24 ± 0.14 | 91.0 ± 1.41 | I | 2.12 ± 0.10 | 103.9 ± 1.02 | ||||
| V | 2.38 ± 0.13 | 89.6 ± 1.18 | 227 | m | V | 2.11 ± 0.12 | 93.8 ± 1.31 | ||||
| R | 2.13 ± 0.08 | 87.3 ± 0.86 | R | 2.15 ± 0.10 | 90.3 ± 1.10 | ||||||
| I | 2.10 ± 0.14 | 89.7 ± 1.53 | I | 2.09 ± 0.16 | 89.6 ± 1.75 | ||||||
| 146 | m | B7V(B7/9V) | B | 1.87 ± 0.06 | 85.6 ± 0.72 | 229 | m | B8V(B9/A0IV/V) | V | 3.09 ± 0.06 | 90.5 ± 0.47 |
| V | 1.96 ± 0.06 | 85.6 ± 0.68 | R | 3.00 ± 0.05 | 88.8 ± 0.38 | ||||||
| R | 1.86 ± 0.06 | 88.0 ± 0.69 | I | 2.66 ± 0.06 | 89.0 ± 0.52 | ||||||
| 147 | m | B | 1.71 ± 0.25 | 88.4 ± 3.29 | 230 | nm | F6/8IV/V | V | 2.17 ± 0.05 | 110.4 ± 0.52 | |
| V | 2.01 ± 0.15 | 89.7 ± 1.64 | R | 2.12 ± 0.05 | 107.9 ± 0.48 | ||||||
| R | 1.78 ± 0.12 | 88.5 ± 1.54 | I | 1.80 ± 0.04 | 110.1 ± 0.55 | ||||||
| I | 1.32 ± 0.18 | 88.8 ± 3.00 | 231 | m | B8V | B | 2.59 ± 0.08 | 99.8 ± 0.74 | |||
| 148 | nm | B | 1.85 ± 0.42 | 96.4 ± 5.09 | V | 2.65 ± 0.05 | 99.8 ± 0.39 | ||||
| V | 2.37 ± 0.11 | 91.0 ± 1.06 | R | 2.71 ± 0.05 | 98.8 ± 0.41 | ||||||
| R | 2.23 ± 0.06 | 89.2 ± 0.65 | I | 2.32 ± 0.05 | 102.3 ± 0.46 | ||||||
| 237 | m | Var(B8V) | B | 2.81 ± 0.14 | 96.5 ± 1.11 | 260 | m | B | 1.63 ± 0.25 | 96.1 ± 3.46 | |
| V | 3.17 ± 0.09 | 98.3 ± 0.66 | V | 2.57 ± 0.16 | 106.1 ± 1.44 | ||||||
| R | 3.01 ± 0.09 | 96.8 ± 0.66 | R | 2.43 ± 0.11 | 99.6 ± 1.00 | ||||||
| I | 2.73 ± 0.09 | 95.7 ± 0.77 | I | 2.36 ± 0.12 | 100.4 ± 1.13 | ||||||
| 238 | m | B | 2.72 ± 0.15 | 99.5 ± 1.22 | 261 | m | B | 1.69 ± 0.31 | 113.5 ± 4.18 | ||
| V | 2.92 ± 0.11 | 100.4 ± 0.87 | V | 1.88 ± 0.19 | 100.5 ± 2.31 | ||||||
| R | 3.10 ± 0.10 | 98.9 ± 0.76 | R | 1.87 ± 0.16 | 102.6 ± 1.88 | ||||||
| I | 2.47 ± 0.16 | 97.5 ± 1.43 | I | 2.03 ± 0.22 | 104.5 ± 2.38 | ||||||
| 240 | pm | B | 2.90 ± 0.09 | 96.1 ± 0.74 | 262 | m | B | 1.42 ± 0.15 | 86.5 ± 2.32 | ||
| V | 3.44 ± 0.07 | 94.6 ± 0.49 | V | 1.89 ± 0.19 | 93.0 ± 1.06 | ||||||
| R | 3.28 ± 0.05 | 93.7 ± 0.37 | R | 1.87 ± 0.09 | 93.9 ± 1.14 | ||||||
| I | 3.01 ± 0.08 | 93.9 ± 0.63 | I | 1.59 ± 0.16 | 93.2 ± 2.25 | ||||||
| 241 | m | B | 2.66 ± 0.31 | 91.8 ± 2.60 | 265 | pm | B | 2.32 ± 0.13 | 96.6 ± 1.29 | ||
| V | 3.26 ± 0.20 | 95.9 ± 1.41 | V | 2.55 ± 0.19 | 97.4 ± 1.71 | ||||||
| R | 2.91 ± 0.15 | 98.9 ± 1.15 | R | 2.75 ± 0.08 | 93.8 ± 0.69 | ||||||
| I | 2.65 ± 0.21 | 97.0 ± 1.80 | 339 | m | V | 2.80 ± 0.08 | 94.3 ± 0.66 | ||||
| 245 | m | B | 2.68 ± 0.26 | 91.8 ± 2.60 | R | 9.99 ± 9.99 | 9.99 ± 9.99 | ||||
| V | 3.05 ± 0.13 | 88.0 ± 0.97 | I | 9.99 ± 9.99 | 9.99 ± 9.99 | ||||||
| R | 2.92 ± 0.13 | 89.7 ± 1.00 | 342 | m | B7/8Vn(e) | B | 3.07 ± 0.12 | 98.1 ± 0.86 | |||
| I | 2.57 ± 0.22 | 86.7 ± 1.93 | V | 3.30 ± 0.06 | 97.1 ± 0.42 | ||||||
| 251 | m | B | 1.97 ± 0.52 | 95.0 ± 5.88 | R | 3.44 ± 0.06 | 96.2 ± 0.41 | ||||
| V | 2.67 ± 0.20 | 93.9 ± 1.68 | I | 2.84 ± 0.08 | 96.7 ± 0.60 | ||||||
| R | 2.41 ± 0.25 | 93.3 ± 2.38 | 343 | m | B | 3.04 ± 0.22 | 97.7 ± 1.62 | ||||
| 253 | nm | B | 2.44 ± 0.11 | 99.7 ± 1.01 | V | 3.18 ± 0.14 | 99.4 ± 0.96 | ||||
| V | 2.82 ± 0.10 | 102.9 ± 0.83 | R | 3.16 ± 0.13 | 96.3 ± 0.92 | ||||||
| R | 2.80 ± 0.10 | 100.6 ± 0.84 | I | 2.77 ± 0.20 | 97.6 ± 1.58 | ||||||
| I | 2.63 ± 0.12 | 96.8 ± 1.03 | 345 | m | B | 2.90 ± 0.17 | 96.5 ± 1.32 | ||||
| 255 | m | B | 1.86 ± 0.14 | 96.0 ± 1.71 | V | 3.47 ± 0.10 | 98.4 ± 0.66 | ||||
| V | 1.72 ± 0.13 | 94.6 ± 1.66 | R | 3.35 ± 0.11 | 97.8 ± 0.71 | ||||||
| R | 2.17 ± 0.12 | 96.0 ± 1.27 | I | 2.76 ± 0.17 | 97.3 ± 1.35 | ||||||
| I | 1.42 ± 0.15 | 96.7 ± 2.34 | 362 | m | B8V | B | 1.51 ± 0.07 | 98.2 ± 1.03 | |||
| 256 | m | B8V | B | 1.77 ± 0.07 | 90.8 ± 0.90 | V | 1.59 ± 0.07 | 99.2 ± 0.98 | |||
| V | 1.97 ± 0.06 | 97.7 ± 0.71 | R | 1.50 ± 0.07 | 101.1 ± 1.00 | ||||||
| R | 1.94 ± 0.06 | 93.6 ± 0.65 | I | 1.44 ± 0.08 | 96.8 ± 1.29 | ||||||
| I | 1.71 ± 0.10 | 90.8 ± 1.26 | |||||||||
| 259 | m | B | 1.93 ± 0.21 | 97.9 ± 2.43 | |||||||
| V | 1.95 ± 0.13 | 96.1 ± 1.49 | |||||||||
| R | 2.03 ± 0.10 | 95.6 ± 1.13 | |||||||||
| I | 2.20 ± 0.18 | 93.8 ± 1.79 | |||||||||
a: Identifications are taken from Clariá, Lapasset & Bosio (1991).
b: Spectral type classification is taken from Fitzgerald et al. (1979).
3. RESULTS
Figure 1 shows the projections of the polarization vectors in the V -band on the sky at the central region of NGC 5662, their lengths being proportional to the percentage of the polarization (PV) and their respective orientations given by the polarization angles (θV). The dashed line superimposed on the figure is the projection of the galactic parallel b = 3.°27, which is inclined at approximately 67º in this region. It can be seen that most of the stars of the sample have their polarimetric vectors non-aligned to the projection of the Galactic Plane (hereafter GP), indicating that dust grains and the magnetic field in the direction to the cluster have been recently disturbed (Ellis & Axon 1978). If we do a thorough review of Table 1, only the polarization angles of four stars of the sample (#104, #106, #136 and #143) show an alignment with the GP; three of them are identified as members by CLB.
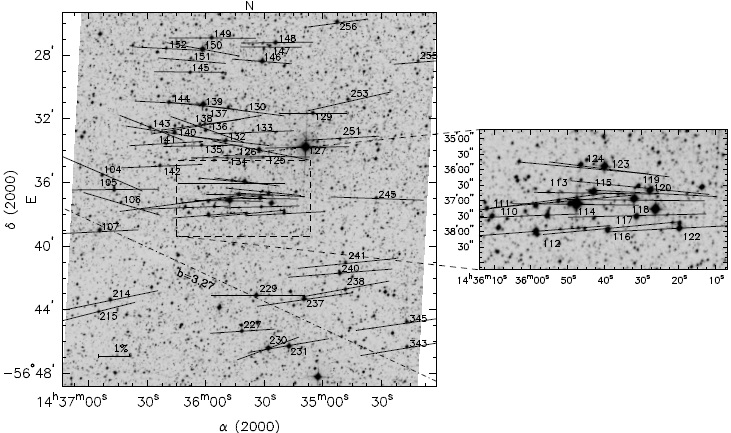
Fig. 1 Projection on the sky of the polarization vectors (Johnson V filter) of the stars observed in the region of NGC 5662. The dash-dotted line is the Galactic parallel b=3.º27. The length of each vector is proportional to the polarization percentage. The background image of the cluster is a DSS image from the Space Telescope Institute.
Figure 2 displays the relation between θV and PV for the 73 stars. Full circles indicate the members, triangles the non-members and open circles the stars without membership data. The memberships are assigned according to CLB, and the dashed line represents the inclination of the GP in the region (67º). An apparent segregation of three different groups is observed at the polarization angles, but not in polarization. The range of polarization angles in the total sample is spread over 44º.
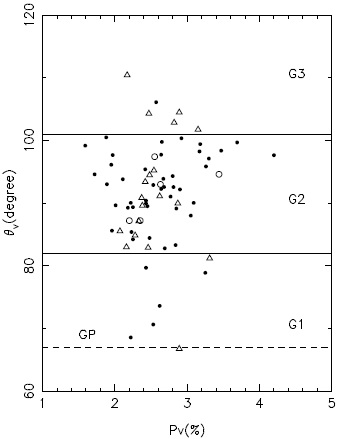
Fig. 2 V -band polarization percentage of the stellar flux Pv (%) vs. the polarization angle θV for each star. Full circles are member stars, open circles stars with unknown membership data and open triangles non-member stars. The dashed line indicates the inclination of the GP in the region and the two full lines divide the apparent three groups with different polarimetric parameters.
The three above mentioned groups are separated with full lines in Figure 2. Group 1 (G1) has a mean PV and θV of 2.8% ± 0.13 and 78.1º ±1.10, with polarization vectors closely aligned with the GP. The values corresponding to Group 2 (G2) are 2.27%±0.13 and 89º.6±1.17, which would characterize the cluster region where the greater concentration of member stars is observed. Finally, Group 3 (G3) with values of PV = 2.51%±0.14 and θV = 106º ±1.2 is mostly composed of non-member stars. Several of the stars in G2 with larger polarization (above 3%) are located in the south-west region of the cluster. This result seems to be consistent with CLB on the evolution of the interstellar reddening over the region. Also, CLB claim that there is an apparent decrease in the star density across the cluster from north to south-east.
Among the members, the greatest difference in polarization observed is 2.6%, within a narrow range at angles between 80º and 102º. On this basis we can suspect that some of these stars are nonmembers, particularly those objects with greater polarization than the average. This plot does not show a very compact core as we observed in the study of NGC 6204 (Martínez et al. 2004) and NGC 5749 (Vergne et al. 2007). So, in this cluster, polarimetric observations are not useful to identify potential members.
Figure 3a shows the distribution of PV for all observed stars, which reveals an extended tail towards higher polarization for the members (black bars) and for the total sample (grey bars). This effect could be due to the existence of highly polarized members, background stars or different populations of dust grains.
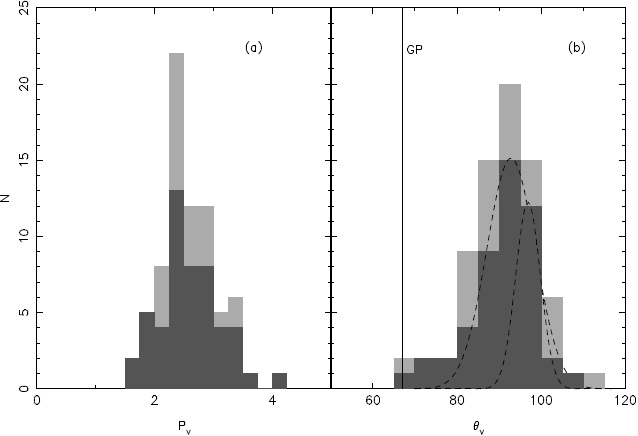
Fig. 3 (a) The distribution of the polarization percentage in the V filter (PV), and (b) the distribution of the orientation angles in the V filter (θV) for the sample of stars. The solid line indicates the angle of inclination of the GP. For both figures, dark bars represent the distribution of probable members, while grey bars represent the distribution of the total sample. In Panel b are indicated with dash-dotted lines two Gaussian fits for the probable members.
Figure 3b displays the distribution of the polarization angle in the V filter (θV) for all the stars. The solid line in the figure indicates again the inclination of the GP. In the corresponding distribution of members (dark bars) two groups may be observed with a small difference between their averages of the angles of polarization. If a Gaussian is fitted for each of the groups, we obtain a mean value and a full width at half maximum (FWHM) of 92º.8 and 8º.13 for the group on the left and 96º.9 and 4º.17 for the group on the right. The difference of more than 5º in the mean polarization angles is probably due to the existence of dust with different grain orientations. The angle distribution of the member stars (black bars) has a behavior similar to the total sample (grey bars). In principle, we think that stars with angles smaller than 85º could be identified as probable non-members; several of them were considered as members by CLB. This is observed through the Gaussian fit on the left, where the stars with angles smaller than 85º have a very low probability to be members; so these stars do not share the polarimetric properties of the member stars.
4. ANALYSIS AND DISCUSSION
4.1. Fitting with Serkowski’s Law
The dependence between optical wavelength and interstellar linear polarization was first noted by Gehrels (1960). Then Coyne, Gehrels & Serkowski (1974) and Serkowski, Mathewson & Ford (1975) showed that it was an effective tool to investigate the different properties of the interstellar medium. Serkowski (1973) found that this dependence is well represented by the following empirical relation:
where Pλ is the percent polarization at wavelength λ, Pλmax is the maximum polarization which occurs at λmax, and K is a constant for all stars. If the polarization is produced by aligned interstellar dust particles, we assume that the observed data (in terms of wavelength within the bands BV RI) will follow equation (1) and each star will have a Pλmax and a λmax values. To perform the fitting, we adopted K = 1.66λmax + 0.01 (Whittet et al. 1992).
The parameters of Serkowski’s law are related to the properties of the intervening interstellar medium. Pλmax is related to the column density of the medium and degree of alignment of the interstellar grains and λmax is related to the average size of the polarizing grains. The individual Pλmax, λmax values, together with the star identification from CLB, are listed in Table 2, excluding star #339 because only data in the filter V are available.
Table 2 Polarization results
| Stara | Pmax±ϵp | σ1b | λmax±ϵλmax | Stara | Pmax±ϵp | σ1b | λmax±ϵλmax |
|---|---|---|---|---|---|---|---|
| 104 | 2.954±0.090 | 0.527 | 0.496±0.025 | 145 | 2.317±0.073 | 0.972 | 0.544±0.038 |
| 105 | 2.781±0.042 | 0.874 | 0.590±0.022 | 146 | 1.955±0.005 | 0.131 | 0.547±0.004 |
| 106 | 2.669±0.085 | 0.412 | 0.506±0.030 | 147* | 1.964±0.171 | 1.044 | 0.463±0.063 |
| 107 | 2.508±0.035 | 0.634 | 0.555±0.015 | 148 | 2.327±0.089 | 0.971 | 0.559±0.063 |
| 110 | 2.738±0.128 | 1.450 | 0.565±0.057 | 149 | 2.761±0.176 | 1.713 | 0.538±0.051 |
| 111 | 3.763±0.339 | 0.756 | 0.532±0.093 | 150 | 2.422±0.024 | 0.835 | 0.590±0.016 |
| 112 | 2.612±0.041 | 0.926 | 0.625±0.028 | 151 | 2.401±0.251 | 1.719 | 0.519±0.150 |
| 113 | 2.689±0.475 | 1.608 | 0.511±0.154 | 152 | 2.422±0.059 | 0.720 | 0.683±0.044 |
| 114* | 2.279±0.053 | 2.597 | 0.548±0.029 | 158 | 2.810±0.043 | 0.592 | 0.589±0.025 |
| 115 | 2.231±0.045 | 0.852 | 0.583±0.031 | 201 | 2.684±0.027 | 0.496 | 0.580±0.016 |
| 116 | 2.443±0.058 | 0.786 | 0.564±0.035 | 207 | 2.095±0.079 | 0.554 | 0.492±0.030 |
| 117 | 2.517±0.052 | 0.909 | 0.645±0.035 | 208 | 2.055±0.044 | 0.620 | 0.5810.029 |
| 118 | 2.474±0.019 | 0.566 | 0.596±0.012 | 214 | 3.108±0.045 | 0.773 | 0.567±0.017 |
| 119* | 3.212±0.332 | 0.472 | 0.321±0.027 | 215 | 2.500±0.040 | 0.360 | 0.549±0.017 |
| 120 | 2.295±0.056 | 1.259 | 0.608±0.036 | 227 | 2.177±0.020 | 0.283 | 0.649±0.020 |
| 122* | 2.534±0.167 | 2.081 | 0.550±0.086 | 229 | 3.110±0.034 | 0.650 | 0.552±0.013 |
| 123 | 2.196±0.127 | 1.810 | 0.515±0.052 | 230 | 2.198±0.076 | 1.493 | 0.525±0.030 |
| 124 | 2.379±0.095 | 0.797 | 0.500±0.032 | 231 | 2.712±0.056 | 1.720 | 0.563±0.025 |
| 125 | 3.032±0.046 | 0.323 | 0.644±0.025 | 237 | 3.111±0.047 | 0.836 | 0.572±0.020 |
| 126 | 3.183±0.070 | 1.854 | 0.571±0.032 | 238 | 2.996±0.106 | 1.605 | 0.593±0.013 |
| 127 | 2.836±0.031 | 0.769 | 0.590±0.012 | 240 | 3.340±0.071 | 1.970 | 0.604±0.030 |
| 129 | 2.240±0.022 | 0.300 | 0.520±0.011 | 241 | 3.068±0.116 | 0.932 | 0.557±0.025 |
| 130 | 2.609±0.115 | 1.141 | 0.705±0.089 | 245 | 3.007±0.054 | 0.575 | 0.567±0.020 |
| 132 | 2.846±0.040 | 0.405 | 0.515±0.017 | 251 | 2.559±0.178 | 1.082 | 0.578±0.055 |
| 133 | 2.814±0.075 | 0.437 | 0.739±0.039 | 253 | 2.825±0.040 | 0.690 | 0.637±0.034 |
| 134 | 2.543±0.071 | 0.567 | 0.562±0.036 | 255* | 1.913±0.185 | 2.505 | 0.552±0.048 |
| 135 | 2.640±0.019 | 0.284 | 0.579±0.010 | 256 | 1.959±0.027 | 0.734 | 0.594±0.021 |
| 136 | 2.524±0.053 | 0.407 | 0.495±0.022 | 259 | 2.098±0.077 | 1.019 | 0.674±0.067 |
| 137* | 3.842±0.305 | 0.575 | 0.425±0.036 | 260 | 2.449±0.140 | 1.698 | 0.708±0.110 |
| 138 | 2.429±0.138 | 0.959 | 0.533±0.057 | 261 | 1.968±0.067 | 0.606 | 0.688±0.060 |
| 139* | 2.376±0.059 | 2.382 | 0.598±0.040 | 262 | 1.770±0.072 | 1.023 | 0.667±0.069 |
| 140 | 3.249±0.068 | 1.169 | 0.550±0.038 | 265 | 2.747±0.020 | 0.245 | 0.683±0.012 |
| 141 | 2.426±0.044 | 0.499 | 0.586±0.027 | 342* | 3.356±0.100 | 2.473 | 0.581±0.045 |
| 142 | 2.686±0.028 | 0.504 | 0.557±0.015 | 343 | 3.220±0.033 | 0.359 | 0.568±0.015 |
| 143 | 2.199±0.035 | 0.484 | 0.582±0.031 | 345 | 3.369±0.123 | 1.741 | 0.571±0.056 |
| 144 | 2.305±0.035 | 0.684 | 0.566±0.013 |
a: Identifications from Clariá, Lapasset & Bosio (1991).
b: σ12 = Σ(rλ /ϵpλ)2/(m-2); where m is the number of colors and rλ = Pλ - Pmax exp(-K ln 2(λmax/λ)).
Table 2 also shows the σ1 parameter (the unit weight error of the fit, Column 4) which quantifies the departure of the data from the standard Serkowski law. This parameter is given by:
where m is the number of colors and rλ = Pλ − Pmax exp(−K ln2(λmax/λ)).
In our scheme, if a star exhibits σ1 > 1.70, the measured polarization may have a component of non-interstellar origin (intrinsic component). A second criterion to test the origin of the polarization is the λmax value. The stars found to display a value of this parameter lower than the average corresponding to the interstellar medium (0.55 μm; Serkowski et al. 1975) are candidates to have an intrinsic component of polarization (Orsatti et al. 1998, Vergne et al. 2016). And one last criterion is to make a visual check of the polarization behavior and the angle in the four filters for the complete sample of stars, observing if the polarization behaves according to what was predicted by Serkowski and if the angle shows variations due to a possible rotation.
Figures 4a, b show Pλmax versus λmax (Panel a) and Pλmax versus σ1 (Panel b), respectively. The full line represents the limit values for both parameters to consider a likely candidate for intrinsic polarization. A few stars of the sample have, in Panels a and b, suspicious λmax and σ1 values and only eight of them have values much higher than the established levels for these parameters. In Table 2 these stars are indicated with a star symbol in Column 1.
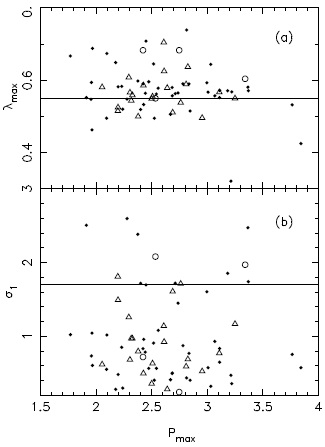
Fig. 4 (a) λmax vs. Pλmax. Full circles are the member stars, open circles are stars with unknown membership and open triangles are stars classified as non-members. (b) σ1 vs. Pλmax. The symbols are the same as those used in Panel (a).
Stars #114, #122, #139, #255, #342 have extreme values of σ1 and stars #119, #137, #147 have a λmax value of less than 0.55 μm. To complete the analysis we plot in Figures 5a, b polarization and angle versus the wavelength for each of the eight stars mentioned, including the fit of the law of Serkowski with a full line. The stars that present a suspicious σ1 parameter show in general good adjustment to Serkowski. A different case is star #139, which according to Fitzgerald et al. 1979 it is a B8IV(II/III), showing a rotation of the measured polarimetry in the B filter, a result that is fully expected for stars with extended atmospheres. Considering the three stars with the lowest values of λmax, the member star #119 displays a bad adjustment to Serkowski with a polarization that decreases with the wavelength. Also rotation is observed with variations in the polarization angle of up to about 15º. For this star only photometric data (CLB) are available in the literature, but this type of behavior in polarization and in orientation angle was found in other studies for the case of binary systems (Vergne et al. 2016).

Fig. 5 The plot displays both the multicolor polarization percentage and the polarization angle dependence on wavelength for some of the stars with features of intrinsic polarization.
In Figure 5 star #260 is also included, although it does not show suspicious λmax and σ1 values, but its polarization does not show a good fit to Serkowski and the variation of the angle shows that there is rotation.
4.2. Stokes Plane
The individual Stokes parameters, QV = PV cos (2θV) and UV = PV sin(2θV), can be used as a good criterion to identify members and non-members of a cluster, particularly when the field stars have colors that are similar to those of cluster members (Martínez et al. 2004, Vergne et al. 2007, Feinstein et al. 2008). They also allow us to study the nature of the dust properties of the ISM, the ICM (intra-cluster medium) and the magnetic field associated with them. As the polarization of the light from an star depends on the degree of alignment of the dust grains located in front of the star, the member stars are expected to be grouped on the QU-plane, while the non-member stars should be scattered in this plane.
In particular, NGC 5662 is not an easy cluster for memberships assignment, due to its extension, and so it is contaminated by a large number of field stars. Added to the difficulty of determining memberships, the interstellar reddening varies across the cluster (CLB). King (1980) calculated the probabilities of membership, based on relative proper motions in relation to the observed V magnitude. Later, CLB determined memberships by the position in the color-color and color-magnitude diagrams of a total of 237 stars in the field of NGC 5662. They predicted that 88% of the observed stars had a higher probability than 50% of membership.
Figure 6a shows the Stokes plane in the V -band, QV -UV, for the totality of the sample stars, distinguishing members (full circles), non-members (open triangle) and unknown membership stars (open circles). The GP is drawn with a full line and the solar neighborhood is shown with an open square box at the QV =0.0, UV =0.0 coordinates. One would expect the polarization angles of the members to be similar, but not those of the foreground or background non-member stars. In the present figure there is no such clear trend: all stars lie widely scattered on the plane, not showing any evident grouping. To have a clearer idea of how the polarizing dust is affecting the stars of the region and how it is distributed, we made different plots of the QU-plane for the member and probable member stars (Figure 6b) and the non-member stars (Figure 6c).
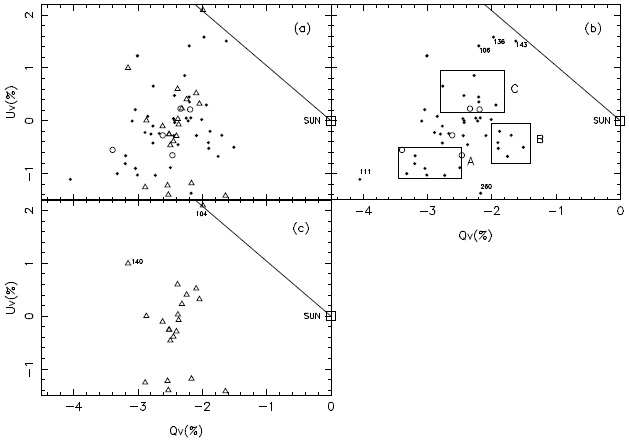
Fig. 6 QV vs UV Stokes parameters for the V -bandpass. (a) Plot for all the stars. (b) Plot for the member stars and the stars with unknown membership. Three different groups were indicated because of their location on the sky (see Text). (c) Plot of the non-members stars. The full line is the inclination of the Galactic Plane, the open square box indicates the solar vicinity and the symbols are as in Figure 4.
Figure 6b shows quite a dispersion and no strong concentration as is expected for member stars on the QU-Plane. In spite of this, if we study it in greater detail we notice that the stars are grouped according to their location on the sky plane (Figure 1). Stars placed within the box A are located on the sky in the South-West zone, being the most polarized group of the sample with a mean polarization and mean orientation of PV = 3.0 % ± 0.104 and θV =98º.1 ± 0.75, respectively. This group is composed of nine stars: eight members (#237, #238, #240, #241, #339, #342, #343 and #345) and one probable member (# 240). Star #122, a probable member, is located on the edge of the box of Group A and with polarimetric parameters similar to the stars of this group, but its projection is on the sky places in the central region of the cluster. Also, its location on the QU-plane is not reliable because its σ1 parameter exceeds our criterion limit, so probably it has an intrinsic component in its polarization, although in Figure 5 this fact is not reflected.
The six stars of Group B, all members, are located on the North-West (#255, #256, #259, #261, #262, #362). They have lower polarizations than Group A, with mean values of PV = 1.83% ± 0.112 and θV = 96º.8 ± 1.368.
Group C has an intermediate polarization and orientation of the polarization vectors, more than 10º with respect to Groups A and B. Its stars are located in the North of the cluster with a mean polarization and a orientation of PV = 2.33 %± 0.086 and θV = 83º .2 ± 0.794. This group is composed of six members (#119, #132, #139, #146, #150, #151) and two probable members (#144, #152). Star #119 was not considered to determine the average polarization and orientation of the group because it shows signs of intrinsic polarization through the parameter λmax.
Stars #106, #136 and #143 are quite aligned to the GP, and may be probable non-member stars with colors similar to the stars of the cluster; their polarization and angle are very different to the rest of the member stars, and show no evidence of an intrinsic polarization component.
Stars #111 and #260 deserve special consideration because both appear very scattered on the QU-plane with respect to the rest of stars. Star #111 is the most polarized in the sample, 4.2%, and with a similar orientation to Group A. According to our estimates it would be farther away than the cluster, about 930 pc, explaining the high polarization. Due to its location on the CLB’s C-C diagram this star is likely a non-member. Star #260 is located on the sky plane over the North-West zone of the cluster, as the Group B stars, but it is more polarized. Its position in the QU-plane can be explained by the existence of a intrinsic polarization component (Figure 5). The rest of the member stars are shown in the central zone of the QU-plane (Figure 6b); their projections on the plane of the sky are located in a central band from East to West.
Figure 6c shows the QU-plane of non-member stars, where some apparent grouping of the stars is observed. There is a group with values of QV between −2 and −3 and values of UV between 0.6 and −0.5, and a second group located in a range of −1.8 and −3 for QV and −1.2 and −1.4 for UV. There are also two stars isolated from the rest, #104 and #140. In general, both groups of stars show no tendency in their projections on the sky plane. It is also remarkable that in the second stellar group mentioned, none of the stars belong to the central zone but are located at the edges of the cluster field (see Figure 1). Concerning star #104, its polarization vector is aligned to the GP, and together with the member stars #106, #136 and #143 is projected on the plane of the sky at the eastern edge. Finally, star #140, of spectral type B7 V with an estimated excess EB−V = 0.45 mag, is probably a star farther away than the cluster, at a distance of more than 900 pc. This value is compatible with the observed polarization of PV =3.31%. So, it is probable that it is a background star polarized by denser dust clouds than those that are polarizing cluster members. Its projection on the plane of the sky places it to the East, very close to the last four stars mentioned in the previous paragraph.
The QU-plane of the cluster stars and field stars in the region make us think that they are being polarized by several clouds of dust and that each of them is affecting different areas of the cluster and its surroundings.
If the polarizing dust in the region of NGC 5662 is distributed as we estimate, the QU-plane, in this case, would not be an efficient polarimetric tool to establish memberships.
4.3. Polarization Efficiency
The ratio of Pλmax to the color excess EB−V is called the polarization efficiency. This amount in a given direction depends on the characteristics of the dust grains, size, shape and composition of the particles, and the projection of the alignment by the magnetic field. These characteristics and the magnetic field could change along the line of sight to the cluster.
Figure 7 shows the polarization efficiency for the stars on the region of NGC 5662. The empirical limit to the efficiency of the ISM, given by Serkowski et al.(1975) Pλmax = 9 EB−V, is represented by a continuous line in the figure. The polarization efficiency of the ISM in general is given on average by Pλmax = 5 EB−V, according to the plots of Serkowski et al. (1975). This is shown by a dashed line; the dotted line represents the average polarization efficiency of the ISM estimated by Fosalba el al. (2002), being valid for EB−V < 1.0 mag. Excesses EB−V of the stars were obtained from CLB and from the relation between spectral type and color indices following Schmidt-Kaler (1982).
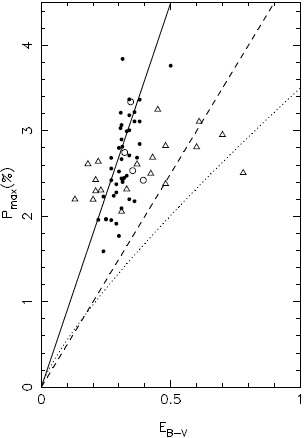
Fig. 7 Plot Pλmax vs.
EB−V for stars
in the direction of NGC 5662. The solid line shows the empirical
upper limit for the polarization efficiency (P
V ≃
9EB−V), the
dotted line Pλmax = 3.5
This figure shows that most of the stars identified as members by CLB lie on the full line corresponding to efficiency 9 (empirical limit), and only a few of them, with an excess less (0.2 mag.) than the average excess, are located below this upper limit between the lines of efficiency 5 and 9.
The polarization efficiency of NGC 5662 is much higher than that found by us for other clusters and for those studied by other authors (Eswaraiah et al. 2011, Pandey et al. 2013). This high efficiency may be due to different factors: several member stars could present an intrinsic component in their polarization, but this is not the case because there are few stars of the cluster with this type of behavior. Another explanation may be that we are looking at the fully transverse polarization vectors as found by Vrba, Marraco & Strom (1992) in the region of Chamaeleon 1 and 2.
Concerning non-member stars we observed groups with different efficiencies. A group has an average excess of 0.2 mag. and its mean efficiency is of 12.6% mag−1, exceeding the empirical limit and none of these stars show any evidence of intrinsic polarization. A second group of non-members are located between the lines of efficiency 9 and 5, with an average excess and efficiency of 0.4 mag and 6.7 % mag−1 respectively. This value of efficiency is similar to that of members already mentioned with smaller excesses. A third group of nonmember stars has a normal efficiency of about five, #124, #158, #214, #253, which exhibit an average excess of 0.57 mag and efficiency of 4.97% −1.
Finally, stars #104 and #107 are located near the estimate of Fosalva et al. (2002). According to their polarizations we can assume that their excesses may have been over estimated.
Considering only the non-member stars for which we have been able to estimate distances from magnitudes and colors (Schmidt-Kaler 1982), it could be said that the first group consists of foreground stars with distances between 150 and 400 pc, the 2nd group would be located between 400 and 800 pc (near the cluster) and the 3rd group would be background stars, behind the cluster.
Clearly the non-member stars are being polarized by dust with different polarimetric characteristics; this is why observed data show different efficiencies. This result also emerges from the QU-plot. The fact that the second group of non-member stars show excesses greater than the cluster, while its stars are closer to the observer and with a lower efficiency, makes us think that we are facing a patchy distribution of dust clouds along the way to the cluster, which have also a variable density. According to our estimates the first dust component would be located at a distance of less than 200 pc, which would polarize the first group of non-member stars and also the cluster.
A second component of dust with variable density would be located at a distance of approximately 500 pc, affecting the second group of non-member stars and having some windows of transparency that allow us to observe stars in the cluster without noticeable light extinction. This would explain the difference in efficiency between the cluster and the 2nd group of non-member stars, and also the difference in their excesses. Finally, the cluster would be located at a distance of approximately 800 to 900 pc, coinciding with the distance estimated by CLB. The nonmember stars belonging to the background would polarized by a component of dust with normal efficiency (Pλmax /EB−V = 5).
We would be identifying at least two components of dust between the observer and the cluster, and a component behind it.
Voshchinnikov, Il’in & Das (2016) found for the stellar clusters that the polarization of their stars is mainly caused by dust in the diffuse medium in the line of sight. In addition, these authors observed what they call a open cluster pattern, in the λmax vs. efficiency plot, which is made up of a set of points around a mean polarization efficiency of 9% mag−1 with λmax between 0.5-0.6 μm.
In Figure 8, we show a plot similar to that of Voshchinnikov et al. (2016) for members and probable members of NGC 5662, noting that most of the stars tend to concentrate around the point of efficiency 9 and λmax of 0.55 μm, but with a decrease of the efficiency for greater values of λmax. In particular, for most of the stars that follow this trend (#152, #259, #260, #261, #262, #265) their projections on the plane of the sky (Figure 1) are on the North. This may be the result of the presence of a dark cloud next to this zone of the cluster, and we would be observing a combination of open cluster pattern and dark cloud pattern according to Voshchinnikov et al.(2016).
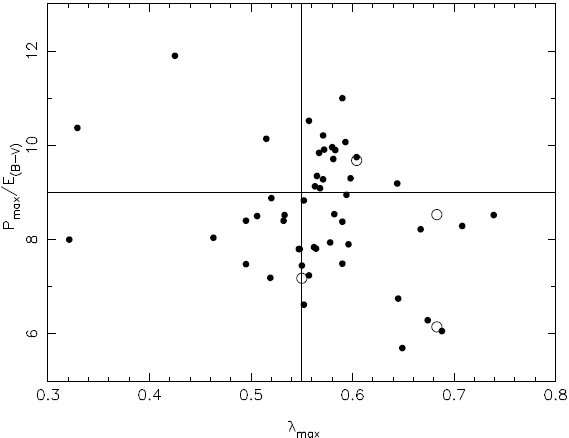
Fig. 8 Pλmax /EB−V vs. EB−V for the stars with excesses EB−V, excluding the non-members stars. Symbols are similar to those in Figure 4.
The image in the V band of the cluster and its surroundings does not show any dark area on the North. According to the average value of the λmax of these last six stars (0.68 μm), this confirms that they are being polarized by dust whose grains have a larger size than the dust that polarizes the light coming from the other stars.
4.4. Dust Distribution and Absorption Behavior
The degree of polarization of a star is not a continuous function of the distance due to the fact that dust is located mostly in layers between the observer and the star. If the stellar light encounters a dust layer, a sudden jump in the trend of the polarization is observed and the number of jumps is associated with the number of dust components in the path to the stars.
On the other hand, the alignment of the dust grains depends on its chemical composition. The interaction of the dust grains with the magnetic field will be different if the same grains are composed of pure iron or iron plus other elements (magnetic alignment). Voshchinnikov et al. (2012) found that there is a weak correlation between the polarization and [Fe/H]d or [Mg/H]d and a strong correlation between polarization and [Si/H]d. Their results coincide with the assumption of Mathis (1986) that only the silicate grains contribute to the observed polarization. Another important finding is that dust grains of all types contribute to AV, and hence to EB−V, whereas only silicates are responsible for the observed polarization.
Figures 9a and b show the evolution of the absorption and the polarization, respectively, for the observed stars for which we have been able to estimate distances in the region of NGC 5662.
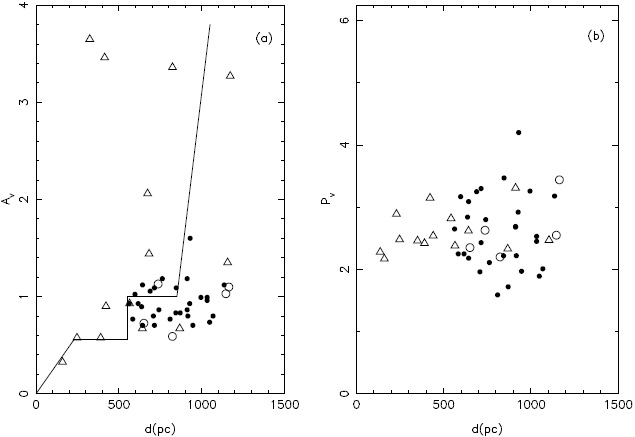
Fig. 9 (a) AV vs. distance (pc) in the area of NGC 5662. The full lines show the trend of the absorption from the Sun to the NGC 5662. (b) PV vs. distance (pc). Symbols are similar to those in Figure 4.
Concerning the trend of the absorption (Figure 9a), the plot shows the same jumps that we have previously discussed, an increase of the extinction up to about ≈ 200 pc and 500 pc. The cluster is located at a distance greater than 700 pc, having an average absorption between 0.9 and 1.0 mag. Therefore, the existence of the two layers of dust in front of the cluster is shown in Figure 9a. The trend of the absorption behind the cluster shows an abrupt growth, affecting the background stars. This result coincides with the behavior observed by Neckel & Klare (1980, Figure 6i-179) in the region, but shows more detail.
The polarization (Figure 9b) does not show a trend as clear as the absorption. One possible explanation, according to the work of Voshchinnikov et al. (2012), is that the dust grains are not composed of silicates. Therefore, the polarization would not be strongly affected.
5. SUMMARY
In the present study we have observed linear multicolor polarization (BV RI) for a sample of 73 stars in the region of the open cluster NGC 5662. The aim of this study was to investigate the characteristics of the ISM towards the direction of the cluster.
The analysis of these data shows that in the majority of the observed stars the polarization vectors are not aligned to the GP. The cluster can be characterized by an average polarization of PV = 2.27% ± 0.13 and an orientation of the polarization vectors of θV = 89º.6 ± 1.17, despite the dispersion observed in both quantities.
The FWHM in the two possible Gaussian adjustments in the polarization angles distribution for the members are 8º.13 and 4º.17. This is in accordance with the width found for other open clusters studied (Martínez et al. 2004, Vergne et al. 2016).
The results show that a few stars (9) have some evidence of intrinsic polarization; seven of them are members, one is a probable member and the last one is a non-member.
The QU-plane and the polarization efficiency indicate that the observed polarization of the stars is due to the presence of several dust components, some of them with variable densities. Hence, according to the area in which the star is located, its polarization will be different from what one would expect if the density were uniform.
NGC 5662 has a high polarization efficiency: Pλmax /EB−V amounts to 9.0, reaching a value equivalent to Serkowski’s empirical limit. This value is much higher the average value of about 5 attributed in average to the ISM. In the set of nonmember stars, two groups of foreground stars are distinguished, one of them with higher efficiency than the empirical limit and the cluster, 12.7, and the other with an efficiency of 7.2. The rest of nonmember stars have normal efficiency (5) and are surely background stars.
The efficiency diagram reveals the presence of at least three components of dust towards NGC 5662 at ≈ 200 pc, 500 pc and more than 900 pc, the latter behind the cluster. Regarding the second layer of dust, there are indications that it is a component with variable density, with some regions of transparency.
Given this feature of the dust components in the region of NGC 5662, both tools, QU-plane and polarization efficiency, do not seem useful to separate cluster members from field stars on the basis of the present observations, as they have been in the study of other galactic clusters.
The trend of the absorption (AV) with the distance in the region shows a growth at ≈ 200 pc and then at ≈ 500 pc, affecting the foreground stars. The cluster is located at a distance of more than 700 pc, according to Figure 9a, with an average absorption of approximately 0.9 mag to 1.0 mag, compatible with an EB−V of 0.31 mag. Behind the cluster there is an abrupt increase in absorption. Our results are compatible with those of Neckel & Klare (1980).
Finally, we observe different behavior of the trend of the polarization with respect to the absorption. Probably, this is the result of several factors: the cluster is very widespread, the dust that polarizes the starlight has different polarimetric characteristics depending on the zone in which the star is located, the dust components have different densities and the elements that make up the dust grains do not affect the polarization but they do affect the absorption.

