


 nueva página del texto (beta)
 Inglés (pdf)
 Artículo en XML
 Referencias del artículo
 Enviar artículo por email
 Citado por SciELO
  Similares en
SciELO
Similares en
SciELO 
 Permalink
1. INTRODUCTION
The cold interstellar medium (ISM) constitutes a variety of gas and dust structures such as shells, cavities, filaments, arcs and loops (Brand & Zealey 1975). The evolution of these structures is assumed to be ruled by the bubbles and superbubbles produced by supernova explosions and high pressure events, such as violent stellar wind emitted from stellar associations (Weaver et al. 1977). Using 100 and 60 µm IRAS maps, Kiss et al. (2004) and Koenyves et al. (2007) investigated 462 far-infrared loops, studied their luminosity distributions and concluded that these structures might be formed and governed by supernovae and young stellar winds at low Galactic latitude.
Odenwald and Rickard (1987) and Odenwald (1988) investigated 15 high Galactic latitude clouds with comet-like appearance in the 100µm IRAS maps and studied their far-IR properties. The discovery of a very large (≈ 9o) jet like structure in the far infrared (Weinberger & Armsdorfer 2004) reveals the interactions of the wind of the AGB stars with ambient matter. On 100 and 60 µm IRAS maps, Aryal et al. (2010) found two giant (2.1 pc, 0.9 pc) bipolar dust emission structures centred on PN NGC 1514. They represent one of the very few known cases where the history of all main mass-loss phases of a star of intermediate initial mass is preserved. In another work, Aryal et al. (2009) noticed that the PN NGC 2899 is located at the center of a huge (14 pc × 11 pc) quadrupolar cavity, whose directions of axes coincide with the directions of the main axes of the optical PN. Aryal & Weinberger (2006) detected a new infrared nebula (R.A.=08h27m, Dec. = +25o54’[J2000]) with an apparent size of ≈ 140′ × 70′, and suggested that the pulsar PSR B0823+26 might be responsible for its shaping.
In this paper we intend to investigate the core region of a few selected far infrared loops (KKloops, hereafter) studied by Kiss et al. (2004) and Koenyves et al. (2007); they are located in the nearby Galactic plane (−20o<b<20o). We calculate the dust color temperature of the core region and compare it with the temperature of its outer region. We also study the distribution of dust color temperature and dust mass. In addition, we discuss the inclination angles of the core and the outer region. Finally, we draw tentative conclusions regarding the sign of interactions of their precursors’ wind with the ambient matter. The selection procedure of four KKloop candidates is described in § 2. A description of dust color temperatures, dust mass and inclination angles is given in § 3. Our results are presented in § 4. Finally, we summarize our conclusions in § 5.
2. FAR INFRARED LOOPS
Kiss et al. (2004) and Koenyves et al. (2007) reported 462 far infrared loop-like structures (KKloops) found in 100 and 60 µm IRAS maps. Taylor et al. (1993) and Manchester et al. (2005) compiled a database of 558 radio pulsars and 1509 spin-powered pulsars. We checked the distance of these pulsars from 462 far infrared KK-loop centers. Thirty seven ATNF pulsars were found to be located within 1o radius of 30 KK-loop centers. Out of these, distances were available for 12 KK-loops. We systematically studied these 12 KK-loops in the 60 and 100 µm IRAS maps using Sky View Virtual Observatory (http://skyview.gsfc.nasa.gov/current/) and selected 4 KK-loops for the study on the basis of the following selection criteria: (1) the core region of the loop should have flux minima on 100 µm IRAS maps; (2) the major diameter should be > 0.5o; (3) they should be located within 1o of an ATNF pulsar; (4) they should lie in the Galactic plane (−20o<b<20o); and (5) they should show no diffuse optical emission.
The database of 4 KK-loops is listed in Table 1. The KK-loop G143+07 has the largest projected area (≈ 13.5 square degrees) and G323-02 the smallest (0.48 square degrees). The KK-loop G007+18 is the nearest (150 pc) and G323-02 is the most distant (3.45 kpc).
Table 1 The database of 4 far infrared loops (KK-loops).
| GIRL | α(J2000) (deg) | δ(J2000) (deg) |
PSR |
d
NP (deg) |
D (kpc) |
| G007+18 | 17h00m05s | −11o55’51” | J1720-1633 | 0.56 | 0.151 |
| G143+07 | 03h59m02s | +63o41’35” | J0406+6138 | 0.47 | 0.902 |
| G214-01 | 05h51m45s | −01o37’36” | J0652-0142 | 0.71 | 1.503 |
| G323-02 | 15h37m47s | −58o25’54” | J1535-5848 | 0.59 | 3.453 |
*The first column lists the KK-loop identifier GIRL (Galactic InfraRed Loops: Glll+bb). The second and third columns contain positions. The next two columns list the name of the nearby pulsar and its distance from the KK-loop centers. The last column gives the distance to the KK-loops and its reference.
1Schwartz (1987), 2Crawford (1994), 3Launhardt & Henning (1997), 4Koo & Reach (1992).
Figure 1 shows the relative positions of the core of the KK-loops, the pulsar and the KK-loop. In all FIR maps (Figures 2a-5a), the pulsars are located outside the core region. The role of these pulsars (or other sources) for the formation and evolution of these FIR loops will be addressed in the future. In the present work we intend to study the dust color temperature and the dust mass distribution in the core region of the loop and compare it with the outer structure.
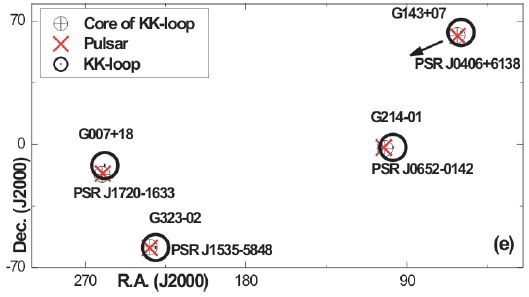
Fig. 1 Positions of the four KK-loops (big hollow circles with dots at the centers), core regions (small hollow circles with a plus) and nearby pulsars (crosses). The size of the circles does not represent the exact diameter of the loops. The names of the KK-loops and the pulsars are shown.
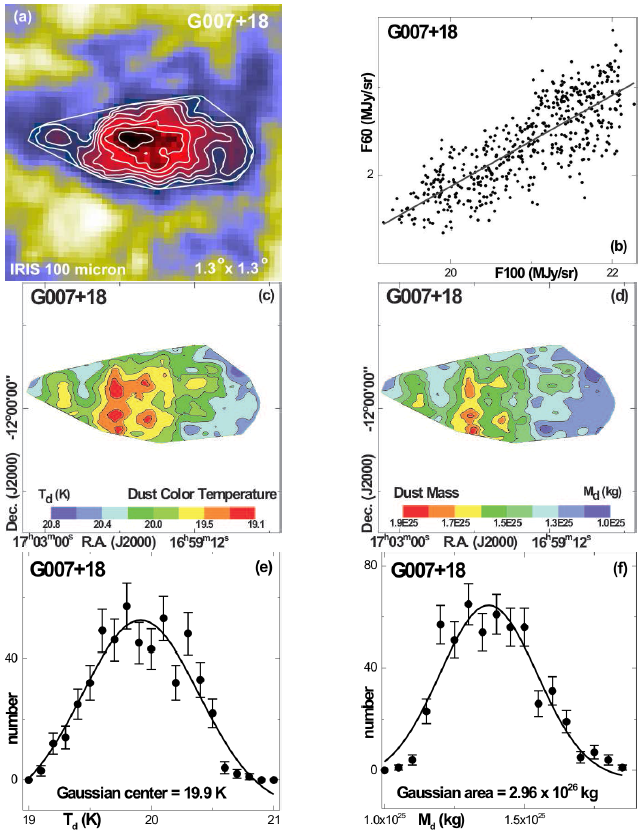
Fig. 2 (a) IRIS 100 µm far infrared images of the core region of KK-loop G007+18 centered at (a) RA (J2000) = 17h00m5.4s, Dec (J2000) = −11o55’51.2”. The contours and image size are shown. The IRAS contours represent 19.2, 19.6, 19.9, 20.3, 20.7, 21.1, 21.5 and 21.9 MJy sr−1. (b) Flux at 100 µm versus 60 µm. (c) Dust color temperature contour map. (d) Dust mass. The contour levels are shown. (e) and (f) distribution of dust color temperature and dust mass. The solid curves represent Gaussian fits. The Gaussian parameters are given. The color figure can be viewed online.
3. METHODS
We briefly describe the method of calculation for the dust color temperature, the dust mass and the inclination angle of the selected four KK-loops.
3.1. Dust Color Temperature
We calculate the dust color temperature of all pixels in the core region of four KK-loop candidates and study their distribution. In addition, we use the data from the GIRL catalog (Kiss et al. 2004) & Koenyves et al. 2007) to calculate the average dust color temperature of these KK-loops. Then we compare between the temperature distribution of the core region and the average temperature of the larger structure. For the calculation of the dust color temperature we adopt the method proposed by Schnee et al. (2005) and Dupac et al. (2003). According to Schnee et al. (2005), the flux density of emission at a wavelength λi is given by,
where Nd and β represent the column density of dust grains and the emissivity spectral index. The symbol α is a constant that relates the flux to the optical depth of the dust, and Ωi is the solid angle subtended at λi by the detector. According to Dupac et al. (2003)), the observed inverse relationship between emissivity spectral index (β) and temperature (T) is given by
Here δ and w are free parameters. Dupac et al. (2003) found that the temperature of the emissivity spectral index is very well fitted with the hyperbolic approximating function. Since the dust emission is optically thin at 60 and 100 µm the ratio, R, of the flux densities (Schnee et al. 2005) is
Once the value of β is known, one can use equation (3) to derive Td. The value of β depends on dust, grain properties (e.g., composition, size, compactness, structure, etc). Its value is assumed to be zero for a perfect blackbody. The amorphous layer-lattice matter has a β ≈ 1, and the metals and crystalline dielectrics have β ≈ 2. For a smaller value of Td, equation (3) can be approximated as,
Taking the natural logarithm on both sides of equation (4) we find the expression for the temperature as
where
F(60µm) and F(100µm) are the flux densities at 60µm and 100µm respectively. The presence of multiple temperatures is removed by plotting and fitting flux densities at 60µm versus 100µm. The slope, F(60)/F(100), is used to calculate the dust color temperature and hence the Planck function.
The background emission is subtracted from the field using the method adopted in Aryal et al. (2010). For this, we used as a reference the surrounding region where the flux density is minimum. By means of a histogram, the average value can be determined. This average background is subtracted from each pixel. The foreground emission is also subtracted from the region by considering the flux density contributed by the nearby stars and IRAS sources. The errors given for the dust color temperature and the mass are mainly due to the uncertainty of the background and foreground subtraction. The background correction is done in both the 60 and 100µm IRIS maps. We use ALADIN2.5 software to obtain the values of the flux density from the FITS image of the region of interest. The FITS images of the KK-loops are downloaded from the SkyView Virtual Observatory (http://skyview.gsfc.nasa.gov/current/).
3.2. Dust Mass
For the calculation of dust mass we first obtain the value of flux density (Sν) with the 100µm maps. The dust masses are estimated using (Hildebrand 1983),
where the weighted grain size (a) = 0.1 µm, the grain density (ρ) = 3000 kg m−3, the grain emissivity (Qν) = 0.0010 (for 100 µm) (Young et al. 1993). At a wavelenght of 100 µm the expression for the dust mass (6) reduces to
The Planck function is calculated using the slopes of fitted scatter plots (Figures 2-5b) between flux densities at 60µm versus 100µm. We use the known distance of the loops to calculate the dust mass.
3.3. Inclination Angle
The long axis of the KK-loops can be assumed to be inclined by a certain angle with respect to the plane of the sky. The inclination angle i (angle between the line-of-sight and the normal vector of the plane of the loops) can be estimated using the formula by Holmberg (1946):
where b/α represents the measured axial ratio and q is the intrinsic flatness of the cavity. Since we have in the database the diameters of four loops we determine their inclination angles. We use the value of the intrinsic flatness q = 0.33 as suggested by Holmberg (1946) for an oblate spheroid structure.
4. RESULTS AND DISCUSSION
We describe the physical properties of four KKloop candidates and compare them with the available GIRL data of each KK-loop.
4.1. G007+18
The size of KK-loop G007+18 is 2.2o × 2.1o (Koenyves et al. 2007) whereas its core size is 0.9o × 0.4o. Therefore the core region of this loop is only ≈ 8% of the whole loop. An extended principal minimum can be seen in the central region (Figure 2a). We calculated the dust color temperature (Td hereafter) of each pixel in the region of interest. The average value of Td, calculated using the slope of F(100) and F(60) plot (Figure 2b), is found to be minimum, i.e., 20.1±1.1K. The minimum and maximum value of Td are found to lie in the range 19.1±1.1K and 20.8±1.2K. An offset of < 2K suggests that the core of the loop is stable. The minimum temperature region is found to be elongated along the north-south direction (Figure 2c). The dust mass contours (Figure 2d) seem to follow the expected trend: higher density in the low temperature region.
The distribution of Td is well fitted by a Gaussian (Figure 2e). The value of Td of the larger structure is found to be 33.0±2.1K. Therefore the cavity is colder in the high density core region than in the outer region. The value of ∆Td of the core region is small, indicating that the dust is mostly in thermal equilibrium, whereas in the outer region the temperature offset is 15 K. An offset of 15 K suggests that the cavity is not in thermal equilibrium. The inclination angle of its core (area ≈ 0.36 square degree) is found to be 83o (edge-on), whereas it is 25o (faceon) as a whole (area ≈ 4.6 square degrees). Therefore the inner region of KK-loop G007+18 is found to be oriented at about 58≈60o (assuming the loop is in the sky plane). This means that our dusty loop is neither face-on (i → 0o) nor edge-on (i → 90o).
4.2. G143+07
The loop G143+07 shows a minimum value of Td (23.8±1.2K) in the eastern region (Figure 3a). Similarly to G007+18, the low temperature region is found to be elongated along the north-south direction (Figure 3c,d). The value of Td at the core and at the outer region is found to be 23.7±1.2K and 36.2±1.2K, with a minimum difference of ≈ 12K. Therefore the core region is more stable (∆Td < 2K) and hence might have preserved its past history (when the FIR cavity was formed). The Gaussian distribution is found to fit well both the Td and Md distributions (Figure 3e,f).
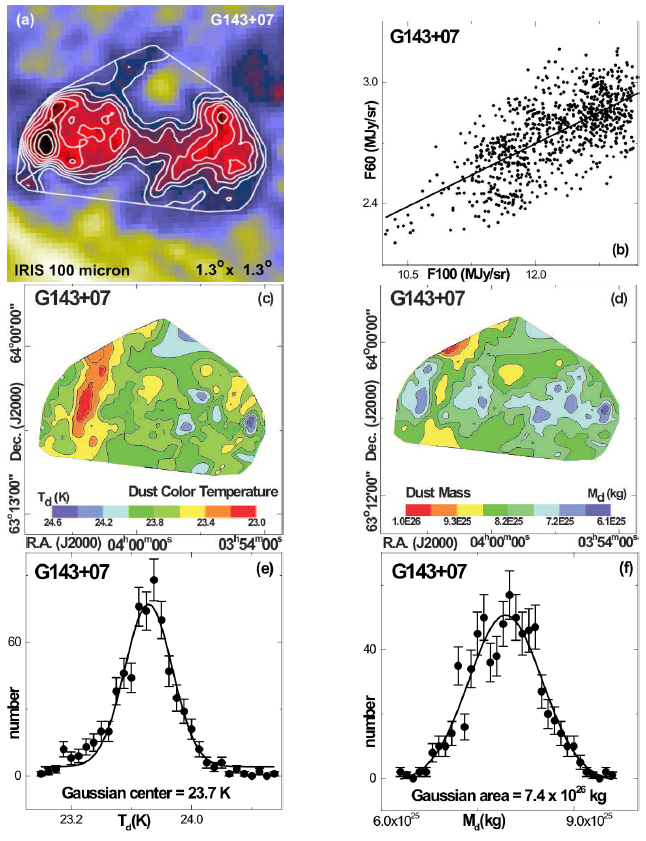
Fig. 3 (a) IRIS 100 µm far infrared images of the core region of KK-loop G143+07 centered at (a) RA (J2000) = 03h59m02s, Dec (J2000) = +63o41’35”. The contours and image size are shown. The IRAS contour represent 10.2, 10.5, 10.9, 11.2, 11.6. 11.9, 12.2 and 12.6 MJy sr−1. (b) Flux at 100 µm versus 60 µm. (c) Dust color temperature contour map. (d) Dust mass contour map. The contour levels are shown. (e) and (f) distribution of dust color temperature and dust mass. The solid curves represent Gaussian fits. The Gaussian parameters are given. The color figure can be viewed online.
The inclination angles of the core and the whole loop are found to be 76o and 65o, respectively. This means that the inclination angle of the inner region of the KK-loop G143+07 differs by about 10o (assuming the loop is in the sky plane) from that of its outer structure. This suggests that the structure might be nearly edge-on. However, the 2D structure shows a bimodal feature (Figure 3a). Considering the inner contour levels, the inclination angles of the eastern and western loops are ≈ 45o. This suggests that the core of this KK-loop is somewhat bimodal.
Table 2 Inclination angle, dust color temperature and dust mass*
| GIRL |
i (KK) (deg) |
i (core) (deg) |
Td (KK) (K) |
Td (core) (K) |
Md(core) (×1026 kg) |
| G007+18 | 25 | 83 | 33.0 | 19.9 | 2.96 |
| G143+07 | 65 | 76 | 36.2 | 23.7 | 7.42 |
| G214-01 | 25 | 71 | 46.7 | 19.4 | 135.04 |
| G323-02 | 57 | 72 | 32.1 | 25.3 | 1822.2 |
*The first column lists the name of the KK-loops.
4.3. G214-01
Similarly to loop G007+18, this loop has a very strong flux-minimum at the central region, with Td = 20.0±1.1K (Figure 4a). The average Td of the larger structure is very high, ≈ 46.7±2.4 K. An offset of about 27 K strongly suggests that the structure is driven by external causes. In the dust color contour map (Figure 4c), the low temperature region is found to be elongated along the north-south direction, like in the previous loops. The dust color contour map (Figure 4d) verifies the fact that the dense region has a low temperature in the far infrared. In this case, the core region is rather compact, covering only 4.2% of the projected area of the whole loop. Therefore the outer region seems to be isolated from the core. The inclination angles of the core and the outer region of this loop are 71o and 25o, respectively. This means the core is edge-on whereas the outer region is nearly face-on. This difference hints at the possibility of an external cause.
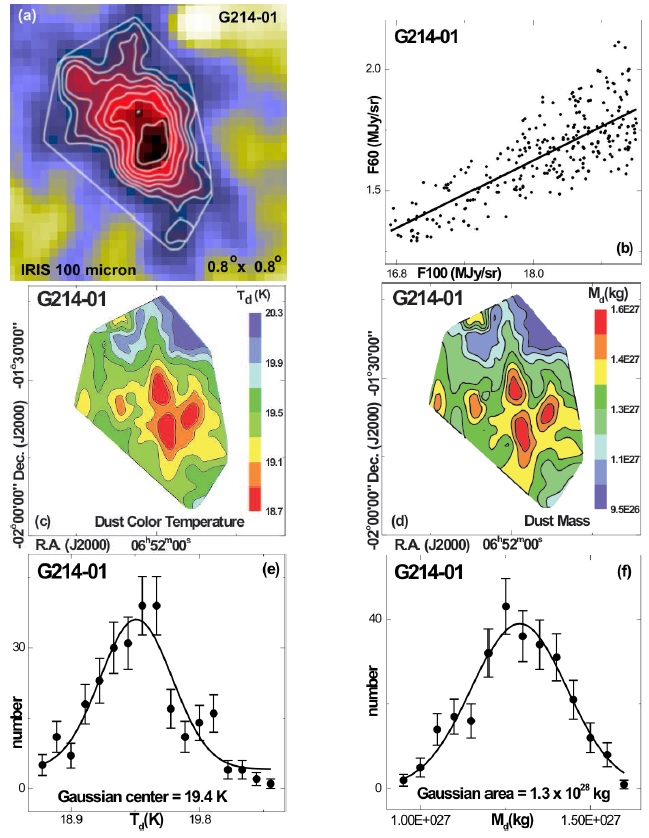
Fig. 4 (a) IRIS 100 µm far infrared images of the core region of KK-loop G007+18 centered at (a) RA (J2000) = 05h51m45s, Dec (J2000) = −01o37’36”. The contours and image size are shown. The IRAS contour represent 16.7, 17.0, 17.3. 17.6, 17.8, 18.1, 18.4 and 18.6 MJy sr−1. (b) Flux at 100 µm versus 60 µm. (c) Dust color temperature contour map. (d) Dust mass contour map. The contour levels are shown. (e) and (f) distribution of dust color temperature and dust mass. The solid curves represent Gaussian fits. The Gaussian parameters are given. The color figure can be viewed online.
4.4. G323-02
This loop is one of the distant (3.45 kpc) far infrared loops, having a core size of 0.6o × 0.5o, about 63% of the projected area of the whole loop. Interestingly, this KK-loop shows a minimum value of Td (Figure 5c) at the positions where flux density at 100 µm is not a maximum (Figure 5a). The dust mass contours (Figure 5d) are found to follow the dust color temperature contours. The observed dust color and dust mass distribution do not follow Gaussian distributions, suggesting that the loop is strongly affected by external causes. A deviation from a Gaussian distribution suggests that the core region might not be in thermal equilibrium, like the previous three cores of KK-loops. Both the core and the outer region of this KK-loop are nearly edge-on (i>55o).
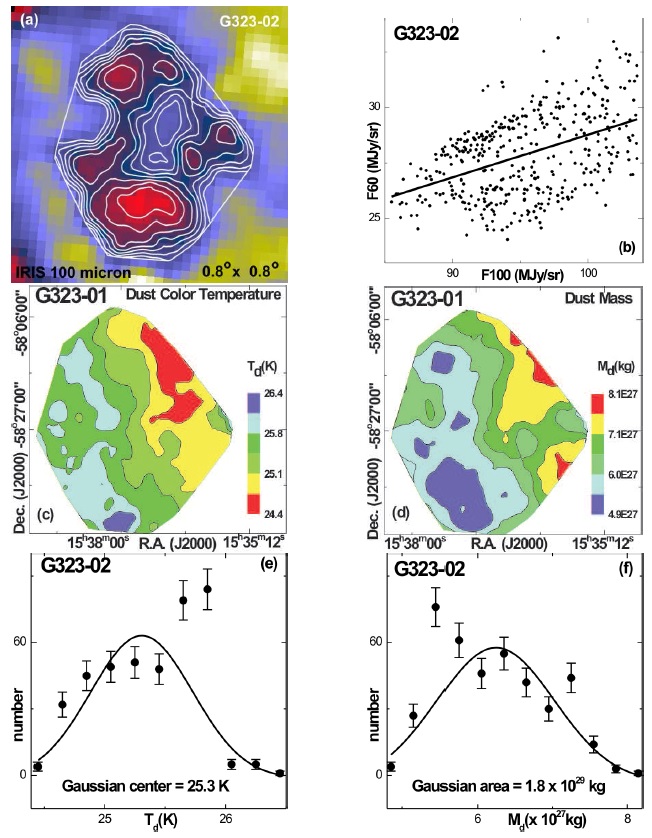
Fig. 5 (a) IRIS 100 µm far infrared images of the core region of KK-loop G323-02 centered at (a) RA (J2000) = 15h37m47s, Dec (J2000) = −58o25’54”. The contours and image size are shown. The IRAS contour represent 85.45, 87.73, 90.00, 92.28, 94.55, 96.83, 99.10 and 101.4 MJy sr−1. (b) Flux at 100 µm versus 60 µm. (c) Dust color temperature contour map. (d) Dust mass contour map. The contour levels are shown. (e) and (f) distribution of dust color temperature and dust mass. The solid curves represent Gaussian fits. The Gaussian parameters are given. The color figure can be viewed online.
5. CONCLUSIONS
We present the physical properties of four dusty loops in far infrared (60 µm and 100 µm) IRIS maps found to be located around ATNF pulsars (within 1o radius). The dust color temperature, dust mass and inclination angle of the core region of these loops are studied and compared with the larger structures discovered by Kiss et al. (2004) and Koenyves et al. (2007) in IRAS maps. We summarize our results as follows:
Except for one KK-loop (G323-02), the dustcolor temperature and dust mass distributions are very well fitted by a Gaussian. However the outer regions show relatively higher temperatures, with an offset from 14-20K from that of the core regions. This suggests that the core region tends to be in thermal equilibrium, while the outer region does not. Therefore, the core region of KK-loops might have preserved the past history of the formation and evolution of FIR loops. The minimum temperature region at 100 µm flux maxima is found to be elongated along the north-south direction in these three KK-loops. The role of pulsars near these KK-loops should be studied in the future.
The inclination angles of the core region of allloops are found to be greater than 70o, suggesting an edge-on appearance. The outer regions are found to have inclination angles < 20o (nearly face-on) for three loops (G143+07, G214-01 and G323-02) and of ≈ 55o forG007+18. Therefore the velocity maps of these loop regions are extremely important to understand their 3D structure.
The superposition and possible interaction of these loops with pulsars (or other sources?) will be studied in the future. In addition, the amount of expelled mass from the central region will be calculated in order to estimate the energy required for the formation of the structure.
We are indebted to the referee for his/her constructive criticism and useful comments. We acknowledge SIMBAD database, Sky View Virtual Observatory, ATNF pulsar catalog, IRAS surveys and GIRL catalog. One of the authors (AKJ) acknowledges Central Department of Physics, Tribhuvan University, Nepal for all kinds of support for his Ph.D. work.

