


 nueva página del texto (beta)
 Inglés (pdf)
 Artículo en XML
 Referencias del artículo
 Enviar artículo por email
 Citado por SciELO
  Similares en
SciELO
Similares en
SciELO 
 Permalink
1. INTRODUCTION: BYURAKAN - IRAS STARS CATALOG
Asymptotic giant branch (AGB) stars are very luminous objects, in a fast evolutionary phase which mix up the atomic nuclei produced by nuclear reaction in the inner part of the star into the external envelope and then into the interstellar space through the stellar wind and the final formation of a planetary nebula. A better census of the AGB star population and good knowledge of their physical characteristics and variability are basic requirements to perform satisfactory checks of our models of stellar evolution and to study the chemical evolution of our Galaxy (Lebzelter et al. 2012; Bladh et al. 2013; Nowotny et al. 2013). The forthcoming direct distance measures by the GAIA mission of the stars within several kpc from the Sun will allow a substantial improvement in this field. With this aim in mind, we performed a study of a sample of AGB candidates collected in the Byurakan Infrared Stars (BIS) catalog (Mickaelian & Gigoyan 2006), based on the spectra of galactic sources visible in the objective prism plates of the First Byurakan Survey (FBS) (Markarian et al. 1989) and on the IRAS Point Source Catalog IRAS PSC (1988).
In 1983, the Infra Red Astronomical Satellite (IRAS) surveyed about 96% of the sky in bands centred at 12, 25, 60, and 100µm. More than 245000 point sources were detected and their fluxes and positions were listed in the IRAS Point Source Catalog (PSC). A recent work by Abrahamian et al. (2015) made a cross-check of the IRAS (PSC) and Faint Sources Catalog (FSC) (Moshir et al. 1989) improving their positions and correlation with infrared sources detected by more recent missions (WISE (Cutri et al. 2012) , AKARI (Ishihara et al. 2010), 2MASS (Cutri et al. 2003)). The IRAS archive also includes several spectra in the Low-Resolution Spectra catalog (IRAS LRS 1988) in the range 7.7−22.6 µm providing useful indications on the chemical composition of the dust shells around the stars (see Olnon & Raimond 1986, and the IRAS Explanatory Supplement 1988).
The BIS catalog contains data for a final census of 276 IR sources as potentially being stars of late spectral types. The stars were selected on the basis of their low resolution spectra of FBS and of the Dearbon Astronomical Observatory (Lee et al. 1947). Images of the Palomar Observatory Sky Survey (DSS, Abell 1959 ) were also used to check the identification. The most recent citations of literature spectral types are found in Skiff (2016).
The identifications on the FBS plates were carried out in the region with δ > +61o and galactic latitude b > +15◦, covering a surface of 1504 deg2.
For each object information is provided on accurate optical positions for two epochs (B1950 and J2000), photometric data after cross-correlationwith MAPS (Cabanela et al. 2003), USNO-B1.0 (Monet et al. 2003) and 2MASS catalogs, proper motions (PM) and a classification based on the Digitized First Byurakan Survey spectra (DFBS, Mickaelian et al. 2007) accessible online from the webpage http://ia2.oats.inaf.it/. The stars have intermediate values of galactic coordinates, ranging in longitude between 90 and 151 degrees, and in latitude between 14 and 45 degrees, with an average value of 30 degrees: they are therefore outside the solar circle and are likely members of the halo / thick-disk population.
To clarify the nature of the stars included in the BIS catalog we made a systematic collection of all the information available in the literature and acquired new photometric and spectroscopic data.
This paper is devoted to the optical properties of a subsample of 95 stars randomly selected, while a companion paper will be dedicated to the infrared characteristics of all the stars of the BIS catalog using data collected from public archives. § 2 describes our targets; § 3 and 4 are devoted to the observations and data analysis; § 5 is devoted to estimate and discuss the parameters of the IR sources; our conclusions are summarised in § 6.
2. OUR TARGETS
The BIS catalog contains several types of sources, including M and CH stars, Mira-type and semiregular (SR) variables, OH and SiO sources, N-type carbon stars and unknown sources surrounded by thick circumstellar shells. Most of our targets are poorly studied both from the photometric and spectroscopic point of view, and only a few of them are classified as variables in the General Catalog of Variable stars (GCVS, Samus et al. 2017) or in the Variable Star Index (VSX, Watson et al. 2016). A preliminary clue of variability was given in Mickaelian & Gigoyan (2006) using the differences B1−B2 and R1−R2 of the two epochs of the DSS as reported in the USNO-B1.0 catalog.
Among the 276 stars of the BIS catalog, 13 have color index 1.5 ≤ B − R ≤ 2.5, the remaining have B − R ≥ 2.5 mag. We obtained new optical CCD multi-band photometry and medium resolution spectra of a sample of 95 stars, we randomly selected 9 with color index ≤2.5 in order to check the reliability of the original classification and to classify two stars having no previous classification. We also obtained the spectrum of BIS028, already known to be a planetary nebula.
3. OBSERVATIONS
Spectra in the range 3940-8500 Å, with a 3.9 Å/pixel dispersion, were obtained with the Cassini telescope of the Bologna Astronomical Observatory (Italy) at Loiano, equipped with the Bologna Faint Objects Spectrometer and Camera (BFOSC) and a EEV P129915 CCD. Photometric observations were also obtained with BFOSC, when possible on the same dates as the spectra. Some objects were observed also at the Copernico Cima Ekar telescope of the Padova Astronomical Observatory (Italy) equipped with the Asiago Faint Objects Spectrometer and Camera (AFOSC) with a TK1024AB CCD. All stars were always observed in the red Johnson filter.
Photometric observations were also performed in the R filter in the period July-November 2011 with the TACOR2 telescope of the Department of Physics of the University “La Sapienza” in Rome equipped with an Apogee U2 CCD. The data were reduced by means of standard IRAF procedures3.
Table 1 presents the journal of observations; the columns list the following: 1: BIS number in the catalog; 2: IRAS FSC designation of the objects; 3: date of observations; 4: spectral type according to the classification from our CCD spectra; 5: red magnitude at the date of observation and observatory: 1 Loiano; 2 Cima Ekar; all the other data were obtained with the TACOR telescope; 6: magnitude range from the archive of the Northern Sky Variability Survey (NSVS, Wozniak et al. 2004a; see § 4.2); 7: our variability classification defined in § 4.2.
Table 1 Log of observations, spectral classification, magnitudes and variability class
| BIS | IRAS FSC | Date | Sp. Type | R mag | Rr | Var. Class |
| 001 | F03503+6918 | 29 Nov 13 | M7 III | 10.17 ± 0.951 | 2 | |
| 002 | F03535+6945 | 16 Dec 13 | M5 III+ em | 10.9 ± 0.101 | 2e | |
| 13 Jan 16 | 10.92 ± 0.081 | |||||
| 13 Jan 16 | 8.7 ± 0.1 1 | I mag | ||||
| 003 | F03558+7007 | 16 Dec 13 | M6 III | 9.78 ± 0.081 | 2 | |
| 004 | F03564+7148 | 16 Dec 13 | M3 III | 9.93 ± 0.061 | 2 | |
| 006 | F04067+7139 | 17 Dec 13 | M6 III | 10.26 ± 0.101 | 2 | |
| 007 | F04125+7106 | 22 Jan 08 | S5/6 | 11.25 ± 0.061 | 9.3−11.8 | 1 |
| 010 | F04137+7016 | 18 Dec 13 | M5III-IV | 16.77±0.051 | 2/3 | |
| 14 Feb 17+ | 16.63±0.051 | |||||
| 14 Feb 17 | 14.01±0.071 | I mag. | ||||
| 014 | F04173+7232 | 18 Dec 13 | M6 III | 10.93 ± 0.071 | 2 | |
| 015 | F04174+7111 | 18 Dec 13 | M7 III | 11.43 ± 0.121 | 2 | |
| 032 | F05088+6948 | 17 Feb 14 | M8 III | 12.51± 0.051 | 2 | |
| 034 | F05143+7048 | 22 Jan 08 | S2/3 | 8.3 ± 0.1 1 | 8.6−8.8 | 3 |
| 036 | F05235+6918 | 22 Jan 08 | N+dust | 16.45 ± 0.051 | 2 | |
| 13 Jan 16 | 15.53 ± 0.081 | |||||
| 13 Jan 16 | 18.27 ± 0.091 | V mag | ||||
| 18 Mar 16 | 16.1 ± 0.1 1 | |||||
| 14 Feb 17 | 15.30 ± 0.08 1 | |||||
| 037 | F05286+7105 | 18 Dec 13 | M7 III | 12.72 ± 0.08 1 | 2 | |
| 038 | F05342+7120 | 12 Feb 07 | M8 III | 11.48 ± 0.03 | 11.1−11.6 | 2 |
| 039 | F05357+7054 | 22 Jan 08 | M3 II | 8.9 ± 0.2 1 | 9.2−9.4 | 2 |
| 043 | F05435+6908 | 22 Jan 08 | M6III | 10.93 ± 0.03 1 | 10.2−10.8 | 2 |
| 07 Dec 08 | 10.47 ± 0.04 2 | |||||
| 044 | F05468+7300 | 17 Dec 13 | M4 III | 9.12 ± 0.1 1 | 3 | |
| 067 | F05504+6215 | 22 Jan 08 | M1 III | 9.2 ± 0.2 1 | 9.2−9.4 | 3 |
| 087 | F06404+6324 | 18 Dec 13 | M1 III | 9.22 ± 0.2 1 | 3 | |
| 088 | F06408+6402 | 18 Dec 13 | M3 III | 10.07 ± 0.05 1 | 2 | |
| 099 | F08209+6303 | 17 Dec 13 | M3 III | 10.09 ± 0.08 1 | 3 Catalina Var | |
| 102 | F08293+6131 | 17 Dec 13 | M3.5 III | 9.5 ± 0.1 1 | 3 | |
| 103 | F08588+6442 | 17 Feb 14 | M5 III | 10.73 ± 0.05 1 | 2 | |
| 104 | F09329+6230 | 16 Dec 13 | M6 III | 11.19 ± 0.05 | 2 Catalina | |
| 106 | F10009+6459 | 20 May 14 | M5 III | 9.86 ± 0.09 1 | 2 Catalina | |
| 107 | F10023+6334 | 21 May 14 | M3.5 III | 9.7 ± 0.1 1 | 2/3 | |
| 110 | F13187+6237 | 21 May 14 | M0 III | 8.5 ± 0.2 1 | 3 | |
| 113 | F14492+6231 | 21 May 14 | M7 III | 10.73 ± 0.05 1 | 2/3 Catalina | |
| 116 | F15181+6241 | 13 Jul 07 | M0-M4 III | 11.0 ± 0.1 1 | 10.2−11.3 | 1 Catalina |
| 07 Jul 08 | 11.4 ± 0.1 1 | |||||
| 06 Jul 11 | 10.9 ± 0.1 | |||||
| 02 Aug 11 | 10.6 ± 0.1 | |||||
| 11 Aug 11 | 10.3 ± 0.3 | |||||
| 22 Oct 11 | 11.0 ± 0.1 | |||||
| 28 Mar 15 | 11.3 ± 0.1 1 | |||||
| 120 | F16359+6439 | 12 Jul 07 | M6 III | 11.20 ± 0.07 1 | 10.0−10.6 | 2 |
| 06 Jul 11 | 10.87 ± 0.06 | |||||
| 05 Aug 11 | 11.27 ± 0.05 | |||||
| 16 Aug 11 | 11.20 ± 0.06 | |||||
| 09 Oct 11 | 10.80 ± 0.07 | |||||
| 122 | F17249+6428 | 12 Jul 07 | M7 III | 12.41 ± 0.05 1 | 11.4−12.4 | 2e Catalina |
| 01 Aug 07 | 12.48 ± 0.05 1 | |||||
| 10 Jul 11 | 12.30 ± 0.07 | |||||
| 06 Aug 11 | 12.48 ± 0.05 | |||||
| 22 Aug 11 | 12.44 ± 0.05 | |||||
| 01 Oct 11 | 13.06 ± 0.05 | |||||
| 123 | F17305+6432 | 03 Aug 07 | M5 III | 10.8 ± 0.1 1 | 10.5−11.0 | 2 |
| 10 Jul 11 | 10.6 ± 0.1 | |||||
| 05 Aug 11 | 10.30 ± 0.05 | |||||
| 22 Aug 11 | 10.38 ± 0.07 | |||||
| 01 Oct 11 | 10.18 ± 0.06 | |||||
| 126 | F17579+6118 | 04 Aug 07 | M5 III | 10.08 ± 0.08 1 | 9.7−10.0 | 2 Catalina |
| 09 Jul 11 | 10.0 ± 0.1 | |||||
| 07 Aug 11 | 10.2 ± 0.1 | |||||
| 31 Aug 11 | 10.2 ± 0.1 | |||||
| 01 Oct 11 | 10.1 ± 0.2 | |||||
| 132 | F18203+6210 | 03 Aug 07 | M7 III | 11.24 ± 0.06 1 | 9.9−11.0 | 2 |
| 11 Jul 11 | 11.15 ± 0.08 | |||||
| 02 Aug 11 | 11.2 ± 0.1 | |||||
| 31 Aug 11 | 10.95 ± 0.07 | |||||
| 03 Oct 11 | 11.26 ± 0.08 | |||||
| 133 | F18230+6418 | 11 Jul 07 | M8 III | 14.58 ± 0.02 1 | 10.0−13.6 | 1 Catalina |
| 11 Jul 11 | 13.93 ± 0.04 | |||||
| 02 Aug 11 | 14.31 ± 0.03 | |||||
| 06 Sep 11 | 14.55 ± 0.03 | |||||
| 08 Oct 11 | 14.15 ± 0.06 | |||||
| 136 | F18295+6135 | 03 Aug 07 | M5 III | 9.9 ± 0.1 1 | 9.5−10.1 | 2 |
| 12 Jul 11 | 10.10 ± 0.05 | |||||
| 04 Aug 11 | 9.93 ± 0.06 | |||||
| 31 Aug 11 | 10.08 ± 0.08 | |||||
| 06 Sep 11 | 10.15 ± 0.05 | |||||
| 03 Oct 11 | 10.00 ± 0.07 | |||||
| 137 | F18307+6153 | 04 Aug 11 | M0 I | 8.8 ± 0.1 | 9.2−9.3 | 3 |
| 31 Aug 11 | 8.9 ± 0.1 | |||||
| 03 Oct 11 | 8.8 ± 0.1 | |||||
| 138 | F03502+6925 | 16 Dec 13 | M7 III | 8.86 ± 0.06 | 2 | |
| 142 | F07550+722 | 17 Dec 13 | M5 III | 9.70 ± 0.06 1 | 2 | |
| 143 | F07554+7246 | 17 Dec 13 | M2 III | 8.7 ± 0.1 1 | 3 | |
| 145 | F08149+6221 | 16 Dec 13 | M5 III | 8.6 ± 0.1 1 | no data | |
| 16 Dec 13 | 8.60 ± 0.08 | |||||
| 154 | F12234+6915 | 20 May 1 4 | M7 III | 10.04 ± 0.06 | 2 | |
| 155 | F13549+7012 | 28 Mar 15 | M1 III | 9.2 ± 0.09 | 8.9 | 3 |
| 156 | F15521+7138 | 20 June 15 | M5 III | 10.4 ± 0.08 | 10.2 | 2 |
| 167 | F17278+6416 | 02 Aug 07 | M6 III | 10.76 ± 0.08 1 | 10.2−10.6 | 2 |
| 10 Jul 11 | 11.1 ± 0.2 | |||||
| 05 Aug 11 | 11.2 ± 0.2 | |||||
| 22 Aug 11 | 10.8 ± 0.1 | |||||
| 01 Oct 11 | 10.9 ± 0.2 | |||||
| 168 | F17313+7033 | 12 Jul 07 | M6 III | 9.87 ± 0.07 1 | 9.4−9.7 | 2/1 |
| 08 Jul 11 | 9.89 ± 0.06 | |||||
| 07 Aug 11 | 9.90 ± 0.07 | |||||
| 16 Aug 11 | 9.78 ± 0.06 | |||||
| 09 Sep 11 | 9.55 ± 0.06 | |||||
| 16 Nov 11 | 9.90 ± 0.07 | |||||
| 170 | F17567+6956 | 01 Aug 07 | M6 III | 11.15 ± 0.08 1 | 10.5−10.9 | 2 Catalina |
| 08 Jul 11 | 11.0 ± 0.1 | |||||
| 06 Aug 11 | 11.05 ± 0.07 | |||||
| 28 Aug 11 | 10.80 ± 0.07 | |||||
| 03 Oct 11 | 10.93 ± 0.08 | |||||
| 16 Nov 11 | 10.9 ± 0.2 | |||||
| 172 | F05116+6508 | 16 Dec 13 | M4 III | 10.15 ± 0.08 | 2/3 | |
| 173 | F05125+6652 | 16 Dec 13 | M6 III | 12.18 ± 0.05 | 2 Catalina 2/3 | |
| 174 | F05141+6509 | 16 Dec 13 | M4 III | 9.88 ± 0.06 | 2/3 | |
| 184 | F06012+6733 | 20 Jan 10 | N + dust | 10.4 ± 0.1 1 | 2 Catalina | |
| 03 Mar 16 | 10.28 ± 0.06 1 | |||||
| 14 Feb 17 | 9.35 ± 0.04 1 | |||||
| 194 | F07003+6815 | 22 Jan 08 | N | 9.3 ± 0.2 1 | 9.4−9.6 | 3 |
| 18 Mar 16 | 9.45 ± 0.09 1 | |||||
| 196 | F07497+6526 | 22 Jan 08 | M8 III | 13.40 ± 0.04 1 | 11.0−12.6 | 1 Catalina |
| 07 Dec 08 | 13.60 ± 0.03 2 | |||||
| 197 | F08034+6612 | 18 Dec 13 | M5 III | 10.14± 0.05 1 | 3 | |
| 198 | F08487+6819 | 22 Jan 08 | M5 III | 11.12 ± 0.03 1 | 10.3−10.9 | 2 Catalina |
| 199 | F08520+6724 | 22 Jan 08 | M1 III | 8.64 ± 0.05 1 | 8.8−9.1 | 3 Catalina Var. |
| 08 Jul 11 | 8.6 ± 0.2 | |||||
| 200 | F10093+6847 | 21 May 14 | M5 III | 10.32 ± 0.08 | 2 | |
| 201 | F10176+6812 | 20 May 14 | M5 III | 10.4 ± 0.1 | 2/3 | |
| 203 | F13576+6705 | 21 May 14 | lateK-M0 III | 9.2 ± 0.1 | 3 | |
| 207 | F16148+6532 | 03 Aug 07 | M5 III | 11.68 ± 0.04 1 | 11.0−12.2 | 2e Catalina |
| 06 Jul 11 | 11.32 ± 0.05 | |||||
| 07 Aug 11 | 11.11 ± 0.05 | |||||
| 22 Aug 11 | 11.19 ± 0.05 | |||||
| 11 Oct 11 | 11.89 ± 0.05 | |||||
| 22 Oct 11 | 11.85 ± 0.06 | |||||
| 209 | F16317+6603 | 04 Aug 07 | M5 III | 10.14 ± 0.04 1 | 9.7−10.4 | 2 |
| 07 Jul 08 | 10.30 ± 0.05 1 | |||||
| 06 Jul 11 | 10.41 ± 0.05 | |||||
| 07 Aug 11 | 10.33 ± 0.06 | |||||
| 22 Aug 11 | 10.42 ± 0.05 | |||||
| 11 Oct 11 | 10.35 ± 0.05 | |||||
| 22 Oct 11 | 10.25 ± 0.05 | |||||
| 210 | F16499+6532 | 06 Jul 11 | M2.5 III | 9.6 ± 0.1 | 9.4−9.6 | 3 |
| 05 Aug 11 | 9.6 ± 0.1 | |||||
| 16 Aug 11 | 9.64 ± 0.07 | |||||
| 09 Oct 11 | 9.60 ± 0.5 | |||||
| 211 | F17547+6849 | 04 Aug 07 | M3.5 III | 9.5 ± 0.1 1 | 10.0−10.4 | 2 |
| 07 Dec 08 | 9.10± 0.06 2 | |||||
| 09 Jul 11 | 10.0 ± 0.1 | |||||
| 06 Aug 11 | 10.3 ± 0.1 | |||||
| 28 Aug 11 | 10.1 ± 0.1 | |||||
| 08 Oct 11 | 9.9 ± 0.1 | |||||
| 212 | F17599+6843 | 02 Aug 07 | M6 III | 10.04 ± 0.07 1 | 9.7−10.2 | 2 |
| 09 Jul 11 | 10.3 ± 0.1 | |||||
| 07 Aug 11 | 10.30 ± 0.07 | |||||
| 28 Aug 11 | 10.45 ± 0.08 | |||||
| 08 Oct 11 | 10.35 ± 0.1 | |||||
| 213 | F03314+7529 | 18 Dec 13 | M7 III | 10.38 ± 0.06 1 | 2 | |
| 214 | F03315+7340 | 18 Dec 13 | M5 III | 13.87 ± 0.07 1 | 2/1 | |
| 215 | F03328+7717 | 15 Jan 16 | M3 III | 12.54 ± 0.04 1 | 3 | |
| 216 | F03353+8722 | 17 Dec 13 | M9/S | 15.3 ± 0.1 1 | 2 | |
| 219 | F04148+7504 | 17 Dec 13 | M4-M5 III | 10.92 ± 0.06 1 | 2e | |
| 222 | F04210+7517 | 19 Jan 10 | N + dust | 18.5 ± 0.2 1 | 2 | |
| 16 Dec 13 | 20.6 ± 0.3 1 | |||||
| 13 Jan 16 | 20.9 ± 0.2 1 | |||||
| 15 Feb 17 | 20.5 ± 0.1 1 | |||||
| 15 Feb 17 | 17.60 ± 0.06 1 | I mag | ||||
| 224 | F04423+7314 | 17 Dec 13 | M5 III | 11.01± 0.05 1 | 2/3 | |
| 226 | F04464+7900 | 17 Dec 13 | M7 III | 12.83 1 | 2 | |
| 228 | F04488+7831 | 18 Dec 13 | M1 III | 8.9 ± 0.1 1 | 3 | |
| 247 | F06561+7359 | 18 Dec 13 | M4.5(E) | 9.71 ± 0.1 1 | 3 | |
| 248 | F06563+7354 | 18 Dec 13 | M4 III | 9.00 ± 0.1 1 | 3 | |
| 255 | F09311+7844 | 08 Jul 11 | M3 III | 9.20 ± 0.05 | 9.3−9.6 | 2/3 |
| 06 Aug 11 | 9.25 ± 0.07 | |||||
| 13 Aug 11 | 9.2 ± 0.1 | |||||
| 256 | F10289+7815 | 22 Apr 08 | M3 III | 3 | ||
| 06 Aug 11 | 8.7 ± 0.2 | |||||
| 13 Aug 11 | 8.9 ± 0.1 | |||||
| 17 Mar 12 | 7.54 ± 0.08 I 1 | |||||
| 17 Mar 12 | 8.56 ± 0.08 R 1 | |||||
| 17 Mar 12 | 9.35 ± 0.07 V 1 | |||||
| 17 Mar 12 | 11.2 ± 0.1 B 1 | |||||
| 258 | F11594+7309 | 20 May 14 | M0 III | 8.64 ± 0.1 | 3 | |
| 260 | F12198+7909 | 08 Jul 11 | M1 III | 8.9 ± 0.1 | 8.9−9.0 | 3 |
| 264 | F13410+8000 | 22 Apr 08 | M4 | 11.82 ± 0.04 1 | 11.6−12.4 | 2e |
| 07 Jul 11 | 11.51 ± 0.07 | |||||
| 04 Aug 11 | 11.97 ± 0.06 | |||||
| 11 Aug 11 | 11.98 ± 0.06 | |||||
| 09 Oct 11 | 11.35 ± 0.05 | |||||
| 267 | F14366+8058 | 20 May 14 | M4 III | 9.8 ± 0.1 | 1 | |
| 271 | F15152+7303 | 20 June 15 | M4 III | 10.5± 0.2 | 10.8 | 2 |
| 275 | F16549+7935 | 03 Aug 07 | M3 II | 9.08 ± 0.07 1 | 8.7−8.9 | 2/3 |
| 06 Jul 11 | 8.93 ± 0.07 | |||||
| 05 Aug 11 | 9.0 ± 0.1 | |||||
| 24 Aug 11 | 8.9 ± 0.1 | |||||
| 27 Nov 11 | 9.1 ± 0.1 | |||||
| 276 | F16583+7852 | 03 Aug 07 | M3.5 III | 10.62 ± 0.05 1 | 10.4−11.4 | 2 |
| 07 Jul 08 | 10.60 ± 0.05 1 | |||||
| 07 Jul 11 | 10.73 ± 0.05 | |||||
| 06 Aug 11 | 10.64 ± 0.05 | |||||
| 24 Aug 11 | 10.70 ± 0.05 | |||||
| 05 Oct 11 | 10.65 ± 0.05 | |||||
| 285 | F18038+8302 | 04 Aug 07 | M3 III | 9.90 ± 0.03 1 | 9.8−10.0 | 2/3 |
| 09 Jul 11 | 9.90 ± 0.05 | |||||
| 04 Aug 11 | 9.88 ± 0.05 | |||||
| 24 Aug 11 | 9.90 ± 0.04 | |||||
| 05 Oct 11 | 9.92 ± 0.03 | |||||
| 26 Nov 11 | 9.69 ± 0.05 |
1Loiano Observatory. 2Cima Ekar Observatory; all the other data were obtained with the TACOR telescope.
A large number of spectroscopic standards (from K7 to M9 giants and dwarfs) were observed with the same instrumental configuration as our target stars and used as the basis for our classification. We selected the templates of M standards from several catalogs and spectral libraries (Kirkpatrick et al. 1991; Torres-Dodgen & Weaver 1993; Fluks et al. 1994; Allen & Strom 1995; Gray & Corbally 2009). Spectra of M standards were also downloaded from the site http://kellecruz.com/M_standards/. For the carbon stars we used Barnbaum et al. (1996) and Totten & Irwin (1998).
4. DATA ANALYSIS
In the following sections we describe the general characteristics of the spectra and the optical light curves for individual stars, when available.
4.1. General Characteristics for Spectral Classification
Spectral types were derived by overlapping the spectral tracing of the targets with those of the reference stars, overplotting them with IRAF/splot. Classification was made independently by three of us and the typical uncertainty is one subtype. We have checked the self-consistency of the reference stars in the same way. Most of the reference stars are nearby. The spectral resolution used allowed us to discriminate luminosity classes but not the metal content.
The spectra of almost all our targets are typical for M-type stars. In these stars the most prominent absorptions belong to the TiO bands at 4761, 4954, 5167, 5448, 5862, 6159, 6700, 7055 and 7600 Å. In some cases the VO bands of the red system are also present, with several band heads in the range 7334−7472 Å, and 7851−7973 Å, seen only in very late type stars. We paid special attention to features used as typical dwarf/giant discriminators, like the Mg b triplet 5167, 5173, 5184 Å; the NaD doublet 5890, 5896 Å; the CaOH diffuse bands centered at 5550 and 6230 Å, the MgH bands at 4780, 5211 Å; the CaH at 6382, 6908, 6946 Å (Mould 1976; Giovagnoli & Mould 1994). Few atomic lines belonging to Fe and Ti were also present in some spectra.
From their spectral characteristics four targets appear to be N-type AGB carbon stars. Three of them are embedded in a dense envelope with the blue region strongly underexposed.
Two stars, BIS104 and BIS106, were erroneously classified as carbon stars on the basis of the IRAS spectrum (Guglielmo et al. 1997) but our spectra clearly show the typical features of intermediate Mtype stars.
The nine stars in our sample with B−R≤2.5 showed spectra typical for G and early K type stars, as expected. BIS094, 105, 109, 229, 251, 259, and 286 are in fair agreement with the old classification; BIS060 and BIS131 had no previous classification. BIS131, has an infrared excess and has been the subject of a previous publication (Rossi et al. 2010). All these stars will not be discussed further.
None of our stars appear to be of luminosity Class V (main sequence), one is of Class I and two of Class II.
Our spectra are of far to too low a resolution to measure the radial velocities, so we cannot give a kinematic indication of the kind of stellar population (halo, thick disk) to which our stars belong. None of the stars have an appreciable (≥20mas) proper motion in the USNO-B1 catalog.
Figures 1 and 2 show a selection of representative M type spectra, (other spectra of the same class are similar). The atmospheric absorption bands of O2 at 6867 and 7594 Å, and of H2O at 7186 Å, are not removed. In these figures the ordinates are relative intensities corrected for atmospheric extinction, and normalised with the maximum set to 100.

Fig. 1 Selected optical spectra of stars with emission lines. From bottom to top: BIS207 (M5, SemiRegular); BIS007 (Stype, Mira-type); BIS116 (M2-M4, Short-Period Mira-type). The blue part of the spectrum is replotted enlarged above each star, for better visibility.

4.2. Photometric Variability
Most of our targets were present in the NSVS database, collected between 1997 and 2001 from the ROTSE-I (Robotic Optical Transient Search Experiment I) experiment (Wozniak et al. 2004a). The observations, spanning up to one year, gave us reliable indications about the photometric variability of our sample. We downloaded all the available light curves from the NSVS web site to check the photometric behavior and compare the ROTSE magnitudes (Rr) with our new data. Some objects are not present in the NSVS archive, being fainter than the ROTSE-I detection limit (15.5 mag). Few stars have been observed by the Catalina Real-Time Transient Survey (CRTS4). Magnitudes from other catalogs have been only considered as indicative, because they were obtained from the DSS plates where many stars are saturated.
It is worth remembering that the NSVS data were obtained with an unfiltered CCD, so that the quantum efficiency of the sensor makes the effective band most comparable to the Johnson R band (Wozniak et al. 2004a) or, better, a mix of V and R colors, which is a function of the spectral type of the star. To inter-calibrate the NSVS and our magnitudes we used our sample stars with a very stable NSVS light curve. Our photometry is tied to the R magnitude scale of the GSC2.3.2 catalog (Lasker et al. 2008), and a good calibration would require a larger set of non-variable stars in the M0−M8 spectral type range to define a reliable color correction. In fact, we have verified that for M8 stars, which emit most photons in the IR tail of the unfiltered detector, the ROTSE instrumental magnitudes are generally brighter than for M1 stars of similar R magnitude. In any case, even with this caveat, our data were useful to confirm the variability/stability of the stars of our sample.
We assign three main variability indices on the basis of the light curves:
regular, large amplitude variables, larger than 1.1 mag;
irregular, large amplitude variables, between 0.5 and 1.1 mag;
small amplitude variables stars (up to 0.5 mag) or non-variable (up to 0.3 mag).
A few stars showed small amplitude, either irregular or quasi regular variability. To these stars we assigned intermediate variability classes (2/3, 2/1), and they are reported in Table 1 only. Below, we grouped stars with similar characteristics to avoid useless repetitions. For a number of stars we add spectroscopic and/or photometric details.
BIS007: For this star Wozniak et al. (2004b) reported an estimated period of 341 days. The light curve is compatible with that of a Mira- variable star, but the photometric behavior deserves a long term observational program to improve the accuracy of the period. The star is erroneously classified in the BIS catalog as an N-type carbon star. No other spectroscopic information was found in literature. We observed BIS007 in July 2007 and July 2008. The energy distribution was similar in the two epochs, as were the spectral features; in both epochs Hδ and Hγ appeared in emission, other hydrogen lines being hidden by the strong molecular absorptions. We classified this object as an S-type star, similar to HD56567 (S5/6 subtype). In Figure 1 the July 2008 spectrum is presented.
BIS116: During the ROTSE monitoring the star showed a continuous modulation with a period of 160 days, in agreement with Nicholson & Watkins (2006); our photometric data are in agreement with the expected values. Wozniak et al. (2004b) classified this star as a semi-regular variable, but the light curve rather indicates a classification as a shortperiod Mira. We have obtained three spectra, in 2007, 2008 and 2015. The continuum and the intensity of the molecular absorptions are variable. In the three spectra the hydrogen Balmer lines are in emission, though with different intensities. Figure1 shows the July 2008 spectrum.
BIS133 (IY Dra ): This is a Mira-type variable star whose photographic magnitudes at minimum and maximum luminosities were presented in Kazarovets et al. (2000). A lower limit of 351 days for the period was given by Wozniak et al. (2004b). We carefully verified our R magnitudes which are all at the faint limits of the ROTSE magnitudes even taking into account the color correction. The star is strongly saturated in the POSS red plates. The Sloan Digital Sky Survey (SDSS5) reports r = 14.83 mag, corresponding to an R magnitude in the range 13.80−14.30, depending on the adopted transformation equation; but, of course, all transformations are based on main sequence stars. From the spectroscopic point of view IY Dra is a very late type star with a spectrum very similar to the 2008 spectrum of BIS007.
BIS267: The ROTSE light curve shows strong variations with continuous modulation between Rr 10.2 and 13.2 magnitudes. The bibliography based on the POSS plates lists fainter R magnitudes, while our R magnitude ( 9.75 ) corresponds to a brighter object. This implies that the period should be longer than the 255 days reported by the automatic calculation of NSVS. From the spectroscopic point of view BIS267 is an interesting object with the higher lines of the hydrogen Balmer series in emission (extremely strong Hγ and Hδ, no Hα, no Hβ ). The absorption spectrum is remarkable for the strength of the TiO molecular bands
BIS196: The ROTSE light curve, one year long, shows strong variations with continuous modulation between Rr = 11.0 and 12.6 magnitudes, The automatic calculation of NSVS yields a period of 313 days. Stephenson (1986) already classified this object as an M8 type star from objective prism spectroscopy. Our data confirm his classification. There were no emission lines in the optical spectrum at the epoch of our observation, while the shape was very similar to that of BIS007. Sharples et al. (1995), using the data from Stephenson (1986) and IR photometry, include this star in a group of possible Miras with period longer than 350 days. At the epoch of our observations the star was definitely fainter than the ROTSE minimum, even taking into account the IRAS color correction. The photometric behavior of this giant deserves a long term observational program to compute the exact period.
Emission lines of the hydrogen Balmer series characterise the spectra of these stars (see Figures 1 and 2); the NSVS archive classify BIS122, BIS207 and BIS264 as semi-regular variable with a period of 147, 181 and 154 days, respectively, but modulations with shorter periodicity and small magnitude oscillations are also present in the light curves. Our observations show variability inside the ROTSE range. Spectral features are typical for middle to late-type giants.
Variability class (2). Semi Regular
BIS043 (KP Cam); BIS 198; BIS 276 ; BIS001;
BIS006; BIS014; BIS032; BIS037; BIS038;
BIS088; BIS103 ; BIS104; BIS106; BIS120;
BIS123; BIS132; BIS138; BIS 168 ; BIS173; BIS200; BIS211; BIS 213; BIS214; BIS271:
These stars have been classified by Wozniak et al. (2004b) as large amplitude, semi-regular variables. The light curves show a semi-regular pattern with continuous modulation and large amplitude (>0.4mag) variability. For the first three stars quasi-periodicities have also been evaluated. The spectra are typical of M5-M7 giant stars.
BIS043 is also present as a semi-regular variable in 76th list of variable stars (Kazarovets et al. 2001). The visual inspection of its light curve does not provide convincing evidence for the quasi periodicity of about 150 days automatically calculated by NSVS.
BIS138 is the only other star (besides the carbon BIS184 quoted below), to have an IRAS LRS infrared spectrum classified as 24 (star with “not too thick oxigen-rich envelope”).
BIS276 shows two minima at the same magnitude at the beginning and the end of the ROTSE monitoring, with an automatically calculated period of 436 days. Against expectation, in all our six observations we found the source always nearly at the same luminosity, inside the ROTSE range.
Variability class (2). Irregular
BIS003; BIS004; BIS015; BIS039; BIS126;
BIS136; BIS142; BIS145; BIS154; BIS156; BIS167; BIS170; BIS209; BIS212; BIS216;
BIS226:
During the ROTSE monitoring the light curves showed irregular variability with maximum amplitude of 0.5 mag. Our measures are generally slightly fainter than the ROTSE values, in agreement with the expected difference due to the color correction for the spectral type of the stars, and in better agreement with the R values from literature. All these stars have spectral types between M5 and M8.
The light curve of BIS226 shows irregular variability with two minima at Rr about 11.7 while our R magnitude 12.85 is much fainter in agreement with other VIZIER catalogs.
Variability class (2/3)
BIS010; BIS107; BIS113; BIS172; BIS174;
BIS201; BIS224; BIS255; BIS 275; BIS285:
During the ROTSE monitoring these stars showed random variability with maximum excursion of 0.3 magnitudes. The R magnitudes from our observations are also in agreement with the ROTSE range. Most of these stars have an early M spectrum.
We included the M5 star BIS010 in this variability class in spite of the fact that this star was neither monitored by ROTSE because of its faintness nor by the Catalina survey which does not cover its declination zone. The brightness of this star is probably overestimated in every optical catalog being the northern component of an apparent close binary (3 arcsec). The southern component almost disappears in the POSS2 IR plate and we found that its spectrum is early G. From the comparison of the images of DSS1 with DSS2 no magnitude variations of BIS 010 are evident. Our observations in 2013, 2016, 2017 did not reveal spectroscopic or photometric variation. Its extremely red infrared magnitudes (see our companion paper) cannot be justified by the immediate explanation of a long period variable. A very long monitoring should be anyhow recommendable.
Variability class (3).
BIS034; BIS044; BIS067; BIS087; BIS099;
BIS102; BIS110; BIS137; BIS143; BIS155;
BIS197; BIS199; BIS203; BIS210; BIS 215
BIS228; BIS247*; BIS 248; BIS256; BIS258;
BIS260 :
All these stars are very stable during the ROTSE monitoring, showing a maximum variability of 0.1 magnitude. The photometric data available in the literature and our values indicate small fluctuations compatible with ROTSE or Catalina survey data.
No spectroscopic information was found in the literature except for Mickaelian & Gigoyan (2006). Our revised spectral classification turned out to be early M-type for all stars. Figure 2 shows the spectrum of BIS034 which can be better classified as an S type star of subtype S2/3, very similar to the prototypes HD 49368 and HD22649. The very stable BIS247, which shows emission lines in the spectrum indicating a circumstellar envelope is interesting. Its origin would deserve further studies.
BIS194 is stable while the other stars are irregular variables. BIS036 and BIS222 have been identified as R Coronae Borealis candidates by different authors. These stars could not be observed by ROTSE being too faint. We made repeated observations of these stars; the first spectra obtained were presented in Rossi et al. (2016). Here we will only report the spectral evolution of BIS036 and BIS184, shown in Figure 3. BIS194 did not change and BIS222 progressively faded making impossible the acquisition of new spectra with our instruments.
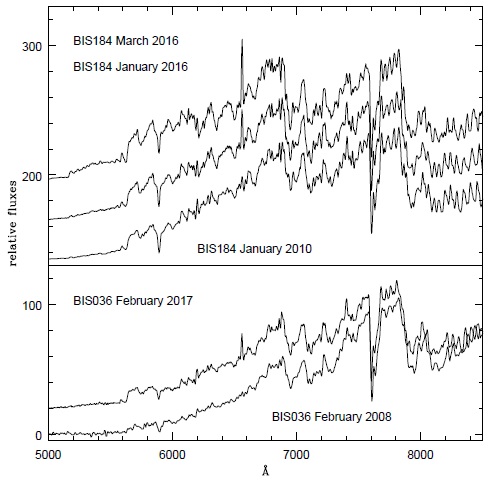
Fig. 3 Spectral evolution of the two carbon stars BIS036 and BIS184 normalised to 100. The spectra on¡¡¡ different dates are vertically shifted for better visibility.
For BIS 036 we get the light curve from the Catalina Survey where the V magnitude ranges from 13.5 to 16.5. Actually we verified that on the POSS1 plate taken on February 5, 1954 the star was quite luminous, brighter than the nearby star having RA(2000) 05:28:56.5 and DEC(2000) +69:20:31, while on the POSS2 plate taken on October 31, 1994 it appears much fainter, likely after an episode of mass ejection. On the FBS plate 0138a taken on November 21, 1969 the star appears as a very short faint segment, consistent with an R ≤ 16. On the basis of the Catalina light curve and of the energy distribution, recently Lee (2015) included this star in a list of R Coronae Borealis candidates, although the strong photometric variations, typical for R CrB stars have never been reported. We have observed this star in 2008, 2016 and 2017 detecting changes in the photometry and spectrum. The spectrum of BIS036 is typical for a very late carbon star: in addition to the CN bands, the (0,1) transition at λ 5636 Å (Swan System) of the C2 molecule is barely visible. A deep NaD absorption is present at λ 5895 Å, possibly produced in the circumstellar envelope. The 2016 and 2017 spectra are almost identical, so we present only the last one to avoid confusion. An important difference between the 2008 and 2016 spectra is the appearance in 2016 of strong Hα in emission: this feature, added to the photometric behavior is compatible with a long period variable star but rules out the R CrB hypothesis.
BIS184: This N type carbon star is a known semi-regular variable star (HP Cam), listed in the General Catalog of Variable Stars (Samus et al. 2017). A photometric variability with a period of 296 days is reported by (Wozniak et al. 2004b). The low resolution spectrum from IRAS is the only spectroscopic reference (Kwok et al. 1997); this object is classified as a carbon star based on the presence of the SiC emission feature at 11.2 µm (LRS classification is 44, according to Little-Marenin et al. 1987). This classification was confirmed by our optical spectra which also showed variations, as expected from its classification. A substantial strengthening of Hα occurred between January and March 2016. In Figure 3 we do not show the February 2017 spectrum, which is practically the same as January 2016.
The variability of BIS222, was ascertained from the comparison of the historical plates of the POSS and the FBS: it was as bright as the two nearby stars in the Red POSS1 plate taken in 1955, when its red magnitude was about 17.3. It is barely visible in the FBS plate No. 1332 (1975); taking into account that 17.5 mag is the limit in the photographic band for the FBS plates, this could be a clue for the magnitude at that epoch. The star is invisible in the POSS2 red plate (1996) and very strong in the POSS2 photographic IR (1997) plate; in January 2010 we measured an R magnitude of 18.5. For all these reasons we assigned to BIS222 the variability class (2). Our spectrum is consistent with that of a dust-enshrouded carbon star of a very late (N8N9) subtype, similar to the well known IRC +10216 (CW Leo), an archetype of post AGB star and preplanetary nebula object. The only spectral features visible in the optical spectrum are the red and near IR bands of the CN molecule at λ 6952, 7088, 7945, and 8150 Å. Hα is present in emission (see Figure 1 of Rossi et al. 2016 ). Note that Tisserand (2012) included this star among the R CrB candidates on the basis of the infrared colors and the energy distribution ( star No. 1542 ), but the presence of Hα could make questionable this classification. Since the star was fainter during our more recent observations, we could obtain photometric data only.
BIS 194: the short monitoring (120 days only) by ROTSE indicates a very small modulation between 9.4 and 9.6 mag. Our R magnitude, 9.3 ± 0.2, is in good agreement with the value indicated by ROTSE. We tentatively assign the variability class (3) taking into account the ROTSE monitoring and our photometry only. No spectroscopic information was found in the literature. Our spectrum is that of an N type carbon star (see Figure 1 of Rossi et al. 2016) with well defined absorption by the C2 molecule (Swan system), with band heads at λλ4737, 5165, 5636, 6122 and 6192 Å. The CN molecule is also present with the bands at λλ5264, 5730, 5746, 5878, 6206, 6360, 6478, 6631, 6952, 7088, 7259, 7876-7945 and 8150 Å. In the three FBS plates containing the star the blue molecular bands are easily visible, but the red part of the spectrum is saturated.
5. PHYSICAL PARAMETERS
Making use of the above mentioned data, we are now in a better position to discuss the results of the optical photometric behavior and the spectral types of the stars. When possible, we derive absolute magnitudes, distances and mass loss rates by applying different methods, according to the different types and characteristics of our objects. These parameters are commonly derived from empirical relations based on stars of well known distances: the mass loss rate determination is the most uncertain one. In fact, the various models generating dust, wind and circumstellar shells are based on similar hydrodynamical equations but on different hypotheses about of gas/dust ratios and a different time dependence.
Several stars in our sample are variable; in these cases calculations to obtain physical parameters should imply time-averaged IR magnitudes. For this purpose we have used the 2MASS and IRAS catalogs. We are aware that results from sparse observations must be considered with care, but, having a limited phase coverage of the measurements, obtained at random phases, we used the data as if they were the mean values of the magnitudes; as uncertainties we adopted the typical amplitudes.
Carbon stars
To estimate the absolute luminosity and distance of the “naked” carbon star BIS194, we used the relation between the color index J −K and the absolute K magnitude MK obtained by Demers & Battinelli (2007), valid for J −K in the range between 1.4 and 2.3 magnitudes.
We obtained MK = −7.88 mag and d =3.8 kpc. Concerning the N-type dusty carbon stars BIS036, BIS184 and BIS222, we applied various empirical relations and models available in literature. The results are in general agreement except for the mass loss rates, for which the model dependence is strong and the differences are significant from one method to another. Our procedures are described below, and the results are summarized in Table 2. The columns have the following meaning: 1: BIS number; 2: absolute K magnitude MK; 3: range of distances d; 4: derived distance to the galactic plane Z; 5: apparent bolometric magnitude mbol; 6: absolute bolometric magnitude Mbol; 7: mass loss from Le Bertre & Winters (1998); 8: mass loss from Whitelock et al. (2006).
Table 2 Physical parameters and distances for the dusty carbon stars
| BIS No. |
M
K
mag |
d kpc |
Z kpc |
m
bol mag |
M
bol mag |
log Ṁ LW-98 |
log Ṁ Wh-06 |
| 036 | -6.9:-7.3 | 10.7:13.0 | 3.4:4.0 | 10.6:11.0 | -4.2:-4.9 | -5.6 | -5.1 |
| 184 | -7.5:-7.8 | 1.5:1.8 | 0.6:0.7 | 6.8:6.9 | -4.1:-4.3 | -6.3 | -5.8 |
| 222 | -7.0:-7.4 | 9.8:12.6 | 3.0:3.8 | 9.9:11.0 | -4.4:-5.5 | -5.3 | -4.9 |
We have derived the range of absolute K magnitudes using the relations between M(Ks) and (J − Ks)o from the calibration by Mauron (2008). From these values we then computed the range of distances to the stars.
A cross check of the estimated absolute K magnitude can be made in the case of BIS184 using the cited period of 296 days.
From the relation by Knapp et al. (2003):
MK = −1.34 logP(d) − 4.5 −→ MK = −7.8 ± 0.4 mag.
From the calibration by Whitelock (2012):
MK = −7.18 − 3.69(logP − 2.38) −→ MK = −7.5 ± 0.3 mag.
Both values are in good agreement with those obtained using the Mauron (2008) calibration reported in Table 3.
Table 3 Physical parameters and distances of the o-rich miras
| BIS No. |
P days |
M
K
mag |
m
bol mag |
M
bol mag |
d kpc |
Z kpc |
log Ṁ |
| 007 | 341 | -7.87 | 7.3 | -4.80 | 2.65 ±.40 | 0.6 : 0.8 | -7.92 ±0.35 |
| 116 | 161 | -6.65 | 9.7 | -3.81 | 5.00 ±.55 | 3.2 : 3.9 | -7.43 ±0.28 |
| 133 | >351 | -7.90 | 9.1 | -4.84 | 5.90 ±.85 | 2.3 : 3.0 | -7.26 ±0.40 |
| 196 | 316 | -7.72 | 7.9 | -4.69 | 3.15 ±.45 | 1.6 : 1.8 | -7.35 ±0.45 |
| 267 | >255 | -7.40 | 9.1 | -4.45 | 5.20 ±.85 | 2.5 : 3.5 | -8.2 ±0.5 |
We have computed the apparent bolometric magnitude:
using the calibrations to the bolometric corrections by Whitelock et al. (2006). We obtained a range of values inside the limits reported in Column 4 of Table 2. The results obtained using the calibrations by Le Bertre et al. (2001) are in good agreement with those listed in the table.
From the derived distances and from mbol we could infer the range of absolute bolometric magnitudes.
For BIS184, Mbol can also be obtained in an independent way, using the period-luminosity relation by Feast et al. (2006) (see their Figure 2 and equation(1) with c =2.06). The result, Mbol = −4.22 ± 0.24 mag. is in perfect agreement with that reported in Table 2.
Finally we estimated a range of mass loss rates being aware that the uncertainties are quite large. The combinations between several IR colors and mass loss rates were studied by Le Bertre & Winters (1998) starting both from stationary and from timedependent models, with fixed assumptions on the parameters of the circumstellar shells; for the stars in common with a paper by Whitelock et al. (1994) they obtained a satisfactory agreement, though with lower values of M˙ . A good correlation between K−[12] color and the total mass loss rate was derived by Whitelock et al. (2006) refining the previous work. Our results confirm the systematic difference of a factor of three between the two methods. In the last two columns of Table 2 we report the results (in M⊙/year), the uncertainties are about ± 0.2 in the logarithm.
O-rich Miras
For the M-type Mira variables a number of relations involving period and IR luminosities (discussed in our companion paper) can be applied. The results are summarised in Table 3 where the meaning of the columns is the following: 1: BIS number; 2: variability period P reported by NSVS; 3: absolute K magnitude MK; 4: apparent bolometric magnitude mbol; 5: absolute bolometric magnitude Mbol; 6: distances and corresponding errors; 7: derived distance to the galactic plane; 8: mass loss.
The results for BIS133 reported in the table are lower limits, the period being longer than 351 days. Similarly we assigned class 1 to BIS267 although this star is not known to be a Mira type but shows a regular pattern in the light curve of ROTSE experiment, as described above. At the opposite end, BIS116 has the shortest period, the smallest amplitude and the earliest spectral type: its position in almost all color-color diagrams is similar to that of the long-period Miras. Whitelock et al. (2000) divided the Miras with period shorter than 225 days in two groups, “short period-blue” and “short periodred” depending on their infrared colors and average spectral types. All the spectroscopic and photometric characteristics of BIS116 lead us to place this star in the group of the “short period-blue” Miras.
We computed the absolute K and bolometric magnitudes using the relation between period and magnitude given in Whitelock (2012) and references therein:
For the uncertainty on the period, after careful inspection of the NSVS light curves, we assumed five days for BIS116 and ten days for the other stars. By propagating the errors we obtained ∆M ≈0.1 mag for BIS116 and BIS267 and ∆M ≈0.07 mag for the other stars. The uncertainties are practically the same for Mbol and MK.
We also computed the apparent bolometric magnitude with BCK = 3.15 mag for BIS007, BIS133, BIS196, BCK = 2.9 mag for BIS267, and BCK = 2.8 mag for BIS116, derived from the calibrations by Whitelock et al. (2000). As uncertainties we assumed the typical amplitude of the K magnitude, that is, 0.4 mag for the late-type Miras and 0.2 mag for BIS116 and BIS267.
We could then infer a crude estimate of the distances and of the mass loss rate. The distances derived from the bolometric and the K magnitudes agree very well, within the errors. To compute the mass loss we used the calibration between M˙ and K−[12] color index obtained by Le Bertre & Winters (1998). Here, the non simultaneous observations of the different sets of IR data also contribute to the uncertainties.
Semi-Regular variables
Our sample includes several semi-regular variables, but only five, namely BIS122, BIS198, BIS207, BIS209 and BIS276 have well sampled light curves in the NSVS. We could derive a range of absolute magnitudes and distances by applying the relations found by Knapp et al. (2003) and by Barthes et al. (1999). These last authors found different relations P − MK for different kinematics characteristics and obtained significant results by dividing their data into four groups, representative of four different populations. Groups 1 and 2 have kinematic characteristics corresponding to old disk stars; Group 3 has kinematics indicating a younger population, Group 4 contains only high velocity stars. Only Group 1 contains long periods.
We report the results in Table 4 where the columns have the following meaning: 1: BIS number; 2: variability period P; 3: K magnitude from 2MASS; 4: absolute K magnitude MK from Knapp et al. (2003); 5: range of MK from Barthes et al. (1999), obtained by applying the relation giving the best agreement with Knapp et al. (2003); 6: corresponding group number following Barthes et al. (1999); 7: range of distances from the minimum and maximum of Columns 4 and 5; 8: derived distance to the galactic plane.
Table 4 M(K) and distances for 5 semi-regular variable stars
| BIS | P days |
Ks mag |
MK K03 |
MK B99 |
Gr B99 |
Dist K kpc | Z kpc |
| 122 | 147 | 6.63 | -7.40 | -7.35:-7.44 | 2/3 | 6.3 : 6.5 | 3.5 : 3.6 |
| 198 | 161 | 5.71 | -7.45 | -7.42:-7.53 | 2/3 | 4.2 : 4.4 | 2.5 : 2.6 |
| 207 | 181 | 6.42 | -7.52 | -7.52:-7.65 | 2/3 | 6.1 : 6.5 | 3.9 : 4.1 |
| 209 | 296 | 5.00 | -7.80 | -7.95:-8.12 | 2/3 | 3.6 : 4.2 | 2.3: 2.6 |
| 276 | 436 | 6.16 | -8.00 | -7.94:-8.18 | 1 | 6.5 : 7.4 | 3.4 : 3.9 |
Non variable stars
All the non-variable, or small amplitude variable, stars are giants of M0-M4 sub-classes. For these stars we derived a range of distances between 1.0 and 3.3 kpc, by adopting absolute visual magnitudes −0.7 ≤ MV ≤−1.6 (Johnson et al. 1986; The et al. 1990; Sparke & Gallager 2000) and averaging the apparent visual magnitudes retrieved from the catalogs UCAC4 (Zacharias et al. 2012) and GSC2.3. Considering the galactic latitude distances to the galactic plane ranging from thick disk to halo, ( 0.45−2.1 kpc,
6. CONCLUDING REMARKS
In this work we have studied spectroscopic and photometric optical characteristics of a sample (95) of late type stars from the BIS catalog. The entire catalog (276 stars) included 30% unclassified objects and 55% with very uncertain classification.
Using our new spectroscopic data we revised the spectral classification of the observed targets: in 45% of the cases we strongly modified or improved the previous classification. Four objects turned out to be carbon N-type stars, nine had types earlier than M, the others were M-type giants.
We divided our stars into three main variability classes: regular variable, irregular variable, photometrically stable. About 60% of the stars show large amplitude, irregular or semi-regular light curves; in this category we have included the three dust enshrouded carbon stars. All the early M-type stars and the naked carbon star BIS194 were found to be stable. Only 5 stars are Mira variables. Our study singled out some peculiar stars which deserve more detailed studies.
Our spectral classification, together with data collected from literature, allowed us to estimate absolute magnitudes, mass loss rates, and distances for a number of targets; we found a good agreement between results obtained from different methods.
Knowing the distances to the Sun and the galactic latitude, we can infer that the median distance of the variable stars from the galactic plane is 3.0 kpc, (σ=1.5), none being farther than 5.4 kpc. Our spectral resolution does not allow us to investigate the chemical differences between thick disk and halo stars. Anyhow, given the distance from the galactic plane, most of these stars are likely to be halo members.
For the non-variable stars we derived an average distance of 1.03 kpc from the galactic plane, suggestive of a mixed population of thick-disk and halo.
Regarding the evolutionary status of our sample, most of the stars have an absolute magnitude appropriate to the AGB phase.
In a companion study (Gaudenzi et al., submitted) we analysed the infrared properties of all the stars of the BIS catalog. For this purpose we made use of near-IR (2MASS), mid-IR (WISE), and farIR (IRAS and AKARI) photometric data to investigate their behaviour on various color-magnitude and color-color diagrams and to graphically distinguish various types of sources.
This research has made use of the SIMBAD database, operated at CDS, Strasbourg, France. This publication has made use of data products from: the Two Micron All-Sky Survey database, which is a joint project of the University of Massachusetts and the Infrared Processing and Analysis Center/California Institute of Technology; the Wide-Field Infrared Survey Explorer, which is a joint project of the University of California, Los Angeles, and the Jet Propulsion Laboratory/California Institute of Technology, funded by the National Aeronautics and Space Administration; the Northern Sky Variability Survey (NSVS) created jointly by the Los Alamos National Laboratory and University of Michigan; the NASA/IPAC Extragalactic Database (NED) which is operated by the Jet Propulsion Laboratory (JPL), California Institute of Technology, under contract with the National Aeronautics and Space Administration; the International Variable Star Index (VSX) database, operated at AAVSO, Cambridge, Massachusetts, USA. The University “La Sapienza” of Rome, Italy, supported the project with funds from MIUR.

