


 nova página do texto(beta)
 Inglês (pdf)
 Artigo em XML
 Referências do artigo
 Enviar este artigo por email
 Citado por SciELO
  Similares em
SciELO
Similares em
SciELO 
 Permalink
1. MOTIVATION
The open cluster NGC 6633 is unique due to its proximity. Lotkin (2000), based on the studies of Mermilliod et al. (1997) and Robichon et al. (1997), mentioned a possible inadequacy in the method used to estimate the distance modulii, fitting photometric diagrams as a probable source of discrepancies between the distance estimates obtained from Hipparcos trigonometric and photometric parallaxes. This inference calls into question the numerous distance determinations that have been made for open clusters and other galactic objects. These authors remark that: “new, independent estimates of the distance modulii for the open clusters are therefore required”.
Since uvby−β photoelectric photometry provides a different and proven approach to determine correct distances to the stars (see, for example Peña & Sareyan, 2006), the present study might contribute to shed fresh light on this matter.
The main source of data on open clusters is Paunzen et al. (2016, WEBDA). They report several previous studies on the cluster NGC 6633. Amongst the main ones are the following: Vasilevskis et al. (1958), in a proper motion study, determined 90 stars to be members and remarked that the cluster has few stars between the magnitude limits of 10.5 to 12.5 which is unusual for open clusters. Much of our knowledge comes from broad band photometry such as the work of Hiltner, Iriarte & Johnson (1958); Stetson (2000); Jeffries (1997). Others based their findings on spectroscopy, for example Santos et al. (2009); Jeffries (1997); Laws & Gonzalez (2003) or on peculiar A stars, Renson (1988) or uvby − β photometry, like the works of Schmidt (1976) and Malysheva (1997). In particular the study by Schmidt (1976), analogous to the present one, corroborates the quality of the data of both works and extends the sampling of the stars. In the compilation of data of open clusters Paunzen et al. (2016) report that NGC 6633 has a distance [pc] of 376; reddening [mag] of 0.182; a distance modulus [mag] of 8.44; log age of 8.629 and no reported data on metallicity. These data are shown in the last row of the Table 1 which presents a brief summary of what is known from previous studies.
Table 1 Compilation of the determined data of ngc 6633
| Author | E(B-V) | E(b − y) | DM | D | [Fe/H] | Age | N | Technique |
| pc | yr/log (age) | |||||||
| Hiltner et al., 1953 | 0.17 | 7.5 | 320 | UBV | ||||
| Vasilevskies, 1958 | 90 | proper motion | ||||||
| Sanders, 1973 | 113 | proper motion | ||||||
| Schmidt, 1976 | 0.124 | 7.71 | uvby − β | |||||
| Cameron, 1985 | 0.17 | 7.63 | −.133 | uv excess | ||||
| Malysheva, 1997 | 0.145 | 338 | /8.556 | uvby − β | ||||
| Piatti et al., 1998 | 0.17 | 8.10 | −0.02 | /8.79 | CCD VI | |||
| Jeffries et al., 2002 | −.096 | spectroscopy | ||||||
| Santos et al., 2012 | .04 | spectroscopy | ||||||
| Paunzen et al., 2016 | 0.182 | 376 | .04 | /8.629 | compiled | |||
| PP | 0.150 ± 0.04 | 7.2 ± 0.3 | 293 ± 92 | /8.16 | uvby − β |
2. OBSERVATIONS
These were all done at the Observatorio Astronómico Nacional, México. The 0.84 m telescope, to which a spectrophotometer was attached, was utilized at all times. The observing season was carried out over several nights in June (nine nights by ARL) and July (eight nights by CVR), 2016. The open cluster NGC 6633 was observed on three nights, two in June and one in July, measuring 33 stars. The ID charts utilized were those of WEBDA, selected for a limiting magnitude around 11 mag, which is the reasonably reachable limit given by the telescopespectrophotometer system.
2.1. Data Acquisition
During all the nights of observation the following procedure was utilized: each measurement consisted of at least five ten-second integrations of each star and one ten-second integration of the sky for the uvby filters and the narrow and wide filters defining Hβ. Individual uncertainties were determined through a calculation of the standard deviations of the fluxes in each filter for each star. The percent error of each measurement is a function of both the spectral type and the brightness of each star, but the stars were observed long enough to secure sufficient counts in order to get a S/N ratio of accuracy of
2.2. Data Reduction
The reduction procedure was carried out using the numerical packages NABAPHOT (Arellano-Ferro & Parrao, 1988). A series of standard stars was also observed nightly in order to transform the data into the standard system. The chosen standard system was that defined by the standard values of Olsen (1983), although for some standard bright stars the standard system from the Astronomical Almanac (2006) was used. The transformation equations are those defined by Crawford & Barnes (1970) and by Crawford & Mander (1966).
The coefficients defined by the following equations which fit the data to the standard system are:
In these equations the coefficients D, F, H and L are the slope coefficients for (b−y), m 1, c 1 and β, respectively. The coefficients B, J and I are the color terms of V, m 1, and c 1. The averaged transformation coefficients for each night are listed in Table 2 along with their standard deviations. Season errors were evaluated with the nineteen standard stars observed for a total of 316 observed points. These uncertainties were calculated through the differences in magnitude and colors for all nights, for (V , b −y, m 1, c 1 and β) as (0.036, 0.012, 0.015, 0.020, 0.027) respectively, which provide a numerical evaluation of our uncertainties for the season. Emphasis is made on the large range of magnitudes and colors of the standard stars: V :(5.2, 8.8); (b − y):(0.00, 0.80); m 1:(0.09, 0.68); c 1:(0.08, 1.05) and β:(2.50, 2.90).
Table 2 Transformation coefficients obtained for the observing season
| season | B | D | F | J | H | I | L |
| 2016 | 0.006 | 0.965 | 1.049 | 0.033 | 1.016 | 0.103 | −1.356 |
| σ | 0.033 | 0.015 | 0.051 | 0.016 | 0.034 | 0.052 | 0.044 |
A further test with the standard stars during both seasons was made. Mean values and the corresponding standard deviations of the nineteen measurements were calculated and the numerical results obtained are presented in Table 3. In Column 1 we present the ID; Columns 2 to 6 present the mean photometric values V , (b−y), m 1, c 1 and β for each star. The corresponding standard deviations are in the subsequent columns. The mean values of the individual standard deviations are found in the last two rows at the bottom of Table 3. These values are a few hundredths or thousandths of magnitude for each color index, providing a measure of the accuracy of our photometry.
Table 3 Standard stars mean photometric values and seasonal standard deviations
| ID | V | (b − y) | m 1 | c1 | β | σV | σ (b − y) | σ m 1 | σ c 1 | σ β |
| BS8086 | 6.000 | 0.793 | 0.669 | 0.044 | 2.504 | 0.015 | 0.008 | 0.008 | 0.028 | 0.016 |
| HD190296 | 8.043 | 0.062 | 0.144 | 1.081 | 2.882 | 0.016 | 0.017 | 0.005 | 0.010 | 0.015 |
| HD186025 | 8.828 | 0.369 | 0.117 | 0.495 | 2.673 | 0.018 | 0.059 | 0.033 | 0.068 | 0.023 |
| BS7504 | 6.224 | 0.404 | 0.215 | 0.328 | 2.597 | 0.019 | 0.007 | 0.004 | 0.011 | 0.014 |
| HD207608 | 8.043 | 0.308 | 0.147 | 0.487 | 2.643 | 0.022 | 0.008 | 0.005 | 0.010 | 0.018 |
| HD190849 | 7.116 | 0.067 | 0.160 | 0.933 | 2.872 | 0.023 | 0.009 | 0.008 | 0.013 | 0.014 |
| HD183085 | 6.712 | 0.243 | 0.127 | 0.858 | 2.719 | 0.023 | 0.011 | 0.006 | 0.037 | 0.026 |
| HD182941 | 8.086 | 0.278 | 0.128 | 0.974 | 2.799 | 0.025 | 0.009 | 0.005 | 0.010 | 0.015 |
| BS8085 | 5.179 | 0.655 | 0.675 | 0.099 | 2.516 | 0.026 | 0.010 | 0.006 | 0.012 | 0.014 |
| BS7858 | 5.386 | 0.019 | 0.211 | 0.939 | 2.900 | 0.028 | 0.010 | 0.006 | 0.012 | 0.014 |
| HD176014 | 8.685 | 0.343 | 0.113 | 0.509 | 2.658 | 0.028 | 0.007 | 0.009 | 0.012 | 0.022 |
| BS6332 | 5.266 | 0.002 | 0.176 | 1.059 | 2.890 | 0.028 | 0.011 | 0.004 | 0.009 | 0.012 |
| HD162503 | 8.297 | 0.458 | 0.191 | 0.385 | 2.637 | 0.030 | 0.013 | 0.007 | 0.011 | 0.015 |
| HD188755 | 8.282 | 0.102 | 0.201 | 0.966 | 2.849 | 0.032 | 0.010 | 0.006 | 0.035 | 0.016 |
| HD201193 | 7.889 | 0.335 | 0.144 | 0.384 | 2.632 | 0.032 | 0.011 | 0.008 | 0.010 | 0.019 |
| BS7253 | 5.519 | 0.170 | 0.192 | 0.708 | 2.750 | 0.034 | 0.010 | 0.004 | 0.009 | 0.013 |
| BS7503 | 5.974 | 0.398 | 0.207 | 0.346 | 2.637 | 0.035 | 0.010 | 0.004 | 0.009 | 0.013 |
| HD156392 | 8.411 | 0.336 | 0.164 | 0.592 | 2.730 | 0.041 | 0.014 | 0.020 | 0.060 | 0.015 |
| HD156026 | 6.429 | 0.707 | 0.720 | 0.246 | 2.565 | 0.068 | 0.021 | 0.009 | 0.017 | 0.015 |
| Mean | 0.029 | 0.013 | 0.008 | 0.020 | 0.017 | |||||
| Standard Dev. | 0.012 | 0.011 | 0.007 | 0.018 | 0.004 |
Table 4 lists the photometric values of the observed stars for the cluster. In this table, Column 1 reports the ID of the stars as listed by WEBDA, Columns 2 to 5 the Stro¨mgren values V , (b−y), m 1 and c 1, respectively; Column 6, the β. Since there were three measurements for each star, mean values were calculated and are reported.
Table 4 Newly acquired uvby − β photoelectric data for the open cluster NGC 6633
| Webda | V | (b − y) | m 1 | c1 | Hβ | σV | σ(b − y) | σm 1 | σc 1 | σβ | N |
| 40 | 9.811 | 0.177 | 0.142 | 1.014 | 2.899 | 0.018 | 0.011 | 0.011 | 0.009 | 0.042 | 3 |
| 44 | 10.741 | 0.254 | 0.208 | 0.745 | 2.817 | 0.004 | 0.003 | 0.012 | 0.005 | 0.037 | 3 |
| 46 | 10.451 | 0.234 | 0.162 | 0.853 | 2.831 | 0.018 | 0.017 | 0.011 | 0.022 | 0.031 | 3 |
| 47 | 10.948 | 0.292 | 0.248 | 0.593 | 2.806 | 0.008 | 0.009 | 0.004 | 0.035 | 0.049 | 2 |
| 48 | 10.443 | 0.169 | 0.091 | 1.039 | 2.889 | 0.007 | 0.008 | 0.017 | 0.023 | 0.037 | 3 |
| 49 | 10.540 | 0.227 | 0.155 | 0.865 | 2.847 | 0.006 | 0.014 | 0.014 | 0.010 | 0.020 | 3 |
| 50 | 8.326 | 0.669 | 0.346 | 0.311 | 2.598 | 0.013 | 0.001 | 0.005 | 0.010 | 0.025 | 3 |
| 52 | 8.989 | 0.172 | 0.161 | 0.990 | 2.886 | 0.030 | 0.015 | 0.010 | 0.014 | 0.018 | 3 |
| 54 | 10.081 | 0.200 | 0.150 | 0.927 | 2.857 | 0.018 | 0.009 | 0.010 | 0.014 | 0.018 | 3 |
| 55 | 10.391 | 0.273 | 0.112 | 0.881 | 2.797 | 0.001 | 0.005 | 0.013 | 0.013 | 0.023 | 2 |
| 57 | 8.787 | 0.165 | 0.115 | 1.111 | 2.881 | 0.006 | 0.003 | 0.010 | 0.009 | 0.015 | 3 |
| 61 | 8.273 | 0.166 | 0.145 | 1.093 | 2.876 | 0.011 | 0.003 | 0.005 | 0.006 | 0.025 | 3 |
| 62 | 9.996 | 0.196 | 0.159 | 0.969 | 2.900 | 0.024 | 0.007 | 0.006 | 0.004 | 0.016 | 3 |
| 63 | 11.081 | 0.305 | 0.128 | 0.676 | 2.772 | 0.018 | 0.004 | 0.013 | 0.025 | 0.075 | 3 |
| 65 | 9.958 | 0.420 | 0.193 | 0.273 | 2.616 | 0.001 | 0.005 | 0.003 | 0.017 | 0.012 | 2 |
| 68 | 10.025 | 0.304 | 0.173 | 0.784 | 2.835 | 0.015 | 0.010 | 0.008 | 0.007 | 0.017 | 3 |
| 70 | 8.226 | 0.518 | 0.202 | 0.575 | 2.679 | 0.016 | 0.006 | 0.002 | 0.004 | 0.024 | 3 |
| 73 | 10.586 | 0.792 | 0.495 | 0.297 | 2.605 | 0.009 | 0.026 | 0.013 | 0.006 | 0.018 | 2 |
| 77 | 8.199 | 0.083 | 0.046 | 0.455 | 2.728 | 0.017 | 0.006 | 0.002 | 0.004 | 0.019 | 3 |
| 79 | 10.149 | 0.250 | 0.131 | 0.851 | 2.839 | 0.014 | 0.009 | 0.007 | 0.003 | 0.043 | 3 |
| 84 | 9.524 | 0.189 | 0.121 | 1.040 | 2.887 | 0.002 | 0.009 | 0.001 | 0.007 | 0.016 | 3 |
| 87 | 9.294 | 0.159 | 0.150 | 1.050 | 2.892 | 0.005 | 0.010 | 0.005 | 0.014 | 0.014 | 3 |
| 88 | 9.661 | 0.219 | 0.152 | 0.930 | 2.855 | 0.042 | 0.007 | 0.010 | 0.009 | 0.021 | 2 |
| 90 | 8.555 | 0.246 | 0.113 | 1.004 | 2.811 | 0.047 | 0.008 | 0.009 | 0.007 | 0.007 | 3 |
| 91 | 9.578 | 0.214 | 0.157 | 0.778 | 2.792 | 0.028 | 0.001 | 0.008 | 0.011 | 0.023 | 2 |
| 92 | 8.464 | 0.178 | 0.138 | 1.118 | 2.865 | 0.019 | 0.013 | 0.006 | 0.019 | 0.032 | 3 |
| 97 | 9.104 | 0.205 | 0.120 | 1.005 | 2.864 | 0.028 | 0.014 | 0.007 | 0.022 | 0.020 | 3 |
| 100 | 8.357 | 0.700 | 0.390 | 0.272 | 2.597 | 0.023 | 0.011 | 0.001 | 0.003 | 0.001 | 2 |
| 101 | 10.862 | 0.236 | 0.145 | 0.855 | 2.869 | 0.102 | 0.061 | 0.026 | 0.152 | 0.070 | 3 |
| 102 | 5.728 | 0.020 | 0.084 | 0.602 | 2.743 | 0.009 | 0.005 | 0.001 | 0.003 | 0.015 | 3 |
| 103 | 10.970 | 0.374 | 0.122 | 0.305 | 2.712 | 0.015 | 0.036 | 0.007 | 0.022 | 0.094 | 3 |
| 104 | 10.515 | 0.310 | 0.055 | 0.925 | 2.806 | 0.052 | 0.036 | 0.118 | 0.070 | 0.034 | 3 |
| 201 | 11.078 | 0.551 | 0.188 | 0.373 | 2.597 | 0.023 | 0.019 | 0.032 | 0.015 | 0.058 | 2 |
3. COMPARISON WITH OTHER PHOTOMETRIES
Despite the care with which the observations were done, and altough the values we present here are the results of three nights of observations with reasonable standard deviations, it is better to compare our results with previous existing photometry of the same stars.
To begin with, a comparison of our values with the available UBV photometry reported in WEBDA was made. The intersection of both sets was found to consist of 32 stars. A linear fit between both sets yielded the equation V WEBDA = −0.01118+ 0.9990 V Ppp with a correlation coefficient of 0.9996 and a standard deviation of 0.0342. The color relationship yielded (B − V ) = −0.0566+ 1.6879(b − y) with a correlation coefficient of 0.9973 and a standard deviation of 0.0218.
Furthermore, since there are other sources of uvby − β photometry obtained previously for this cluster (Table 5 presents the summary of WEBDA), a comparison with our values was made. The intersection of both sets was found to consist of 34 stars. A linear fit between both sets yielded the equation Y WEBDA = A+BX pp with the correlation coefficient and the standard deviation as criteria of goodness. The obtained coefficients are presented in Table 6. In view of the evident non-linearity of the m 1 color index a search was done to discover the reason for this discrepancy, revealing that Reference 10 (Johansen, Gyldenkerne, 1970) was the source of the discrepancy. In view of this, their m 1 values were not considered in the rest of the analysis. The linear fit was repeated without these m 1 values. The coefficients of this fit are presented in the last row of Table 6.
Table 5 References in webda with uvby − β photoelectric photometry
| Reference | number of reported stars | source |
| 10 | 13 | Johansen, Gyldenkerne (1970) |
| 84 | 1 | Crawford, Barnes, Golson (1973) |
| 137 | 1 | Gronbech, Olsen (1976) |
| 142 | 37 | Schmidt (1976) |
| 197 | 3 | Olsen (1977) |
| 290 | 2 | Perry, Johnston (1982) |
| 345 | 5 | Olsen (1983) |
| 484 | 1 | Sowell, Wilson (1993) |
| 513 | 2 | Olsen (1994) |
| 569 | 1 | Masana, Jordi, Maitzen, Torra (1998) |
| 33 | Present Paper (2017) |
Table 6 Linear regression of the uvby − β .*
| Index | A | B | R | Std Dev | N |
| V | −0.0408 | 1.0044 | 0.9998 | 0.0264 | 26 |
| (b − y) | −0.0061 | 1.0238 | 0.9989 | 0.0089 | 33 |
| m 1 | 0.0303 | 0.8304 | 0.9062 | 0.0293 | 33 |
| c 1 | 0.0758 | 0.9610 | 0.9878 | 0.0404 | 33 |
| β | −0.1291 | 1.0401 | 0.9840 | 0.0174 | 19 |
| m 1 w/o 10 | 0.0162 | 0.8328 | 0.9864 | 0.0116 | 26 |
*Color indexes of present paper data vs those in the literature.
Both data sets were added. The whole sample consists of 55 stars. The stars common to both sets were averaged. The compiled set is presented in Table 7. Column 1 contains the ID of the stars in increasing order; the remaining columns list the uvby − β photoelectric photometry in the following fashion: V , (b − y), m 1 and c 1, and β, respectively; The next columns list the unreddened values [m 1], [c 1] and [u − b]. The last two columns present the spectral types derived from the location of the stars in the [m 1]−[c 1] diagram of α Per (Peña & Sareyan, 2006) and those reported in the literature, respectively.
Table 7 Compiled uvby − β photoelectric data for the open cluster NGC 6633
| WEBDA | V | (b−y) | m 1 | c1 | Hβ | [m 1] | [c 1] | [u−b] | SPECT TYPE | |
| PHT | SPECTROSC | |||||||||
| 15 | 8.650 | 0.283 | 0.160 | 0.611 | 2.721 | 0.251 | 0.554 | 1.056 | F0V | |
| 26 | 8.024 | 0.293 | 0.144 | 0.558 | 0.238 | 0.499 | 0.975 | F1V | ||
| 39 | 9.145 | 0.151 | 0.141 | 1.129 | 2.906 | 0.189 | 1.099 | 1.477 | A2V | A1Vp |
| 40 | 9.811 | 0.177 | 0.142 | 1.014 | 2.899 | 0.199 | 0.979 | 1.376 | A2V | |
| 44 | 10.746 | 0.259 | 0.195 | 0.774 | 2.801 | 0.278 | 0.722 | 1.278 | Ap | |
| 46 | 10.471 | 0.232 | 0.153 | 0.873 | 2.822 | 0.227 | 0.827 | 1.281 | A8V | |
| 47 | 10.948 | 0.292 | 0.248 | 0.593 | 2.806 | 0.341 | 0.535 | 1.217 | G0V | |
| 48 | 10.452 | 0.165 | 0.090 | 1.087 | 2.864 | 0.143 | 1.054 | 1.340 | A1V | |
| 49 | 10.555 | 0.225 | 0.145 | 0.920 | 2.832 | 0.217 | 0.875 | 1.309 | A4V | |
| 50 | 8.333 | 0.669 | 0.330 | 0.352 | 2.576 | 0.544 | 0.218 | 1.306 | LATE V | G8IIIAB |
| 52 | 9.005 | 0.166 | 0.157 | 1.014 | 2.870 | 0.210 | 0.981 | 1.401 | A3V | A3V |
| 54 | 10.081 | 0.201 | 0.149 | 0.936 | 2.850 | 0.213 | 0.896 | 1.322 | A5V | |
| 57 | 8.784 | 0.162 | 0.135 | 1.122 | 2.877 | 0.187 | 1.090 | 1.463 | A2V | A2V |
| 58 | 7.580 | 0.100 | 0.086 | 0.776 | 2.800 | 0.118 | 0.756 | 0.992 | B8V | A0III |
| 61 | 8.272 | 0.167 | 0.139 | 1.116 | 2.866 | 0.192 | 1.083 | 1.467 | A2V | A2.5V |
| 62 | 9.996 | 0.196 | 0.159 | 0.969 | 2.900 | 0.222 | 0.930 | 1.373 | A5V | |
| 63 | 11.081 | 0.305 | 0.128 | 0.676 | 2.772 | 0.226 | 0.615 | 1.066 | A9V | |
| 65 | 9.958 | 0.420 | 0.193 | 0.273 | 2.616 | 0.327 | 0.189 | 0.844 | G0V | |
| 67 | 9.520 | 0.171 | 0.171 | 1.010 | 2.644 | 0.226 | 0.976 | 1.427 | A5V | Am |
| 68 | 10.025 | 0.304 | 0.173 | 0.784 | 2.835 | 0.270 | .723 | 1.264 | Ap | |
| 70 | 8.229 | 0.527 | 0.181 | 0.622 | 2.679 | 0.350 | 0.517 | 1.216 | G0V | G0III+A3 |
| 72 | 9.492 | 0.208 | 0.106 | 1.102 | 0.173 | 1.060 | 1.406 | A0V | A4V | |
| 73 | 10.586 | 0.792 | 0.495 | 0.297 | 2.605 | 0.748 | 0.139 | 1.635 | LATE V | |
| 75 | 9.700 | 0.202 | 0.130 | 0.999 | 2.852 | 0.195 | 0.959 | 1.348 | A2V | Am |
| 77 | 8.191 | 0.075 | 0.055 | 0.472 | 2.730 | 0.079 | 0.457 | 0.615 | B5V | B6IV |
| 79 | 10.149 | 0.250 | 0.131 | 0.851 | 2.839 | 0.211 | 0.801 | 1.223 | A4V | |
| 83 | 0.196 | 1.092 | 1.053 | A2.5V | ||||||
| 84 | 9.524 | 0.188 | 0.121 | 1.036 | 2.887 | 0.181 | 0.998 | 1.361 | A2V | A2.5V+SHL |
| 88 | 9.646 | 0.225 | 0.141 | 0.948 | 2.861 | 0.213 | 0.903 | 1.329 | A4V | Am |
| 90 | 8.548 | 0.245 | 0.107 | 1.054 | 2.802 | 0.185 | 1.005 | 1.376 | A2V | A4V |
| 91 | 9.529 | 0.211 | 0.163 | 0.812 | 2.788 | 0.231 | 0.770 | 1.231 | A8V | |
| 92 | 8.462 | 0.184 | 0.130 | 1.142 | 2.862 | 0.189 | 1.105 | 1.483 | A2V | A5V |
| 96 | 9.830 | 0.172 | 0.168 | 1.049 | 2.883 | 0.223 | 1.015 | 1.461 | A5V | |
| 97 | 9.102 | 0.204 | 0.127 | 1.027 | 2.858 | 0.192 | 0.986 | 1.371 | A3V | A2V |
| 99 | 10.130 | 0.312 | 0.157 | 0.809 | 2.822 | 0.257 | 0.747 | 1.260 | Ap | |
| 100 | 8.354 | 0.701 | 0.367 | 0.347 | 2.584 | 0.591 | 0.207 | 1.389 | LATE V | G8IIIAB |
| 101 | 10.862 | 0.236 | 0.145 | 0.855 | 2.869 | 0.221 | 0.808 | 1.249 | A6V | |
| 102 | 5.716 | 0.017 | 0.083 | 0.634 | 2.744 | 0.088 | 0.631 | 0.807 | B8V | B8III-IV |
| 103 | 10.970 | 0.374 | 0.122 | 0.305 | 2.712 | 0.242 | 0.230 | 0.714 | F7V | |
| 104 | 10.515 | 0.310 | 0.055 | 0.925 | 2.806 | 0.154 | 0.863 | 1.171 | A1V | |
| 106 | 8.700 | 0.694 | 0.316 | 0.437 | 2.561 | 0.538 | 0.298 | 1.374 | LATE V | G8IIB |
| 110 | 10.170 | 0.239 | 0.145 | 0.930 | 2.805 | 0.221 | 0.882 | 1.325 | A6V | |
| 119 | 8.990 | 0.663 | 0.261 | 0.451 | 2.558 | 0.473 | 0.318 | 1.265 | LATE V | G8III |
| 123 | 7.650 | 0.322 | 0.151 | 0.417 | 2.627 | 0.254 | 0.353 | 0.861 | F7V | |
| 125 | 8.610 | 0.227 | 0.130 | 1.180 | 2.851 | 0.203 | 1.135 | 1.540 | A3V | A6IV |
| 126 | 8.810 | 0.664 | 0.294 | 0.434 | 2.574 | 0.506 | 0.301 | 1.314 | LATE V | G7IIIAB |
| 134 | 8.730 | 0.202 | 0.102 | 1.192 | 2.856 | 0.167 | 1.152 | 1.485 | A2V | A3V |
| 142 | 10.940 | 0.320 | 0.110 | 0.867 | 2.749 | 0.212 | 0.803 | 1.228 | F4V | |
| 147 | 9.460 | 0.382 | 0.149 | 0.361 | 2.593 | 0.271 | 0.285 | 0.827 | F9V | |
| 151 | 9.080 | 0.103 | 0.058 | 0.666 | 2.746 | 0.091 | 0.645 | 0.827 | B8V | |
| 157 | 7.784 | 0.364 | 0.191 | 0.394 | 0.307 | 0.321 | 0.936 | G0V | ||
| 161 | 8.140 | 0.098 | 0.166 | 0.980 | 2.855 | 0.197 | 0.960 | 1.355 | A2V | Am |
| 178 | 9.500 | 0.213 | 0.120 | 1.059 | 2.824 | 0.188 | 1.016 | 1.393 | A2V | A2V+SHL |
| 179 | 9.000 | 0.176 | 0.115 | 1.193 | 2.875 | 0.171 | 1.158 | 1.500 | A2V | A2.5V |
| 201 | 11.078 | 0.551 | 0.188 | 0.373 | 2.597 | 0.364 | 0.263 | 0.991 | G0V | |
4. METHODOLOGY
In order to determine the physical characteristics of the stars in NGC 6633 the following procedure was carried out.
To evaluate the reddening we first established to which spectral class the stars belonged: early (B and early A) or late (late A and F stars) types; the later class stars (G or later) were not considered in the analysis since there is no reddening calibration for MS stars. We determined each star’s spectral type through its location in the [m 1] − [c 1] diagram.
In our previous research we utilized the [m 1]−[c 1] diagram of Golay (1974) to determine the spectral classification of each star. The results proved to be correct. However, utilizing the uvby − β photoelectric photometry of the open cluster α Per (Peña & Sareyan, 2006), which has stars with well-determined spectral types, we classified the stars of NGC 6633 with a new calibration. The results are presented in Figure 1 for NGC 6633. In Table 7 the photometrically determined spectral class is indicated. The determined spectral types compiled by WEBDA are also presented. As can be seen, the photoelectrically classified stars are in very good agreement with those obtained by spectroscopy.
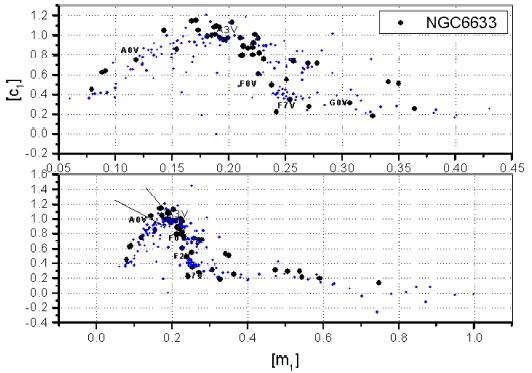
Fig. 1 Position of the stars in the [m1] − [c1] diagram for Alpha Per (Peña & Sareyan, 2006, small dots) and NGC 6633 (large dots).
The reddening was determined after the spectral classification through Strömgren photometry was done. The application of the calibrations for each spectral type of Balona & Shobbrook (1984) and Shobbrook (1984) for O and early A type, and of Nissen (1988) for late A and F stars, respectively, allowed us to determine their reddening and hence, their unreddened color indexes. No determination of reddening was calculated for G and later spectral types. The procedure has been extensively described in Peña & Martínez (2014).
5. RESULTS
The application of the above mentioned numerical packages gave the results listed in Table 8, in which the ID, reddening, unreddened indexes, absolute magnitude, DM and distance (in parsecs) are listed. The last two columns present the membership probabilities described below. Star 67 was not further considered because of its exceedingly large distance.
Table 8 Reddening, unrreddened parameters and membership of the stars in the direction of ngc 6633
| WEBDA | E(b−y) | (b − y)0 | m0 | c0 | Hβ | V0 | MV | DM | Distance | [Fe/H] | Membership | Probab |
| pc | PP | Webda | ||||||||||
| 123 | 0 | 0.323 | 0.151 | 0.417 | 2.627 | 7.65 | 3.25 | 4.4 | 76 | -0.303 | N | 0.00 |
| 103 | 0.135 | 0.239 | 0.163 | 0.278 | 2.712 | 10.39 | 5.65 | 4.74 | 89 | -0.057 | N | 0.00 |
| 15 | 0.06 | 0.223 | 0.178 | 0.599 | 2.721 | 8.39 | 2.95 | 5.44 | 122 | N | ||
| 102 | 0.065 | -0.048 | 0.622 | 2.744 | 0.105 | 5.43 | -0.36 | 5.79 | 144 | N | 0.00 | |
| 147 | 0.021 | 0.361 | 0.155 | 0.357 | 2.593 | 9.37 | 3.54 | 5.83 | 147 | -0.474 | N | |
| 68 | 0.187 | 0.117 | 0.229 | 0.747 | 2.835 | 9.22 | 3.18 | 6.04 | 161 | N | 0.00 | |
| 99 | 0.187 | 0.125 | 0.213 | 0.772 | 2.822 | 9.33 | 2.82 | 6.51 | 200 | M | ||
| 58 | 0.141 | -0.041 | 0.749 | 2.8 | 0.132 | 6.98 | 0.33 | 6.64 | 213 | M | ||
| 61 | 0.151 | 0.016 | 1.087 | 2.866 | 0.189 | 7.62 | 0.85 | 6.77 | 226 | M | 0.20 | |
| 161 | 0.119 | -0.021 | 0.957 | 2.855 | 0.205 | 7.63 | 0.84 | 6.79 | 228 | M | ||
| 79 | 0.143 | 0.107 | 0.174 | 0.822 | 2.839 | 9.53 | 2.62 | 6.91 | 241 | M | 0.39 | |
| 91 | 0.059 | 0.152 | 0.181 | 0.8 | 2.788 | 9.28 | 2.29 | 6.99 | 249 | M | 0.00 | |
| 92 | 0.156 | 0.028 | 1.112 | 2.862 | 0.181 | 7.79 | 0.78 | 7.01 | 252 | M | ||
| 88 | 0.146 | 0.079 | 0.185 | 0.919 | 2.861 | 9.02 | 1.99 | 7.03 | 255 | M | 0.74 | |
| 52 | 0.1 | 0.066 | 0.187 | 0.994 | 2.87 | 8.57 | 1.46 | 7.11 | 264 | M | 0.89 | |
| 57 | 0.142 | 0.02 | 1.095 | 2.877 | 0.182 | 8.17 | 0.97 | 7.2 | 276 | M | 0.74 | |
| 63 | 0.126 | 0.179 | 0.166 | 0.651 | 2.772 | 10.54 | 3.28 | 7.26 | 283 | M | ||
| 97 | 0.22 | -0.016 | 0.985 | 2.858 | 0.2 | 8.16 | 0.85 | 7.3 | 289 | M | 0.92 | |
| 101 | 0.154 | 0.082 | 0.191 | 0.824 | 2.869 | 10.2 | 2.89 | 7.31 | 290 | M | 0.00 | |
| 90 | 0.256 | -0.011 | 1.005 | 2.802 | 0.192 | 7.45 | 0.12 | 7.32 | 291 | M | 0.91 | |
| 39 | 0.127 | 0.024 | 1.105 | 2.906 | 0.183 | 8.6 | 1.25 | 7.35 | 294 | M | 0.03 | |
| 44 | 0.113 | 0.146 | 0.229 | 0.751 | 2.801 | 10.26 | 2.83 | 7.43 | 306 | M | 0.91 | |
| 134 | 0.142 | 0.06 | 1.165 | 2.856 | 0.149 | 8.12 | 0.65 | 7.47 | 312 | M | 0.43 | |
| 84 | 0.201 | -0.013 | 0.998 | 2.887 | 0.187 | 8.66 | 1.14 | 7.52 | 319 | M | 0.84 | |
| 54 | 0.112 | 0.089 | 0.182 | 0.914 | 2.85 | 9.6 | 1.98 | 7.63 | 335 | M | 0.90 | |
| 179 | 0.111 | 0.065 | 1.172 | 2.875 | 0.152 | 8.52 | 0.87 | 7.65 | 339 | M | 0.86 | |
| 40 | 0.195 | -0.018 | 0.977 | 2.899 | 0.206 | 8.97 | 1.26 | 7.71 | 348 | M | 0.93 | |
| 46 | 0.113 | 0.119 | 0.187 | 0.85 | 2.822 | 9.99 | 2.24 | 7.74 | 353 | M | 0.77 | |
| 75 | 0.224 | -0.022 | 0.957 | 2.852 | 0.204 | 8.74 | 0.81 | 7.93 | 386 | M | 0.90 | |
| 77 | 0.14 | -0.065 | 0.445 | 2.73 | 0.101 | 7.59 | -0.52 | 8.11 | 419 | N | 0.70 | |
| 49 | 0.119 | 0.106 | 0.181 | 0.896 | 2.832 | 10.04 | 1.93 | 8.12 | 420 | N | 0.90 | |
| 125 | 0.163 | 0.064 | 0.179 | 1.147 | 2.851 | 7.91 | -0.21 | 8.12 | 421 | N | 0.86 | |
| 178 | 0.221 | -0.008 | 1.017 | 2.824 | 0.193 | 8.55 | 0.41 | 8.13 | 423 | N | 0.89 | |
| 110 | 0.112 | 0.127 | 0.179 | 0.908 | 2.805 | 9.69 | 1.49 | 8.2 | 437 | N | 0.92 | |
| 104 | 0.343 | -0.033 | 0.86 | 2.806 | 0.168 | 9.04 | 0.33 | 8.7 | 550 | N | ||
| 151 | 0.15 | -0.047 | 0.637 | 2.746 | 0.108 | 8.43 | -0.33 | 8.77 | 567 | N | ||
| 48 | 0.161 | 0.004 | 1.056 | 2.864 | 0.143 | 9.76 | 0.86 | 8.9 | 603 | N | 0.67 | |
| 142 | 0.142 | 0.178 | 0.153 | 0.839 | 2.749 | 10.33 | 1.22 | 9.11 | 663 | N |
6. ANALYSIS
To establish membership of the stars to the cluster, distance modulus or distance histograms (in pc) were built. In general, when the cluster is welldefined, most of the stars will follow a clear Gaussian distribution. In a few cases, the distance histograms do not show an accumulation of stars (a non-existing cluster, such as NGC 2129 in Peña & Peniche, 1994) and in one case, Peña et al. (2008) found two conspicuously defined clusters. In other cases the goodness of the method has been tested by comparing our results to the proper motion studies for a wellstudied cluster like α Per (Peña & Sareyan, 2006).
The histogram of distances for NGC 6633 (Figure 2, bottom), shows a clear accumulation at a distance around 300 pc. The histograms of distance by spectral types (Figure 2; middle, for B type stars; upper, for A and F type stars; and lower, for all type stars) are striking and cast light on the constituents of the cluster. In the lower diagram of the figure, we present the distance distribution for all the spectral types; a clear accumulation appears at a distance of 300 pc. In the upper diagram we present only the late A and F spectral types and most lie at the same level, although a peak can barely be discerned. The diagram for the B type stars (middle), shows that an accumulation occurs at the same distance, which we could interpret as the location of the main cluster. There is no doubt that most of the stars of all spectral types lie at this distance. The membership criterion adopted is that to be a member of the cluster the distance to the star should be within one sigma of the mean average distance. A Gaussian fit to the whole distribution gives 293 ± 92 pc. For the stars in the accumulation, membership is indicated by M in Table 8, whereas N denotes the non-member stars.

We have compared our membership assignment with that reported in WEBDA for NGC 6633. There are two sources that studied star membership; the majority of stars were reported by Sanders (1973) and a few by Baumgardt et al. (2000). The membership probabilities they reported are listed in the last column of Table 8.
There are 44 B, A or F type stars considered stars and twenty-three late A or F type stars. The in the distance determination for which this method rest have spectral types later than G0. For those is applicable. Of these, twenty-one are early type stars that we assign to the cluster only two, W91 and W101, have a null probability in the literature and W39 has a very low probability. The remaining stars have concordant membership probabilities.
For the more nearby stars that we define as nonmembers, WEBDA reports a null membership probability. On the other hand, for some of the distant stars, which we defined as non-members, a high membership probability was assigned in the literature.
For the member stars, a reddening E(b − y) of 0.150± 0.046, a distance modulus of 7.2 ± 0.4 and a distance of 275 ± 92 pc is found.
The age is fixed for NGC 6633 once we determine the temperature of the hottest main sequence stars (stars W63, W44 and W91). The effective temperature of these hottest stars was determined by plotting the location of all stars on the theoretical grids of Lester, Gray & Kurucz (hereinafter LGK86), after calculating the unreddened colors (Figure 3) for the correct chemical composition of the considered model. As was mentioned in the Introduction, no metallicity is reported for NGC 6633. However, Santos et al. (2012) presented weighted average metallicities for the giant stars of 18 clusters, NGC 6633 among them. They list a value of 0.04±0.01 for this cluster.

Fig. 3 Location of the unreddened points (filled squares) in the LGK86 grids. Values of effective temperature and surface gravity are indicated.
We have utilized the c 0 vs. Hβ diagram of LGK86 which allows the determination of the temperatures of the hottest stars with an accuracy of a few hundreds of degrees. The temperature for the hottest star (W 63) is around 12,500 K, but this star has a null membership probability according to Sanders (1973) although it is a member of the cluster according to our results. Once the membership and effective temperature is established for the hottest star, the age can be determined through the calibrations of Meynet, Mermilliod & Maeder (1993) as log age of 8.162 (1.45 × 10⁸ yr) from the relation log(age) = −3.611 × (logTe) + 22.956, valid in the range log Te within the limits [3.98, 4.25] for NGC 6633. All these quantities are summarized in Table 1 where we have also listed the values obtained through uvby −β photometry by Malysheva (1997) and by Piatti & Claria (1998).
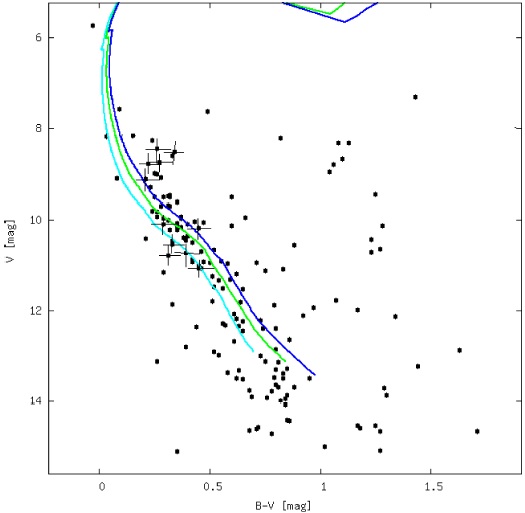
The member stars of NGC 6633 have been identified in the isochrones provided by WEBDA for the following characterisics: a DM of 7.2, a reddening E(B-V ) of 0.150, a log age of 8.162 and the models of Geneva for two different metallicities: Z of 0.019 and 0.040. As we can see in Figure 4, the identified member stars (not all were determined) fit adequately both models.
7. DISCUSSION
New uvby−β photoelectric photometry has been acquired and is presented for the brightest stars in the direction of the open cluster NGC 6633. Some observed stars in the field were found to be early type stars, either B or A. Using these calibrations to calculate the reddening and distance for these stars, the distance to the cluster was estimated. Unreddened indexes in the LGK86 grids allowed us to determine the effective temperature of the hottest stars and, hence, the age of the cluster.
8. CONCLUSIONS
The physical characteristics we determined in the present study coarsely agree with previously determined ones. As was mentioned in the beginning, the distance was fixed at 376 pc. Our determined value is 293±92 pc; the reddening E(B−V ) was 0.182 mag whereas our value of E(b − y) of 0.150 ± 0.046 gives an E(B − V ) of 0.192 ± 0.059 if the well-known relation of E(b − y) = 0.78 E(B − V ) is applied. The reported age was log(age)=8.629, whereas our determined value is 8.162. Our determined values roughly agree with the compiled values. However, the values determined from uvby − β photoelectric photometry were obtained on a star-by-star basis, whereas the literature values were obtained by the main sequence fitting method, which does not consider the membership of each star, but only the overall behavior of the all stars in a coarse statistical manner.

